
|
市場調査レポート
商品コード
1698330
デジタル製品パスポート市場の機会、成長促進要因、産業動向分析、2025年~2034年の予測Digital Product Passport Market Opportunity, Growth Drivers, Industry Trend Analysis, and Forecast 2025-2034 |
||||||
カスタマイズ可能
|
|||||||
| デジタル製品パスポート市場の機会、成長促進要因、産業動向分析、2025年~2034年の予測 |
|
出版日: 2025年02月07日
発行: Global Market Insights Inc.
ページ情報: 英文 175 Pages
納期: 2~3営業日
|

全表示
- 概要
- 目次
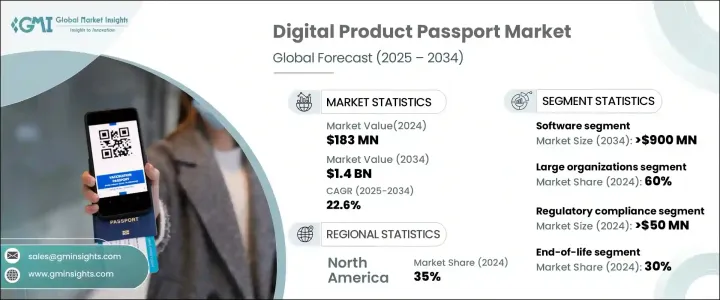
デジタル製品パスポートの世界市場は、2024年に1億8,300万米ドルと評価され、2025年から2034年にかけてCAGR 22.6%で成長すると予測されています。
循環型経済の原則が重視されるようになったことで、企業は製品の設計、使用、廃棄を見直す必要に迫られています。従来の直線的な生産・廃棄モデルとは異なり、循環型経済は廃棄物の最小化と材料の再利用の最大化に焦点を当てています。デジタル製品パスポートは、製品の構成、調達先、リサイクル可能性に関する包括的なデータを提供し、この移行の中心的役割を果たします。製品のライフサイクル全体を追跡することで、企業は修理、再利用、リサイクルが容易な製品を開発することができ、世界の持続可能性の目標に沿うことができます。
繊維、エレクトロニクス、自動車などの業界では、透明性とトレーサビリティが最優先事項となっています。欧州連合(EU)は、2026年までにEU域内で販売されるすべての製品にデジタル製品パスポートを添付することを義務付けています。このような規制の変化により、企業は製品の原産地、環境フットプリント、持続可能性に関する詳細な洞察を提供する技術を統合し、進化する業界標準へのコンプライアンスを強化する必要に迫られています。
| 市場範囲 | |
|---|---|
| 開始年 | 2024 |
| 予測年 | 2025-2034 |
| 開始金額 | 1億8,300万米ドル |
| 予測金額 | 14億米ドル |
| CAGR | 22.6% |
市場はコンポーネント別にソフトウェアとサービスに区分されます。2024年の市場シェアはソフトウェアが60%以上を占め、2034年には9億米ドルを超えると予測されます。企業は、製品情報管理を合理化するためにソフトウェア・ソリューションを導入するケースが増えています。人工知能とブロックチェーンの統合は、こうしたソリューションの有効性を高めるのに役立っています。AIはデータ分析能力を向上させ、ブロックチェーンは安全で不変な記録を保証し、透明性を強化し、データ操作のリスクを低減します。
また、同市場は組織規模別に中小企業(SME)と大企業に分類されています。大企業は、製造業、自動車、エレクトロニクスなどの業界がデジタル製品パスポート・ソリューションへの投資を続けていることから、2024年の市場シェアの約60%を占めています。こうした投資は、サプライチェーンの可視性を高め、製品のライフサイクルを監視し、厳格な持続可能性規制の遵守を保証します。さらに、企業は製品データを保護し、デジタル製品パスポートを世界な業務にシームレスに統合するために、安全でスケーラブルなソリューションを優先しています。
デジタル製品パスポートは、製品のトレーサビリティ、持続可能性、消費者エンゲージメントなど、複数の機能を提供します。2024年には、規制遵守が最も重要な市場セグメントを占め、その貢献額は5,000万米ドルを超えました。各国政府は世界中の産業に対してより厳しい規制を導入しており、企業は調達、リサイクル、持続可能性への取り組みを文書化するトレーサビリティ・ソリューションの採用を余儀なくされています。欧州連合(EU)は、サーキュラー・エコノミー(循環型経済)行動計画の一環として、環境影響評価を改善し、持続可能な製造を促進することを目的として、繊維製品などの産業に不可欠なデジタル要件を導入しました。
同市場はさらに、製品設計、流通、生産、使用済み製品管理など、ライフサイクルの段階に基づいて区分されます。使用済み製品セグメントは、規制の圧力と持続可能性への取り組みが原動力となって、2024年の市場の約30%を占めています。企業は環境基準を満たすため、製品の廃棄やリサイクルを文書化することがますます求められています。循環型経済へのシフトは、責任ある廃棄物管理と資源効率を確保するため、生産と使用後の製品を追跡するソリューションへの需要を高めています。
北米が主要地域市場に浮上し、2024年には世界シェアの約35%を占める。米国が最前線にあり、持続可能性と規制遵守への多額の投資がその原動力となっています。さまざまな業界の企業が、透明性を高め、業界の規制を満たし、持続可能性への取り組みを進めるために、デジタル製品パスポート・ソリューションを迅速に導入しています。
目次
第1章 調査手法と調査範囲
- 調査デザイン
- 調査アプローチ
- データ収集方法
- 基本推定と計算
- 基準年の算出
- 市場推計の主要動向
- 予測モデル
- 1次調査と検証
- 一次情報
- データマイニングソース
- 市場スコープと定義
第2章 エグゼクティブサマリー
第3章 業界洞察
- エコシステム分析
- 技術プロバイダー
- 規制・認証機関
- ブロックチェーン・プラットフォーム
- エンドユース
- サプライヤーの状況
- 利益率分析
- テクノロジーとイノベーションの展望
- 特許分析
- 主要ニュースと取り組み
- 規制状況
- デジタル製品パスポートのケーススタディ
- 影響要因
- 促進要因
- 規制要件の高まり
- 透明性に対する消費者の要求の高まり
- 技術の進歩
- 循環型経済への取り組みの拡大
- 業界の潜在的リスク&課題
- データの標準化と相互運用性
- 導入のコストと複雑さ
- 促進要因
- 成長可能性分析
- ポーター分析
- PESTEL分析
第4章 競合情勢
- イントロダクション
- 企業シェア分析
- 競合のポジショニング・マトリックス
- 戦略展望マトリックス
第5章 市場推計・予測:コンポーネント別、2021年~2034年
- 主要動向
- ソフトウェア
- サービス
- コンサルティング
- インテグレーション&デプロイメント
- サポート&メンテナンス
第6章 市場推計・予測:組織規模別、2021年~2034年
- 主要動向
- 中小企業
- 大企業
第7章 市場推計・予測:アプリケーション別、2021年~2034年
- 主要動向
- 製品のトレーサビリティ
- 持続可能性
- 規制コンプライアンス
- 消費者エンゲージメント
第8章 市場推計・予測:業界別、2021年~2034年
- 主要動向
- 自動車
- コンシューマーエレクトロニクス
- テキスタイル・アパレル
- 医薬品
- 飲食品
- 包装
- その他
第9章 市場推計・予測:ライフサイクルステージ別、2021年~2034年
- 主要動向
- 製品デザイン
- 流通
- 生産
- ライフサイクル終了
第10章 市場推計・予測:地域別、2021年~2034年
- 主要動向
- 北米
- 米国
- カナダ
- 欧州
- 英国
- ドイツ
- フランス
- イタリア
- スペイン
- ロシア
- 北欧
- アジア太平洋
- 中国
- インド
- 日本
- オーストラリア
- 韓国
- 東南アジア
- ラテンアメリカ
- ブラジル
- メキシコ
- アルゼンチン
- 中東・アフリカ
- UAE
- 南アフリカ
- サウジアラビア
第11章 企業プロファイル
- Avery Dennison
- Billon Group
- Circularise
- CIRPASS Consortium
- Det Norske Veritas Group(DNV)
- Eon
- Everledger
- Gemalto
- GS1
- IBM
- iPoint-systems
- Kezzler
- LyondellBasell
- Microsoft
- PSQR(Product Safety &Quality Right)
- R3
- SAP
- Siemens
- Spherity
- Zebra Technologies
The Global Digital Product Passport Market was valued at USD 183 million in 2024 and is projected to grow at a CAGR of 22.6% from 2025 to 2034. The rising emphasis on circular economic principles is prompting businesses to rethink product design, usage, and disposal. Unlike the traditional linear model of production and waste, a circular economy focuses on minimizing waste and maximizing material reuse. Digital Product Passports are central to this transition, offering comprehensive data on a product's composition, sourcing, and recyclability. By tracking items throughout their lifecycle, these passports enable businesses to develop products that are easier to repair, reuse, or recycle, aligning with global sustainability goals.
Governments worldwide are enforcing strict regulations to ensure companies adopt digital product passports, as transparency and traceability become top priorities in industries such as textiles, electronics, and automotive. The European Union has mandated that all products sold within its jurisdiction must carry a Digital Product Passport by 2026. This regulatory shift is compelling businesses to integrate technologies that provide detailed insights into a product's origin, environmental footprint, and sustainability, reinforcing compliance with evolving industry standards.
| Market Scope | |
|---|---|
| Start Year | 2024 |
| Forecast Year | 2025-2034 |
| Start Value | $183 Million |
| Forecast Value | $1.4 Billion |
| CAGR | 22.6% |
The market is segmented by component into software and services. In 2024, software dominated, with over 60% of the market share, and is anticipated to surpass USD 900 million by 2034. Companies increasingly deploy software solutions to streamline product information management. The integration of artificial intelligence and blockchain has been instrumental in enhancing the effectiveness of these solutions. AI improves data analysis capabilities, while blockchain ensures secure and immutable records, strengthening transparency and reducing data manipulation risks.
The market is also categorized by organization size into small and medium enterprises (SME) and large corporations. Large enterprises held approximately 60% of the market share in 2024, as industries such as manufacturing, automotive, and electronics continue to invest in digital product passport solutions. These investments enhance supply chain visibility, monitor product life cycles, and ensure adherence to stringent sustainability regulations. Additionally, enterprises prioritize secure and scalable solutions to protect product data and integrate digital product passports seamlessly across global operations.
Digital product passports serve multiple functions, including product traceability, sustainability, and consumer engagement. In 2024, regulatory compliance represented the most significant market segment, contributing over USD 50 million in value. Governments are introducing stricter regulations for industries worldwide, compelling businesses to adopt traceability solutions that document sourcing, recycling, and sustainability efforts. The European Union, as part of its Circular Economy Action Plan, has introduced essential digital requirements for industries such as textiles, aiming to improve environmental impact assessments and promote sustainable manufacturing.
The market is further divided based on life cycle stages, including product design, distribution, production, and end-of-life management. The end-of-life segment accounted for around 30% of the market in 2024, driven by regulatory pressures and sustainability initiatives. Companies are increasingly required to document the disposal and recycling of products to meet environmental standards. The shift toward a circular economy has heightened demand for solutions that track products beyond production and usage, ensuring responsible waste management and resource efficiency.
North America emerged as the leading regional market, holding approximately 35% of the global share in 2024. The United States is at the forefront, driven by substantial investments in sustainability and regulatory compliance. Companies across various industries are swiftly implementing digital product passport solutions to enhance transparency, meet industry regulations, and advance sustainability initiatives.
Table of Contents
Chapter 1 Methodology & Scope
- 1.1 Research design
- 1.1.1 Research approach
- 1.1.2 Data collection methods
- 1.2 Base estimates & calculations
- 1.2.1 Base year calculation
- 1.2.2 Key trends for market estimation
- 1.3 Forecast model
- 1.4 Primary research and validation
- 1.4.1 Primary sources
- 1.4.2 Data mining sources
- 1.5 Market scope & definition
Chapter 2 Executive Summary
- 2.1 Industry synopsis, 2021 - 2034
Chapter 3 Industry Insights
- 3.1 Industry ecosystem analysis
- 3.1.1 Technology providers
- 3.1.2 Regulatory and certification bodies
- 3.1.3 Blockchain platforms
- 3.1.4 End use
- 3.2 Supplier landscape
- 3.3 Profit margin analysis
- 3.4 Technology & innovation landscape
- 3.5 Patent analysis
- 3.6 Key news & initiatives
- 3.7 Regulatory landscape
- 3.8 Case study of digital product passport
- 3.9 Impact forces
- 3.9.1 Growth drivers
- 3.9.1.1 Rising regulatory requirements
- 3.9.1.2 Increasing consumer demand for transparency
- 3.9.1.3 Advancing technological advancements
- 3.9.1.4 Expanding circular economy initiatives
- 3.9.2 Industry pitfalls & challenges
- 3.9.2.1 Data standardization and interoperability
- 3.9.2.2 Cost and complexity of implementation
- 3.9.1 Growth drivers
- 3.10 Growth potential analysis
- 3.11 Porter’s analysis
- 3.12 PESTEL analysis
Chapter 4 Competitive Landscape, 2024
- 4.1 Introduction
- 4.2 Company market share analysis
- 4.3 Competitive positioning matrix
- 4.4 Strategic outlook matrix
Chapter 5 Market Estimates & Forecast, By Component, 2021 - 2034 ($ Million)
- 5.1 Key trends
- 5.2 Software
- 5.3 Services
- 5.3.1 Consulting
- 5.3.2 Integration & deployment
- 5.3.3 Support & maintenance
Chapter 6 Market Estimates & Forecast, By Organization Size, 2021 - 2034 ($ Million)
- 6.1 Key trends
- 6.2 SME
- 6.3 Large enterprises
Chapter 7 Market Estimates & Forecast, By Application, 2021 - 2034 ($ Million)
- 7.1 Key trends
- 7.2 Product traceability
- 7.3 Sustainability
- 7.4 Regulatory compliance
- 7.5 Consumer engagement
Chapter 8 Market Estimates & Forecast, By Vertical, 2021 - 2034 ($ Million)
- 8.1 Key trends
- 8.2 Automotive
- 8.3 Consumer electronics
- 8.4 Textiles and apparel
- 8.5 Pharmaceuticals
- 8.6 Food & beverage
- 8.7 Packaging
- 8.8 Others
Chapter 9 Market Estimates & Forecast, By Lifecycle Stage, 2021 - 2034 ($ Million)
- 9.1 Key trends
- 9.2 Product design
- 9.3 Distribution
- 9.4 Production
- 9.5 End of life
Chapter 10 Market Estimates & Forecast, By Region, 2021 - 2034 ($ Million)
- 10.1 Key trends
- 10.2 North America
- 10.2.1 U.S.
- 10.2.2 Canada
- 10.3 Europe
- 10.3.1 UK
- 10.3.2 Germany
- 10.3.3 France
- 10.3.4 Italy
- 10.3.5 Spain
- 10.3.6 Russia
- 10.3.7 Nordics
- 10.4 Asia Pacific
- 10.4.1 China
- 10.4.2 India
- 10.4.3 Japan
- 10.4.4 Australia
- 10.4.5 South Korea
- 10.4.6 Southeast Asia
- 10.5 Latin America
- 10.5.1 Brazil
- 10.5.2 Mexico
- 10.5.3 Argentina
- 10.6 MEA
- 10.6.1 UAE
- 10.6.2 South Africa
- 10.6.3 Saudi Arabia
Chapter 11 Company Profiles
- 11.1 Avery Dennison
- 11.2 Billon Group
- 11.3 Circularise
- 11.4 CIRPASS Consortium
- 11.5 Det Norske Veritas Group (DNV)
- 11.6 Eon
- 11.7 Everledger
- 11.8 Gemalto
- 11.9 GS1
- 11.10 IBM
- 11.11 iPoint-systems
- 11.12 Kezzler
- 11.13 LyondellBasell
- 11.14 Microsoft
- 11.15 PSQR (Product Safety & Quality Right)
- 11.16 R3
- 11.17 SAP
- 11.18 Siemens
- 11.19 Spherity
- 11.20 Zebra Technologies
