|
|
市場調査レポート
商品コード
1454693
CMOSイメージセンサーの世界市場:洞察・予測 (~2030年)Global CMOS Image Sensor Market Insights, Forecast to 2030 |
||||||
|
|||||||
カスタマイズ可能
適宜更新あり
|
|||||||

| CMOSイメージセンサーの世界市場:洞察・予測 (~2030年) |
|
出版日: 2024年03月22日
発行: QYResearch
ページ情報: 英文 173 Pages
納期: 2~3営業日
|

全表示
- 概要
- 図表
- 目次
世界のCMOSイメージセンサー市場は、2024年の208億2,000万米ドルから、2030年には366億米ドルに達する見通しで 予測期間中の年間平均成長率 (CAGR) は9.86%と予測されています。
米国・カナダのCMOSイメージセンサー市場は、2024年の26億8,780万米ドルから、2030年には43億1,000万米ドルに達する見通しで、予測期間中 (2025年~2030年) のCAGRは8.19%です。
中国のCMOSイメージセンサー市場は、2024年の77億1,000万米ドルから、2030年には141億3,000万米ドルに達する見通しで、予測期間中 (2025年~2030年) のCAGRは10.62%です。
欧州のCMOSイメージセンサー市場は、2024年の25億1,000万米ドルから、2030年には40億米ドルに達する見通しで、予測期間中 (2025年~2030年) のCAGRは8.12%です。
世界のCMOSイメージセンサーの主要メーカーには、SONY、Samsung、OmniVision、STMicroelectronics、On Semi、SK Hynix、GalaxyCore、Panasonic、Smartsens Technologyなどが含まれます。2023年には、世界の主要企業5社の収益の面でのシェアは約89.03%でした。
当レポートでは、世界のCMOSイメージセンサーの市場について分析し、種類別・用途別・地域別 (国別) の市場動向の見通し (2019年~2030年)、主要企業のプロファイルなどについて調査しております。
目次
第1章 調査範囲
- CMOSイメージセンサー:製品概略
- 種類別の市場
- CMOSイメージセンサーの市場規模:種類別 (2019年・2023年・2030年)
- 前面照明型
- 裏面照射型
- 積層型CMOSイメージセンサー
- 用途別の市場
- CMOSイメージセンサーの市場規模:用途別 (2019年・2023年・2030年)
- モバイル機器
- 自動車
- セキュリティ
- 産業用
- 医療用
- その他
- 前提と制限
- 調査目的
- 調査年数
第2章 世界のCMOSイメージセンサーの生産
- 世界のCMOSイメージセンサーの生産能力 (2019年~2030年)
- 世界のCMOSイメージセンサーの生産:地域別 (2019年・2023年・2030年)、生産拠点別
- 世界のCMOSイメージセンサーの生産:地域別
- 世界のCMOSイメージセンサーの生産実績:地域別 (2019年~2024年)
- 世界のCMOSイメージセンサーの生産予測:地域別 (2025年~2030年)
- 世界のCMOSイメージセンサーの生産シェア:地域別 (2019年~2030年)
- 北米
- 欧州
- 中国
- 日本
- 韓国
第3章 エグゼクティブサマリー
- 世界のCMOSイメージセンサーの収益、推定・予測 (2019年~2030年)
- 世界のCMOSイメージセンサーの収益:地域別
- 世界のCMOSイメージセンサーの収益:地域別 (2019年・2023年・2030年)
- 世界のCMOSイメージセンサーの収益:地域別 (2019年~2024年)
- 世界のCMOSイメージセンサーの収益:地域別 (2025年~2030年)
- 世界のCMOSイメージセンサーの収益シェア:地域別 (2019年~2030年)
- 世界のCMOSイメージセンサーの販売、推定・予測 (2019年~2030年)
- 世界のCMOSイメージセンサーの販売:地域別
- 世界のCMOSイメージセンサーの販売:地域別 (2019年・2023年・2030年)
- 世界のCMOSイメージセンサーの販売:地域別 (2019年~2024年)
- 世界のCMOSイメージセンサーの販売:地域別 (2025年~2030年)
- 世界のCMOSイメージセンサーの販売シェア:地域別 (2019年~2030年)
- 米国・カナダ
- 欧州
- 中国
- アジア (中国を除く)
- 中東・アフリカ、ラテンアメリカ
第4章 メーカー別の競合
- 世界のCMOSイメージセンサーの販売:メーカー別
- 世界のCMOSイメージセンサーの収益:メーカー別
- 世界のCMOSイメージセンサーの販売価格:メーカー別 (2019年~2024年)
- 世界のCMOSイメージセンサーの主要企業:業界ランキング (2022年・2023年)
- 競合情勢の分析
- 世界のCMOSイメージセンサーの主要メーカー:製造拠点・本社
- 世界のCMOSイメージセンサーの主要メーカー:提供製品とその用途
- 世界のCMOSイメージセンサーの主要メーカー:創立時期
- 企業合併・買収 (M&A)、拡大計画
第5章 種類別の市場規模
- 世界のCMOSイメージセンサーの販売:種類別
- 世界のCMOSイメージセンサーの収益:種類別
- 世界のCMOSイメージセンサーの価格:種類別
第6章 用途別の市場規模
- 世界のCMOSイメージセンサーの販売:用途別
- 世界のCMOSイメージセンサーの収益:用途別
- 世界のCMOSイメージセンサーの価格:用途別
第7章 米国・カナダ
- 米国・カナダのCMOSイメージセンサーの市場規模:種類別
- 米国・カナダのCMOSイメージセンサーの市場規模:用途別
- 米国・カナダのCMOSイメージセンサーの市場規模:国別
- 米国
- カナダ
第8章 欧州
- 欧州のCMOSイメージセンサーの市場規模:種類別
- 欧州のCMOSイメージセンサーの市場規模:用途別
- 欧州のCMOSイメージセンサーの市場規模:国別
- ドイツ
- フランス
- 英国
- イタリア
- ロシア
第9章 中国
- 中国のCMOSイメージセンサーの市場規模:種類別
- 中国のCMOSイメージセンサーの市場規模:用途別
第10章 アジア (中国を除く)
- アジアのCMOSイメージセンサーの市場規模:種類別
- アジアのCMOSイメージセンサーの市場規模:用途別
- アジアのCMOSイメージセンサーの市場規模:地域別
- 日本
- 韓国
- 台湾
- 東南アジア
第11章 中東・アフリカ、ラテンアメリカ
- 中東・アフリカのCMOSイメージセンサーの市場規模:種類別
- 中東・アフリカのCMOSイメージセンサーの市場規模:用途別
- 中東・アフリカのCMOSイメージセンサーの市場規模:国別
- ブラジル
- メキシコ
- イスラエル
第12章 企業プロファイル
- SONY
- Samsung
- OmniVision
- STMicroelectronics
- On Semi
- SK Hynix
- GalaxyCore
- Panasonic
- Smartsens Technology
- Canon
- SOI
第13章 産業チェーンと販売チャネルの分析
- CMOSイメージセンサーの産業チェーンの分析
- CMOSイメージセンサーの主要原材料
- CMOSイメージセンサーの生産モードとプロセス
- CMOSイメージセンサーの販売とマーケティング
- CMOSイメージセンサーの顧客
第14章 CMOSイメージセンサーの市場力学
- CMOSイメージセンサー業界の動向
- CMOSイメージセンサー市場の促進要因
- CMOSイメージセンサー市場の課題
- CMOSイメージセンサー市場の抑制要因
第15章 世界のCMOSイメージセンサー市場:主な調査結果
第16章 付録
List of Tables
- Table 1. Global CMOS Image Sensor Market Size Growth Rate by Type, 2019 VS 2023 VS 2030 (US$ Million)
- Table 2. Key Manufacturers of Back Side Illuminated
- Table 3. Key Manufacturers of Stacked CMOS Image Sensor
- Table 4. Global CMOS Image Sensor Market Size Growth Rate by Application, 2019 VS 2023 VS 2030 (US$ Million)
- Table 5. Global CMOS Image Sensor Production Growth Rate (CAGR) by Region: 2019 VS 2023 VS 2030 (M Units)
- Table 6. Global CMOS Image Sensor Production by Region (2019-2024) & (M Units)
- Table 7. Global CMOS Image Sensor Production by Region (2025-2030) & (M Units)
- Table 8. Global CMOS Image Sensor Production Market Share by Region (2019-2024)
- Table 9. Global CMOS Image Sensor Production Market Share by Region (2025-2030)
- Table 10. Global CMOS Image Sensor Revenue Grow Rate (CAGR) by Region: 2019 VS 2023 VS 2030 (US$ Million)
- Table 11. Global CMOS Image Sensor Revenue by Region (2019-2024) & (US$ Million)
- Table 12. Global CMOS Image Sensor Revenue by Region (2025-2030) & (US$ Million)
- Table 13. Global CMOS Image Sensor Revenue Market Share by Region (2019-2024)
- Table 14. Global CMOS Image Sensor Revenue Market Share by Region (2025-2030)
- Table 15. Global CMOS Image Sensor Sales Grow Rate (CAGR) by Region: 2019 VS 2023 VS 2030 (M Units)
- Table 16. Global CMOS Image Sensor Sales by Region (2019-2024) & (M Units)
- Table 17. Global CMOS Image Sensor Sales by Region (2025-2030) & (M Units)
- Table 18. Global CMOS Image Sensor Sales Market Share by Region (2019-2024)
- Table 19. Global CMOS Image Sensor Sales Market Share by Region (2025-2030)
- Table 20. Global CMOS Image Sensor Sales by Manufacturers (2019-2024) & (M Units)
- Table 21. Global CMOS Image Sensor Sales Share by Manufacturers (2019-2024)
- Table 22. Global CMOS Image Sensor Revenue by Manufacturers (2019-2024) & (US$ Million)
- Table 23. Global CMOS Image Sensor Revenue Market Share by Manufacturers (2019-2024)
- Table 24. CMOS Image Sensor Price by Manufacturers (2019-2024) & (US$/K Units)
- Table 25. Global Key Players of CMOS Image Sensor, Industry Ranking, 2022 VS 2023
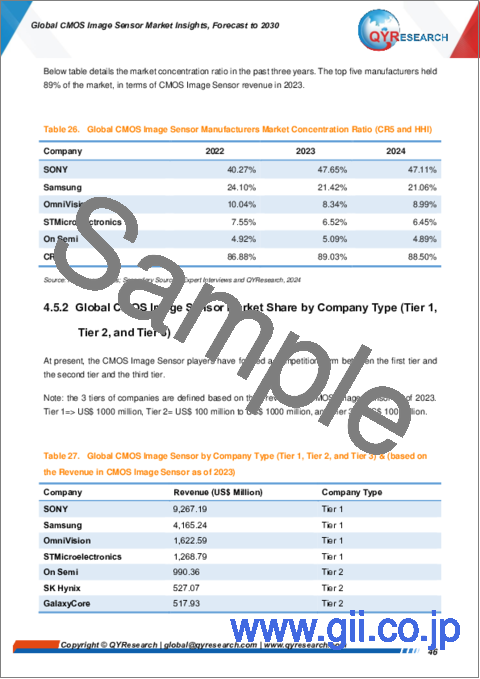
- Table 26. Global CMOS Image Sensor Manufacturers Market Concentration Ratio (CR5 and HHI)
- Table 27. Global CMOS Image Sensor by Company Type (Tier 1, Tier 2, and Tier 3) & (based on the Revenue in CMOS Image Sensor as of 2023)
- Table 28. Global Key Manufacturers of CMOS Image Sensor, Manufacturing Base Distribution and Headquarters
- Table 29. Global Key Manufacturers of CMOS Image Sensor, Product Offered and Application
- Table 30. Global Key Manufacturers of CMOS Image Sensor, Found Date
- Table 31. Mergers & Acquisitions, Expansion Plans
- Table 32. Global CMOS Image Sensor Sales by Type (2019-2024) & (M Units)
- Table 33. Global CMOS Image Sensor Sales by Type (2025-2030) & (M Units)
- Table 34. Global CMOS Image Sensor Sales Share by Type (2019-2024)
- Table 35. Global CMOS Image Sensor Sales Share by Type (2025-2030)
- Table 36. Global CMOS Image Sensor Revenue by Type (2019-2024) & (US$ Million)
- Table 37. Global CMOS Image Sensor Revenue by Type (2025-2030) & (US$ Million)
- Table 38. Global CMOS Image Sensor Revenue Share by Type (2019-2024)
- Table 39. Global CMOS Image Sensor Revenue Share by Type (2025-2030)
- Table 40. CMOS Image Sensor Price by Type (2019-2024) & (US$/K Units)
- Table 41. Global CMOS Image Sensor Price Forecast by Type (2025-2030) & (US$/K Units)
- Table 42. Global CMOS Image Sensor Sales by Application (2019-2024) & (M Units)
- Table 43. Global CMOS Image Sensor Sales by Application (2025-2030) & (M Units)
- Table 44. Global CMOS Image Sensor Sales Share by Application (2019-2024)
- Table 45. Global CMOS Image Sensor Sales Share by Application (2025-2030)
- Table 46. Global CMOS Image Sensor Revenue by Application (2019-2024) & (US$ Million)
- Table 47. Global CMOS Image Sensor Revenue by Application (2025-2030) & (US$ Million)
- Table 48. Global CMOS Image Sensor Revenue Share by Application (2019-2024)
- Table 49. Global CMOS Image Sensor Revenue Share by Application (2025-2030)
- Table 50. CMOS Image Sensor Price by Application (2019-2024) & (US$/K Units)
- Table 51. Global CMOS Image Sensor Price Forecast by Application (2025-2030) & (US$/K Units)
- Table 52. US & Canada CMOS Image Sensor Sales by Type (2019-2024) & (M Units)
- Table 53. US & Canada CMOS Image Sensor Sales by Type (2025-2030) & (M Units)
- Table 54. US & Canada CMOS Image Sensor Revenue by Type (2019-2024) & (US$ Million)
- Table 55. US & Canada CMOS Image Sensor Revenue by Type (2025-2030) & (US$ Million)
- Table 56. US & Canada CMOS Image Sensor Sales by Application (2019-2024) & (M Units)
- Table 57. US & Canada CMOS Image Sensor Sales by Application (2025-2030) & (M Units)
- Table 58. US & Canada CMOS Image Sensor Revenue by Application (2019-2024) & (US$ Million)
- Table 59. US & Canada CMOS Image Sensor Revenue by Application (2025-2030) & (US$ Million)
- Table 60. US & Canada CMOS Image Sensor Revenue Grow Rate (CAGR) by Country: 2019 VS 2023 VS 2030 (US$ Million)
- Table 61. US & Canada CMOS Image Sensor Revenue by Country (2019-2024) & (US$ Million)
- Table 62. US & Canada CMOS Image Sensor Revenue by Country (2025-2030) & (US$ Million)
- Table 63. US & Canada CMOS Image Sensor Sales by Country (2019-2024) & (M Units)
- Table 64. US & Canada CMOS Image Sensor Sales by Country (2025-2030) & (M Units)
- Table 65. Europe CMOS Image Sensor Sales by Type (2019-2024) & (M Units)
- Table 66. Europe CMOS Image Sensor Sales by Type (2025-2030) & (M Units)
- Table 67. Europe CMOS Image Sensor Revenue by Type (2019-2024) & (US$ Million)
- Table 68. Europe CMOS Image Sensor Revenue by Type (2025-2030) & (US$ Million)
- Table 69. Europe CMOS Image Sensor Sales by Application (2019-2024) & (M Units)
- Table 70. Europe CMOS Image Sensor Sales by Application (2025-2030) & (M Units)
- Table 71. Europe CMOS Image Sensor Revenue by Application (2019-2024) & (US$ Million)
- Table 72. Europe CMOS Image Sensor Revenue by Application (2025-2030) & (US$ Million)
- Table 73. Europe CMOS Image Sensor Revenue Grow Rate (CAGR) by Country: 2019 VS 2023 VS 2030 (US$ Million)
- Table 74. Europe CMOS Image Sensor Sales by Country (2019-2024) & (M Units)
- Table 75. Europe CMOS Image Sensor Sales by Country (2025-2030) & (M Units)
- Table 76. Europe CMOS Image Sensor Revenue by Country (2019-2024) & (US$ Million)
- Table 77. Europe CMOS Image Sensor Revenue by Country (2025-2030) & (US$ Million)
- Table 78. China CMOS Image Sensor Sales by Type (2019-2024) & (M Units)
- Table 79. China CMOS Image Sensor Sales by Type (2025-2030) & (M Units)
- Table 80. China CMOS Image Sensor Revenue by Type (2019-2024) & (US$ Million)
- Table 81. China CMOS Image Sensor Revenue by Type (2025-2030) & (US$ Million)
- Table 82. China CMOS Image Sensor Sales by Application (2019-2024) & (M Units)
- Table 83. China CMOS Image Sensor Sales by Application (2025-2030) & (M Units)
- Table 84. China CMOS Image Sensor Revenue by Application (2019-2024) & (US$ Million)
- Table 85. China CMOS Image Sensor Revenue by Application (2025-2030) & (US$ Million)
- Table 86. Asia CMOS Image Sensor Sales by Type (2019-2024) & (M Units)
- Table 87. Asia CMOS Image Sensor Sales by Type (2025-2030) & (M Units)
- Table 88. Asia CMOS Image Sensor Revenue by Type (2019-2024) & (US$ Million)
- Table 89. Asia CMOS Image Sensor Revenue by Type (2025-2030) & (US$ Million)
- Table 90. Asia CMOS Image Sensor Sales by Application (2019-2024) & (M Units)
- Table 91. Asia CMOS Image Sensor Sales by Application (2025-2030) & (M Units)
- Table 92. Asia CMOS Image Sensor Revenue by Application (2019-2024) & (US$ Million)
- Table 93. Asia CMOS Image Sensor Revenue by Application (2025-2030) & (US$ Million)
- Table 94. Asia CMOS Image Sensor Revenue Grow Rate (CAGR) by Region: 2019 VS 2023 VS 2030 (US$ Million)
- Table 95. Asia CMOS Image Sensor Revenue by Region (2019-2024) & (US$ Million)
- Table 96. Asia CMOS Image Sensor Revenue by Region (2025-2030) & (US$ Million)
- Table 97. Asia CMOS Image Sensor Sales by Region (2019-2024) & (M Units)
- Table 98. Asia CMOS Image Sensor Sales by Region (2025-2030) & (M Units)
- Table 99. Middle East, Africa and Latin America CMOS Image Sensor Sales by Type (2019-2024) & (M Units)
- Table 100. Middle East, Africa and Latin America CMOS Image Sensor Sales by Type (2025-2030) & (M Units)
- Table 101. Middle East, Africa and Latin America CMOS Image Sensor Revenue by Type (2019-2024) & (US$ Million)
- Table 102. Middle East, Africa and Latin America CMOS Image Sensor Revenue by Type (2025-2030) & (US$ Million)
- Table 103. Middle East, Africa and Latin America CMOS Image Sensor Sales by Application (2019-2024) & (M Units)
- Table 104. Middle East, Africa and Latin America CMOS Image Sensor Sales by Application (2025-2030) & (M Units)
- Table 105. Middle East, Africa and Latin America CMOS Image Sensor Revenue by Application (2019-2024) & (US$ Million)
- Table 106. Middle East, Africa and Latin America CMOS Image Sensor Revenue by Application (2025-2030) & (US$ Million)
- Table 107. Middle East, Africa and Latin America CMOS Image Sensor Revenue Grow Rate (CAGR) by Country: 2019 VS 2023 VS 2030 (US$ Million)
- Table 108. Middle East, Africa and Latin America CMOS Image Sensor Revenue by Country (2019-2024) & (US$ Million)
- Table 109. Middle East, Africa and Latin America CMOS Image Sensor Revenue by Country (2025-2030) & (US$ Million)
- Table 110. Middle East, Africa and Latin America CMOS Image Sensor Sales by Country (2019-2024) & (M Units)
- Table 111. Middle East, Africa and Latin America CMOS Image Sensor Sales by Country (2025-2030) & (M Units)
- Table 112. SONY Corporation Information
- Table 113. SONY Description and Major Businesses
- Table 114. SONY CMOS Image Sensor Sales (M Units), Revenue (US$ Million), Price (US$/Unit) and Gross Margin (2019-2024)
- Table 115. SONY CMOS Image Sensor Product Model Numbers, Pictures, Descriptions and Specifications
- Table 116. SONY Recent Developments
- Table 117. Samsung Corporation Information
- Table 118. Samsung Description and Major Businesses
- Table 119. Samsung CMOS Image Sensor Sales (M Units), Revenue (US$ Million), Price (US$/Unit) and Gross Margin (2019-2024)
- Table 120. Samsung CMOS Image Sensor Product Model Numbers, Pictures, Descriptions and Specifications
- Table 121. Samsung Recent Developments
- Table 122. OmniVision Corporation Information
- Table 123. OmniVision Description and Major Businesses
- Table 124. OmniVision CMOS Image Sensor Sales (M Units), Revenue (US$ Million), Price (US$/Unit) and Gross Margin (2019-2024)
- Table 125. OmniVision CMOS Image Sensor Revenue, Expenses and Profits in Different Applications in 2023 (US$ Million)
- Table 126. OmniVision CMOS Image Sensor Product Model Numbers, Pictures, Descriptions and Specifications
- Table 127. OmniVision Recent Developments
- Table 128. STMicroelectronics Corporation Information
- Table 129. STMicroelectronics Description and Major Businesses
- Table 130. STMicroelectronics CMOS Image Sensor Sales (M Units), Revenue (US$ Million), Price (US$/Unit) and Gross Margin (2019-2024)
- Table 131. STMicroelectronics CMOS Image Sensor Product Model Numbers, Pictures, Descriptions and Specifications
- Table 132. STMicroelectronics Recent Developments
- Table 133. On Semi Corporation Information
- Table 134. On Semi Description and Major Businesses
- Table 135. On Semi CMOS Image Sensor Sales (M Units), Revenue (US$ Million), Price (US$/Unit) and Gross Margin (2019-2024)
- Table 136. On Semi CMOS Image Sensor Product Model Numbers, Pictures, Descriptions and Specifications
- Table 137. On Semi Recent Developments
- Table 138. SK Hynix Corporation Information
- Table 139. SK Hynix Description and Major Businesses
- Table 140. SK Hynix CMOS Image Sensor Sales (M Units), Revenue (US$ Million), Price (US$/Unit) and Gross Margin (2019-2024)
- Table 141. SK Hynix CMOS Image Sensor Product Model Numbers, Pictures, Descriptions and Specifications
- Table 142. SK Hynix Recent Developments
- Table 143. GalaxyCore Corporation Information
- Table 144. GalaxyCore Description and Major Businesses
- Table 145. GalaxyCore CMOS Image Sensor Sales (M Units), Revenue (US$ Million), Price (US$/Unit) and Gross Margin (2019-2024)
- Table 146. GalaxyCore CMOS Image Sensor Product Model Numbers, Pictures, Descriptions and Specifications
- Table 147. GalaxyCore Recent Developments
- Table 148. Panasonic Corporation Information
- Table 149. Panasonic Description and Major Businesses
- Table 150. Panasonic CMOS Image Sensor Sales (M Units), Revenue (US$ Million), Price (US$/Unit) and Gross Margin (2019-2024)
- Table 151. Panasonic CMOS Image Sensor Product Model Numbers, Pictures, Descriptions and Specifications
- Table 152. Panasonic Recent Developments
- Table 153. Smartsens Technology Corporation Information
- Table 154. Smartsens Technology Description and Major Businesses
- Table 155. Smartsens Technology CMOS Image Sensor Sales (M Units), Revenue (US$ Million), Price (US$/Unit) and Gross Margin (2019-2024)
- Table 156. Smartsens Technology CMOS Image Sensor Product Model Numbers, Pictures, Descriptions and Specifications
- Table 157. Smartsens Technology Recent Developments
- Table 158. Canon Corporation Information
- Table 159. Canon Description and Major Businesses
- Table 160. Canon CMOS Image Sensor Sales (M Units), Revenue (US$ Million), Price (US$/Unit) and Gross Margin (2019-2024)
- Table 161. Canon CMOS Image Sensor Product Model Numbers, Pictures, Descriptions and Specifications
- Table 162. Canon Recent Developments
- Table 163. SOI Corporation Information
- Table 164. SOI Description and Major Businesses
- Table 165. SOI CMOS Image Sensor Sales (M Units), Revenue (US$ Million), Price (US$/Unit) and Gross Margin (2019-2024)
- Table 166. SOI CMOS Image Sensor Product Model Numbers, Pictures, Descriptions and Specifications
- Table 167. SOI Recent Developments
- Table 168. Key Raw Materials Lists
- Table 169. Raw Materials Key Suppliers Lists
- Table 170. CMOS Image Sensor Distributors List
- Table 171. CMOS Image Sensor Customers List
- Table 172. CMOS Image Sensor Market Trends
- Table 173. CMOS Image Sensor Market Drivers
- Table 174. CMOS Image Sensor Market Challenges
- Table 175. CMOS Image Sensor Market Restraints
- Table 176. Research Programs/Design for This Report
- Table 177. Key Data Information from Secondary Sources
- Table 178. Key Data Information from Primary Sources
List of Figures
- Figure 1. CMOS Image Sensor Product Picture
- Figure 2. Global CMOS Image Sensor Market Size Growth Rate by Type, 2019 VS 2023 VS 2030 (US$ Million)
- Figure 3. Global CMOS Image Sensor Market Share by Type: 2023 & 2030
- Figure 4. Front Side Illuminated Product Picture
- Figure 5. Key Manufacturers of Front Side Illuminated
- Figure 6. Back Side Illuminated Product Picture
- Figure 7. Stacked CMOS Image Sensor Product Picture
- Figure 8. Global CMOS Image Sensor Market Size Growth Rate by Application, 2019 VS 2023 VS 2030 (US$ Million)
- Figure 9. Global CMOS Image Sensor Market Share by Application in 2023 & 2030
- Figure 10. Mobile
- Figure 11. Automotive
- Figure 12. Security
- Figure 13. Industrial
- Figure 14. Medical
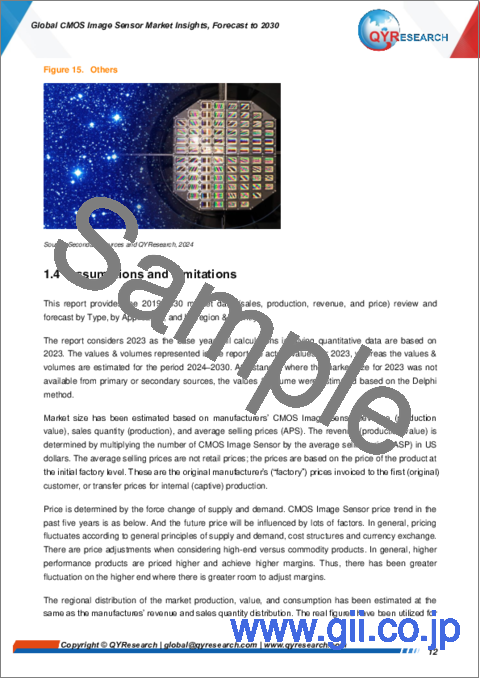
- Figure 15. Others
- Figure 16. CMOS Image Sensor Report Years Considered
- Figure 17. Global CMOS Image Sensor Capacity, Production and Utilization (2019-2030) & (M Units)
- Figure 18. Global CMOS Image Sensor Production by Region: 2019 VS 2023 VS 2030 (M Units)
- Figure 19. Global CMOS Image Sensor Production Market Share by Region in Percentage: 2023 Versus 2030
- Figure 20. Global CMOS Image Sensor Production Market Share by Region (2019-2030)
- Figure 21. CMOS Image Sensor Production Growth Rate in North America (2019-2030) & (M Units)
- Figure 22. CMOS Image Sensor Production Growth Rate in Europe (2019-2030) & (M Units)
- Figure 23. CMOS Image Sensor Production Growth Rate in China (2019-2030) & (M Units)
- Figure 24. CMOS Image Sensor Production Growth Rate in Japan (2019-2030) & (M Units)
- Figure 25. CMOS Image Sensor Production Growth Rate in South Korea (2019-2030) & (M Units)
- Figure 26. Global CMOS Image Sensor Revenue, (US$ Million), 2019 VS 2023 VS 2030
- Figure 27. Global CMOS Image Sensor Revenue 2019-2030 (US$ Million)
- Figure 28. Global CMOS Image Sensor Revenue by Region: 2019 VS 2023 VS 2030 (US$ Million)
- Figure 29. Global CMOS Image Sensor Revenue Market Share by Region in Percentage: 2023 Versus 2030
- Figure 30. Global CMOS Image Sensor Sales (2019-2030) & (M Units)
- Figure 31. Global CMOS Image Sensor Sales (CAGR) by Region: 2019 VS 2023 VS 2030 (M Units)
- Figure 32. US & Canada CMOS Image Sensor Sales YoY (2019-2030) & (M Units)
- Figure 33. US & Canada CMOS Image Sensor Revenue YoY (2019-2030) & (US$ Million)
- Figure 34. Europe CMOS Image Sensor Sales YoY (2019-2030) & (M Units)
- Figure 35. Europe CMOS Image Sensor Revenue YoY (2019-2030) & (US$ Million)
- Figure 36. China CMOS Image Sensor Sales YoY (2019-2030) & (M Units)
- Figure 37. China CMOS Image Sensor Revenue YoY (2019-2030) & (US$ Million)
- Figure 38. Asia (excluding China) CMOS Image Sensor Sales YoY (2019-2030) & (M Units)
- Figure 39. Asia (excluding China) CMOS Image Sensor Revenue YoY (2019-2030) & (US$ Million)
- Figure 40. Middle East, Africa and Latin America CMOS Image Sensor Sales YoY (2019-2030) & (M Units)
- Figure 41. Middle East, Africa and Latin America CMOS Image Sensor Revenue YoY (2019-2030) & (US$ Million)
- Figure 42. Global CMOS Image Sensor Sales Share by Manufacturers (2023)
- Figure 43. The CMOS Image Sensor Market Share of Top 10 and Top 5 Largest Manufacturers Around the World in 2023
- Figure 44. Global CMOS Image Sensor Revenue Share by Manufacturers (2023)
- Figure 45. The Top 5 and 10 Largest Manufacturers of CMOS Image Sensor in the World: Market Share by CMOS Image Sensor Revenue in 2023
- Figure 46. Global CMOS Image Sensor Sales Market Share by Type (2019-2030)
- Figure 47. Global CMOS Image Sensor Revenue Market Share by Type (2019-2030)
- Figure 48. Global CMOS Image Sensor Sales Market Share by Application (2019-2030)
- Figure 49. Global CMOS Image Sensor Revenue Market Share by Application (2019-2030)
- Figure 50. US & Canada CMOS Image Sensor Sales Market Share by Type (2019-2030)
- Figure 51. US & Canada CMOS Image Sensor Sales Market Share by Application (2019-2030)
- Figure 52. US & Canada CMOS Image Sensor Revenue Share by Country (2019-2030)
- Figure 53. US & Canada CMOS Image Sensor Sales Share by Country (2019-2030)
- Figure 54. US CMOS Image Sensor Revenue (2019-2030) & (US$ Million)
- Figure 55. Canada CMOS Image Sensor Revenue (2019-2030) & (US$ Million)
- Figure 56. Germany CMOS Image Sensor Revenue (2019-2030) & (US$ Million)
- Figure 57. France CMOS Image Sensor Revenue (2019-2030) & (US$ Million)
- Figure 58. U.K. CMOS Image Sensor Revenue (2019-2030) & (US$ Million)
- Figure 59. Italy CMOS Image Sensor Revenue (2019-2030) & (US$ Million)
- Figure 60. Russia CMOS Image Sensor Revenue (2019-2030) & (US$ Million)
- Figure 61. Japan CMOS Image Sensor Revenue (2019-2030) & (US$ Million)
- Figure 62. South Korea CMOS Image Sensor Revenue (2019-2030) & (US$ Million)
- Figure 63. China Taiwan CMOS Image Sensor Revenue (2019-2030) & (US$ Million)
- Figure 64. Southeast Asia CMOS Image Sensor Revenue (2019-2030) & (US$ Million)
- Figure 65. Brazil CMOS Image Sensor Revenue (2019-2030) & (US$ Million)
- Figure 66. Mexico CMOS Image Sensor Revenue (2019-2030) & (US$ Million)
- Figure 67. Israel CMOS Image Sensor Revenue (2019-2030) & (US$ Million)
- Figure 68. CMOS Image Sensor Value Chain
- Figure 69. CMOS Image Sensor Production Process
- Figure 70. Bottom-up and Top-down Approaches for This Report
- Figure 71. Data Triangulation
- Figure 72. Key Executives Interviewed
The global CMOS Image Sensor market is projected to grow from US$ 20.82 billion in 2024 to US$ 36. 60 billion by 2030, at a Compound Annual Growth Rate (CAGR) of 9.86% during the forecast period.
The US & Canada market for CMOS Image Sensor is estimated to increase from $ 2,687.80 million in 2024 to reach $ 4.31 billion by 2030, at a CAGR of 8.19% during the forecast period of 2025 through 2030.
The China market for CMOS Image Sensor is estimated to increase from $ 7.71 billion in 2024 to reach $ 14.13 billion by 2030, at a CAGR of 10.62% during the forecast period of 2025 through 2030.
The Europe market for CMOS Image Sensor is estimated to increase from $ 2.51 billion in 2024 to reach $ 4.0 billion by 2030, at a CAGR of 8.12% during the forecast period of 2025 through 2030.
The global key manufacturers of CMOS Image Sensor include SONY, Samsung, OmniVision, STMicroelectronics, On Semi, SK Hynix, GalaxyCore, Panasonic, and Smartsens Technology, etc. In 2023, the global top five players had a share approximately 89.03% in terms of revenue.
In terms of production side, this report researches the CMOS Image Sensor production, growth rate, market share by manufacturers and by region (region level and country level), from 2019 to 2024, and forecast to 2030.
In terms of consumption side, this report focuses on the sales of CMOS Image Sensor by region (region level and country level), by company, by Type and by Application. from 2019 to 2024 and forecast to 2030.
This report presents an overview of global market for CMOS Image Sensor, capacity, output, revenue and price. Analyses of the global market trends, with historic market revenue/sales data for 2019 - 2024, estimates for 2024, and projections of CAGR through 2030.
This report researches the key producers of CMOS Image Sensor, also provides the consumption of main regions and countries. Highlights of the upcoming market potential for CMOS Image Sensor, and key regions/countries of focus to forecast this market into various segments and sub-segments. Country specific data and market value analysis for the U.S., Canada, Mexico, Brazil, China, Japan, South Korea, Southeast Asia, India, Germany, the U.K., Italy, Middle East, Africa, and Other Countries.
This report focuses on the CMOS Image Sensor sales, revenue, market share and industry ranking of main manufacturers, data from 2019 to 2024. Identification of the major stakeholders in the global CMOS Image Sensor market, and analysis of their competitive landscape and market positioning based on recent developments and segmental revenues. This report will help stakeholders to understand the competitive landscape and gain more insights and position their businesses and market strategies in a better way.
This report analyzes the segments data by Type and by Application, sales, revenue, and price, from 2019 to 2030. Evaluation and forecast the market size for CMOS Image Sensor sales, projected growth trends, production technology, application and end-user industry.
Descriptive company profiles of the major global players, including SONY, Samsung, OmniVision, STMicroelectronics, On Semi, SK Hynix, GalaxyCore, Panasonic, and Smartsens Technology, etc.
Market Segmentation
By Company
- SONY
- Samsung
- OmniVision
- STMicroelectronics
- On Semi
- SK Hynix
- GalaxyCore
- Panasonic
- Smartsens Technology
- Canon
- SOI
Segment by Type
- Front Side Illuminated
- Back Side Illuminated
- Stacked CMOS Image Sensor
Segment by Application
- Mobile
- Automotive
- Security
- Industrial
- Medical
- Others
Production by Region
- North America
- Europe
- China
- Japan
- South Korea
Sales by Region
US & Canada
- U.S.
- Canada
China
Asia (excluding China)
- Japan
- South Korea
- China Taiwan
- Southeast Asia
Europe
- Germany
- France
- U.K.
- Italy
- Russia
- Others
Middle East, Africa, Latin America
- Brazil
- Mexico
- Israel
Chapter Outline
Chapter 1: Introduces the report scope of the report, executive summary of different market segments (by Type and by Application, etc), including the market size of each market segment, future development potential, and so on. It offers a high-level view of the current state of the market and its likely evolution in the short to mid-term, and long term.
Chapter 2: CMOS Image Sensor production/output of global and key producers (regions/countries). It provides a quantitative analysis of the production, and development potential of each producer in the next six years.
Chapter 3: Sales (consumption), revenue of CMOS Image Sensor in global, regional level and country level. It provides a quantitative analysis of the market size and development potential of each region and its main countries and introduces the market development, future development prospects, market space of each country in the world.
Chapter 4: Detailed analysis of CMOS Image Sensor manufacturers competitive landscape, price, sales, revenue, market share and industry ranking, latest development plan, merger, and acquisition information, etc.
Chapter 5: Provides the analysis of various market segments by Type, covering the sales, revenue, average price, and development potential of each market segment, to help readers find the blue ocean market in different market segments.
Chapter 6: Provides the analysis of various market segments by Application, covering the sales, revenue, average price, and development potential of each market segment, to help readers find the blue ocean market in different downstream markets.
Chapter 7: North America (US & Canada) by Type, by Application and by country, sales, and revenue for each segment.
Chapter 8: Europe by Type, by Application and by country, sales, and revenue for each segment.
Chapter 9: China by Type, and by Application, sales, and revenue for each segment.
Chapter 10: Asia (excluding China) by Type, by Application and by region, sales, and revenue for each segment.
Chapter 11: Middle East, Africa, Latin America by Type, by Application and by country, sales, and revenue for each segment.
Chapter 12: Provides profiles of key manufacturers, introducing the basic situation of the main companies in the market in detail, including product descriptions and specifications, CMOS Image Sensor sales, revenue, price, gross margin, and recent development, etc.
Chapter 13: Analysis of industrial chain, sales channel, key raw materials, distributors and customers.
Chapter 14: Introduces the market dynamics, latest developments of the market, the driving factors and restrictive factors of the market, the challenges and risks faced by manufacturers in the industry, and the analysis of relevant policies in the industry.
Chapter 15: The main points and conclusions of the report.
Table of Contents
1 Study Coverage
- 1.1 CMOS Image Sensor Product Introduction
- 1.2 Market by Type
- 1.2.1 Global CMOS Image Sensor Market Size by Type, 2019 VS 2023 VS 2030
- 1.2.2 Front Side Illuminated
- 1.2.3 Back Side Illuminated
- 1.2.4 Stacked CMOS Image Sensor
- 1.3 Market by Application
- 1.3.1 Global CMOS Image Sensor Market Size by Application, 2019 VS 2023 VS 2030
- 1.3.2 Mobile
- 1.3.3 Automotive
- 1.3.4 Security
- 1.3.5 Industrial
- 1.3.6 Medical
- 1.3.7 Others
- 1.4 Assumptions and Limitations
- 1.5 Study Objectives
- 1.6 Years Considered
2 Global CMOS Image Sensor Production
- 2.1 Global CMOS Image Sensor Production Capacity (2019-2030)
- 2.2 Global CMOS Image Sensor Production by Region: 2019 VS 2023 VS 2030, Based on Production Site
- 2.3 Global CMOS Image Sensor Production by Region
- 2.3.1 Global CMOS Image Sensor Historic Production by Region (2019-2024)
- 2.3.2 Global CMOS Image Sensor Forecasted Production by Region (2025-2030)
- 2.3.3 Global CMOS Image Sensor Production Market Share by Region (2019-2030)
- 2.4 North America
- 2.5 Europe
- 2.6 China
- 2.7 Japan
- 2.8 South Korea
3 Executive Summary
- 3.1 Global CMOS Image Sensor Revenue Estimates and Forecasts 2019-2030
- 3.2 Global CMOS Image Sensor Revenue by Region
- 3.2.1 Global CMOS Image Sensor Revenue by Region: 2019 VS 2023 VS 2030
- 3.2.2 Global CMOS Image Sensor Revenue by Region (2019-2024)
- 3.2.3 Global CMOS Image Sensor Revenue by Region (2025-2030)
- 3.2.4 Global CMOS Image Sensor Revenue Market Share by Region (2019-2030)
- 3.3 Global CMOS Image Sensor Sales Estimates and Forecasts 2019-2030
- 3.4 Global CMOS Image Sensor Sales by Region
- 3.4.1 Global CMOS Image Sensor Sales by Region: 2019 VS 2023 VS 2030
- 3.4.2 Global CMOS Image Sensor Sales by Region (2019-2024)
- 3.4.3 Global CMOS Image Sensor Sales by Region (2025-2030)
- 3.4.4 Global CMOS Image Sensor Sales Market Share by Region (2019-2030)
- 3.5 US & Canada
- 3.6 Europe
- 3.7 China
- 3.8 Asia (excluding China)
- 3.9 Middle East, Africa and Latin America
4 Competition by Manufacturers
- 4.1 Global CMOS Image Sensor Sales by Manufacturers
- 4.1.1 Global CMOS Image Sensor Sales by Manufacturers (2019-2024)
- 4.1.2 Global CMOS Image Sensor Sales Market Share by Manufacturers (2019-2024)
- 4.1.3 Global Top 10 and Top 5 Largest Manufacturers of CMOS Image Sensor in 2023
- 4.2 Global CMOS Image Sensor Revenue by Manufacturers
- 4.2.1 Global CMOS Image Sensor Revenue by Manufacturers (2019-2024)
- 4.2.2 Global CMOS Image Sensor Revenue Market Share by Manufacturers (2019-2024)
- 4.2.3 Global Top 10 and Top 5 Companies by CMOS Image Sensor Revenue in 2023
- 4.3 Global CMOS Image Sensor Sales Price by Manufacturers (2019-2024)
- 4.4 Global Key Players of CMOS Image Sensor, Industry Ranking, 2022 VS 2023
- 4.5 Analysis of Competitive Landscape
- 4.5.1 Manufacturers Market Concentration Ratio (CR5 and HHI)
- 4.5.2 Global CMOS Image Sensor Market Share by Company Type (Tier 1, Tier 2, and Tier 3)
- 4.6 Global Key Manufacturers of CMOS Image Sensor, Manufacturing Base Distribution and Headquarters
- 4.7 Global Key Manufacturers of CMOS Image Sensor, Product Offered and Application
- 4.8 Global Key Manufacturers of CMOS Image Sensor, Found Date
- 4.9 Mergers & Acquisitions, Expansion Plans
5 Market Size by Type
- 5.1 Global CMOS Image Sensor Sales by Type
- 5.1.1 Global CMOS Image Sensor Historical Sales by Type (2019-2024)
- 5.1.2 Global CMOS Image Sensor Forecasted Sales by Type (2025-2030)
- 5.1.3 Global CMOS Image Sensor Sales Market Share by Type (2019-2030)
- 5.2 Global CMOS Image Sensor Revenue by Type
- 5.2.1 Global CMOS Image Sensor Historical Revenue by Type (2019-2024)
- 5.2.2 Global CMOS Image Sensor Forecasted Revenue by Type (2025-2030)
- 5.2.3 Global CMOS Image Sensor Revenue Market Share by Type (2019-2030)
- 5.3 Global CMOS Image Sensor Price by Type
- 5.3.1 Global CMOS Image Sensor Price by Type (2019-2024)
- 5.3.2 Global CMOS Image Sensor Price Forecast by Type (2025-2030)
6 Market Size by Application
- 6.1 Global CMOS Image Sensor Sales by Application
- 6.1.1 Global CMOS Image Sensor Historical Sales by Application (2019-2024)
- 6.1.2 Global CMOS Image Sensor Forecasted Sales by Application (2025-2030)
- 6.1.3 Global CMOS Image Sensor Sales Market Share by Application (2019-2030)
- 6.2 Global CMOS Image Sensor Revenue by Application
- 6.2.1 Global CMOS Image Sensor Historical Revenue by Application (2019-2024)
- 6.2.2 Global CMOS Image Sensor Forecasted Revenue by Application (2025-2030)
- 6.2.3 Global CMOS Image Sensor Revenue Market Share by Application (2019-2030)
- 6.3 Global CMOS Image Sensor Price by Application
- 6.3.1 Global CMOS Image Sensor Price by Application (2019-2024)
- 6.3.2 Global CMOS Image Sensor Price Forecast by Application (2025-2030)
7 US & Canada
- 7.1 US & Canada CMOS Image Sensor Market Size by Type
- 7.1.1 US & Canada CMOS Image Sensor Sales by Type (2019-2030)
- 7.1.2 US & Canada CMOS Image Sensor Revenue by Type (2019-2030)
- 7.2 US & Canada CMOS Image Sensor Market Size by Application
- 7.2.1 US & Canada CMOS Image Sensor Sales by Application (2019-2030)
- 7.2.2 US & Canada CMOS Image Sensor Revenue by Application (2019-2030)
- 7.3 US & Canada CMOS Image Sensor Market Size by Country
- 7.3.1 US & Canada CMOS Image Sensor Revenue by Country: 2019 VS 2023 VS 2030
- 7.3.2 US & Canada CMOS Image Sensor Revenue by Country (2019-2030)
- 7.3.3 US & Canada CMOS Image Sensor Sales by Country (2019-2030)
- 7.3.4 US
- 7.3.5 Canada
8 Europe
- 8.1 Europe CMOS Image Sensor Market Size by Type
- 8.1.1 Europe CMOS Image Sensor Sales by Type (2019-2030)
- 8.1.2 Europe CMOS Image Sensor Revenue by Type (2019-2030)
- 8.2 Europe CMOS Image Sensor Market Size by Application
- 8.2.1 Europe CMOS Image Sensor Sales by Application (2019-2030)
- 8.2.2 Europe CMOS Image Sensor Revenue by Application (2019-2030)
- 8.3 Europe CMOS Image Sensor Market Size by Country
- 8.3.1 Europe CMOS Image Sensor Revenue by Country: 2019 VS 2023 VS 2030
- 8.3.2 Europe CMOS Image Sensor Sales by Country (2019-2030)
- 8.3.3 Europe CMOS Image Sensor Revenue by Country (2019-2030)
- 8.3.4 Germany
- 8.3.5 France
- 8.3.6 U.K.
- 8.3.7 Italy
- 8.3.8 Russia
9 China
- 9.1 China CMOS Image Sensor Market Size by Type
- 9.1.1 China CMOS Image Sensor Sales by Type (2019-2030)
- 9.1.2 China CMOS Image Sensor Revenue by Type (2019-2030)
- 9.2 China CMOS Image Sensor Market Size by Application
- 9.2.1 China CMOS Image Sensor Sales by Application (2019-2030)
- 9.2.2 China CMOS Image Sensor Revenue by Application (2019-2030)
10 Asia (excluding China)
- 10.1 Asia CMOS Image Sensor Market Size by Type
- 10.1.1 Asia CMOS Image Sensor Sales by Type (2019-2030)
- 10.1.2 Asia CMOS Image Sensor Revenue by Type (2019-2030)
- 10.2 Asia CMOS Image Sensor Market Size by Application
- 10.2.1 Asia CMOS Image Sensor Sales by Application (2019-2030)
- 10.2.2 Asia CMOS Image Sensor Revenue by Application (2019-2030)
- 10.3 Asia CMOS Image Sensor Market Size by Region
- 10.3.1 Asia CMOS Image Sensor Revenue by Region: 2019 VS 2023 VS 2030
- 10.3.2 Asia CMOS Image Sensor Revenue by Region (2019-2030)
- 10.3.3 Asia CMOS Image Sensor Sales by Region (2019-2030)
- 10.3.4 Japan
- 10.3.5 South Korea
- 10.3.6 China Taiwan
- 10.3.7 Southeast Asia
11 Middle East, Africa and Latin America
- 11.1 Middle East, Africa and Latin America CMOS Image Sensor Market Size by Type
- 11.1.1 Middle East, Africa and Latin America CMOS Image Sensor Sales by Type (2019-2030)
- 11.1.2 Middle East, Africa and Latin America CMOS Image Sensor Revenue by Type (2019-2030)
- 11.2 Middle East, Africa and Latin America CMOS Image Sensor Market Size by Application
- 11.2.1 Middle East, Africa and Latin America CMOS Image Sensor Sales by Application (2019-2030)
- 11.2.2 Middle East, Africa and Latin America CMOS Image Sensor Revenue by Application (2019-2030)
- 11.3 Middle East, Africa and Latin America CMOS Image Sensor Market Size by Country
- 11.3.1 Middle East, Africa and Latin America CMOS Image Sensor Revenue by Country: 2019 VS 2023 VS 2030
- 11.3.2 Middle East, Africa and Latin America CMOS Image Sensor Revenue by Country (2019-2030)
- 11.3.3 Middle East, Africa and Latin America CMOS Image Sensor Sales by Country (2019-2030)
- 11.3.4 Brazil
- 11.3.5 Mexico
- 11.3.6 Israel
12 Corporate Profile
- 12.1 SONY
- 12.1.1 SONY Corporation Information
- 12.1.2 SONY Overview
- 12.1.3 SONY CMOS Image Sensor Sales, Price, Revenue and Gross Margin (2019-2024)
- 12.1.4 SONY CMOS Image Sensor Product Model Numbers, Pictures, Descriptions and Specifications
- 12.1.5 SONY Recent Developments
- 12.2 Samsung
- 12.2.1 Samsung Corporation Information
- 12.2.2 Samsung Overview
- 12.2.3 Samsung CMOS Image Sensor Sales, Price, Revenue and Gross Margin (2019-2024)
- 12.2.4 Samsung CMOS Image Sensor Product Model Numbers, Pictures, Descriptions and Specifications
- 12.2.5 Samsung Recent Developments
- 12.3 OmniVision
- 12.3.1 OmniVision Corporation Information
- 12.3.2 OmniVision Overview
- 12.3.3 OmniVision CMOS Image Sensor Sales, Price, Revenue and Gross Margin (2019-2024)
- 12.3.4 OmniVision CMOS Image Sensor Product Model Numbers, Pictures, Descriptions and Specifications
- 12.3.5 OmniVision Recent Developments
- 12.4 STMicroelectronics
- 12.4.1 STMicroelectronics Corporation Information
- 12.4.2 STMicroelectronics Overview
- 12.4.3 STMicroelectronics CMOS Image Sensor Sales, Price, Revenue and Gross Margin (2019-2024)
- 12.4.4 STMicroelectronics CMOS Image Sensor Product Model Numbers, Pictures, Descriptions and Specifications
- 12.4.5 STMicroelectronics Recent Developments
- 12.5 On Semi
- 12.5.1 On Semi Corporation Information
- 12.5.2 On Semi Overview
- 12.5.3 On Semi CMOS Image Sensor Sales, Price, Revenue and Gross Margin (2019-2024)
- 12.5.4 On Semi CMOS Image Sensor Product Model Numbers, Pictures, Descriptions and Specifications
- 12.5.5 On Semi Recent Developments
- 12.6 SK Hynix
- 12.6.1 SK Hynix Corporation Information
- 12.6.2 SK Hynix Overview
- 12.6.3 SK Hynix CMOS Image Sensor Sales, Price, Revenue and Gross Margin (2019-2024)
- 12.6.4 SK Hynix CMOS Image Sensor Product Model Numbers, Pictures, Descriptions and Specifications
- 12.6.5 SK Hynix Recent Developments
- 12.7 GalaxyCore
- 12.7.1 GalaxyCore Corporation Information
- 12.7.2 GalaxyCore Overview
- 12.7.3 GalaxyCore CMOS Image Sensor Sales, Price, Revenue and Gross Margin (2019-2024)
- 12.7.4 GalaxyCore CMOS Image Sensor Product Model Numbers, Pictures, Descriptions and Specifications
- 12.7.5 GalaxyCore Recent Developments
- 12.8 Panasonic
- 12.8.1 Panasonic Corporation Information
- 12.8.2 Panasonic Overview
- 12.8.3 Panasonic CMOS Image Sensor Sales, Price, Revenue and Gross Margin (2019-2024)
- 12.8.4 Panasonic CMOS Image Sensor Product Model Numbers, Pictures, Descriptions and Specifications
- 12.8.5 Panasonic Recent Developments
- 12.9 Smartsens Technology
- 12.9.1 Smartsens Technology Corporation Information
- 12.9.2 Smartsens Technology Overview
- 12.9.3 Smartsens Technology CMOS Image Sensor Sales, Price, Revenue and Gross Margin (2019-2024)
- 12.9.4 Smartsens Technology CMOS Image Sensor Product Model Numbers, Pictures, Descriptions and Specifications
- 12.9.5 Smartsens Technology Recent Developments
- 12.10 Canon
- 12.10.1 Canon Corporation Information
- 12.10.2 Canon Overview
- 12.10.3 Canon CMOS Image Sensor Sales, Price, Revenue and Gross Margin (2019-2024)
- 12.10.4 Canon CMOS Image Sensor Product Model Numbers, Pictures, Descriptions and Specifications
- 12.10.5 Canon Recent Developments
- 12.11 SOI
- 12.11.1 SOI Corporation Information
- 12.11.2 SOI Overview
- 12.11.3 SOI CMOS Image Sensor Sales, Price, Revenue and Gross Margin (2019-2024)
- 12.11.4 SOI CMOS Image Sensor Product Model Numbers, Pictures, Descriptions and Specifications
- 12.11.5 SOI Recent Developments
13 Industry Chain and Sales Channels Analysis
- 13.1 CMOS Image Sensor Industry Chain Analysis
- 13.2 CMOS Image Sensor Key Raw Materials
- 13.2.1 Key Raw Materials
- 13.2.2 Raw Materials Key Suppliers
- 13.3 CMOS Image Sensor Production Mode & Process
- 13.4 CMOS Image Sensor Sales and Marketing
- 13.4.1 CMOS Image Sensor Sales Channels
- 13.4.2 CMOS Image Sensor Distributors
- 13.5 CMOS Image Sensor Customers
14 CMOS Image Sensor Market Dynamics
- 14.1.1 CMOS Image Sensor Industry Trends
- 14.1.2 CMOS Image Sensor Market Drivers
- 14.1.3 CMOS Image Sensor Market Challenges
- 14.1.4 CMOS Image Sensor Market Restraints
15 Key Findings in the Global CMOS Image Sensor Study
16 Appendix
- 16.1 Research Methodology
- 16.1.1 Methodology/Research Approach
- 16.1.2 Data Source
- 16.2 Author Details
- 16.3 Disclaimer

