|
|
市場調査レポート
商品コード
1325280
3点リンケージの世界市場:2018-2029年Global Three-Point Linkage Market Report, History and Forecast 2018-2029 |
||||||
|
|
|||||||
|
● お客様のご希望に応じて、既存データの加工や未掲載情報(例:国別セグメント)の追加などの対応が可能です。 詳細はお問い合わせください。 |
|||||||


| 3点リンケージの世界市場:2018-2029年 |
|
出版日: 2023年08月09日
発行: QYResearch
ページ情報: 英文 126 Pages
納期: 2~3営業日
|
- 全表示
- 概要
- 図表
- 目次
世界の3点リンケージの市場規模は、2022年の3億8,694万米ドルから、予測期間中は6.14%のCAGRで推移し、2029年には6億1,042万米ドルの規模に成長すると予測されています。
当レポートでは、世界の3点リンケージの市場を調査し、市場および製品の概要、競合情勢、市場規模の推移・予測、各種区分・地域/主要国別の詳細分析、価格動向、市場成長への各種影響因子の分析、主要企業の分析などをまとめています。
目次
第1章 3点リンケージ:市場概要
- 市場概要
- 市場規模の概要:2018 vs 2022 vs 2029
- 世界市場の規模:推移・予測
- 主要地域市場の規模:推移・予測
- 北米
- 欧州
- アジア太平洋
- ラテンアメリカ
- 中東・アフリカ
第2章 3点リンケージ市場:タイプ別
- イントロダクション
- カテゴリー:0-2
- カテゴリー:3-4
- 世界市場の規模:2018 vs 2022 vs 2029
- 世界市場の推移・予測
- 主要地域市場の推移・予測
- 北米
- 欧州
- アジア太平洋
- ラテンアメリカ
- 中東・アフリカ
第3章 3点リンケージ市場:用途別
- イントロダクション
- 農業用
- 林業用
- 世界市場の規模:2018 vs 2022 vs 2029
- 世界市場の推移・予測
- 主要地域市場の推移・予測
- 北米
- 欧州
- アジア太平洋
- ラテンアメリカ
- 中東・アフリカ
第4章 3点リンケージ市場の競合分析:企業別
- 市場規模の推移:企業別
- 主要企業:企業タイプ別
- 競合ステータス
- 世界の主要企業の本社およびサービスエリア
- M&A・拡張計画
第5章 主要企業のプロファイル
- Bobcat
- Deere &Company
- CBM Spa
- Yanmar
- Zuidberg
- GDS Gangl Docking Systems
- Avant Tecno Oy
- IronCraft
- Ventrac
- Grouser Products
第6章 北米
第7章 欧州
第8章 アジア太平洋
第9章 ラテンアメリカ
第10章 中東・アフリカ
第11章 3点リンケージ:市場力学
- 産業動向
- 市場促進要因
- 市場課題
- 市場抑制要因
第12章 調査結果・総論
第13章 調査手法・データソース
List of Tables
- Table 1. Global Market Three-Point Linkage Market Size (US$ Million) Comparison by Region: 2018 VS 2022 VS 2029
- Table 2. Global Three-Point Linkage Market Size by Region (2018-2023) & (US$ Million)
- Table 3. Global Three-Point Linkage Market Size Share by Region (2018-2023)
- Table 4. Global Three-Point Linkage Forecasted Market Size by Region (2024-2029) & (US$ Million)
- Table 5. Global Three-Point Linkage Market Share by Region (2024-2029)
- Table 6. Key Parameter of Category 0-2
- Table 7. Key Players of Category 0-2
- Table 8. Key Parameter of Category 3-4
- Table 9. Key Players of Category 3-4
- Table 10. Global Three-Point Linkage Market Size (US$ Million) by Type: 2018 VS 2022 VS 2029
- Table 11. Global Three-Point Linkage Market Size by Type (2018-2023) & (US$ Million)
- Table 12. Global Three-Point Linkage Revenue Market Share by Type (2018-2023)
- Table 13. Global Three-Point Linkage Forecasted Market Size by Type (2024-2029) & (US$ Million)
- Table 14. Global Three-Point Linkage Revenue Market Share by Type (2024-2029)
- Table 15. North America Three-Point Linkage Revenue by Type (2018-2023) & (US$ Million)
- Table 16. North America Three-Point Linkage Revenue by Type (2024-2029) & (US$ Million)
- Table 17. Europe Three-Point Linkage Revenue by Type (2018-2023) & (US$ Million)
- Table 18. Europe Three-Point Linkage Revenue by Type (2024-2029) & (US$ Million)
- Table 19. Asia-Pacific Three-Point Linkage Revenue by Type (2018-2023) & (US$ Million)
- Table 20. Asia-Pacific Three-Point Linkage Revenue by Type (2024-2029) & (US$ Million)
- Table 21. Latin America Three-Point Linkage Revenue by Type (2018-2023) & (US$ Million)
- Table 22. Latin America Three-Point Linkage Revenue by Type (2024-2029) & (US$ Million)
- Table 23. Middle East and Africa Three-Point Linkage Revenue by Type (2018-2023) & (US$ Million)
- Table 24. Middle East and Africa Three-Point Linkage Revenue by Type (2024-2029) & (US$ Million)
- Table 25. Global Three-Point Linkage Revenue by Application: (US$ Million) 2018 VS 2022 VS 2029
- Table 26. Global Three-Point Linkage Revenue by Application (2018-2023) & (US$ Million)
- Table 27. Global Three-Point Linkage Revenue Market Share by Application (2018-2023)
- Table 28. Global Three-Point Linkage Forecasted Revenue by Application (2024-2029) & (US$ Million)
- Table 29. Global Three-Point Linkage Revenue Market Share by Application (2024-2029)
- Table 30. North America Three-Point Linkage Revenue by Application (2018-2023) & (US$ Million)
- Table 31. North America Three-Point Linkage Revenue by Application (2024-2029) & (US$ Million)
- Table 32. Europe Three-Point Linkage Revenue by Application (2018-2023) & (US$ Million)
- Table 33. Europe Three-Point Linkage Revenue by Application (2024-2029) & (US$ Million)
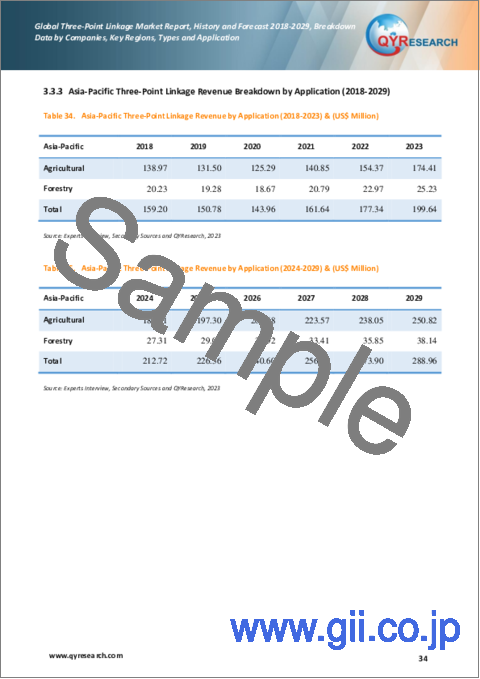
- Table 34. Asia-Pacific Three-Point Linkage Revenue by Application (2018-2023) & (US$ Million)
- Table 35. Asia-Pacific Three-Point Linkage Revenue by Application (2024-2029) & (US$ Million)
- Table 36. Latin America Three-Point Linkage Revenue by Application (2018-2023) & (US$ Million)
- Table 37. Latin America Three-Point Linkage Revenue by Application (2024-2029) & (US$ Million)
- Table 38. Middle East and Africa Three-Point Linkage Revenue by Application (2018-2023) & (US$ Million)
- Table 39. Middle East and Africa Three-Point Linkage Revenue by Application (2024-2029) & (US$ Million)
- Table 40. Global Three-Point Linkage Revenue by Players (2018-2023) & (US$ Million)
- Table 41. Global Three-Point Linkage Revenue Market Share by Players (2018-2023)
- Table 42. Global Top Players Market Share by Company Type (Tier 1, Tier 2, and Tier 3) & (based on the Revenue in Three-Point Linkage as of 2022)
- Table 43. Global Three-Point Linkage Players Market Concentration Ratio (CR5 and HHI)
- Table 44. Global Key Players of Three-Point Linkage, Headquarters and Area Served
- Table 45. Mergers & Acquisitions, Expansion Plans
- Table 46. Bobcat Company Details
- Table 47. Bobcat Three-Point Linkage Product
- Table 48. Bobcat Revenue in Three-Point Linkage Business (2018-2023) & (US$ Million)
- Table 49. Deere & Company Company Details
- Table 50. Deere & Company Three-Point Linkage Product
- Table 51. Deere & Company Revenue in Three-Point Linkage Business (2018-2023) & (US$ Million)
- Table 52. CBM Spa Company Details
- Table 53. CBM Spa Three-Point Linkage Product
- Table 54. CBM Spa Revenue in Three-Point Linkage Business (2018-2023) & (US$ Million)
- Table 55. Yanmar Company Details
- Table 56. Yanmar Three-Point Linkage Product
- Table 57. Yanmar Revenue in Three-Point Linkage Business (2018-2023) & (US$ Million)
- Table 58. Zuidberg Company Details
- Table 59. Zuidberg Three-Point Linkage Product
- Table 60. Zuidberg Revenue in Three-Point Linkage Business (2018-2023) & (US$ Million)
- Table 61. GDS Gangl Docking Systems Company Details
- Table 62. GDS Gangl Docking Systems Three-Point Linkage Product
- Table 63. GDS Gangl Docking Systems Revenue in Three-Point Linkage Business (2018-2023) & (US$ Million)
- Table 64. Avant Tecno Oy Company Details
- Table 65. Avant Tecno Oy Three-Point Linkage Product
- Table 66. Avant Tecno Oy Revenue in Three-Point Linkage Business (2018-2023) & (US$ Million)
- Table 67. IronCraft Company Details
- Table 68. IronCraft Three-Point Linkage Product
- Table 69. IronCraft Revenue in Three-Point Linkage Business (2018-2023) & (US$ Million)
- Table 70. Ventrac Company Details
- Table 71. Ventrac Three-Point Linkage Product
- Table 72. Ventrac Revenue in Three-Point Linkage Business (2018-2023) & (US$ Million)
- Table 73. Grouser Products Company Details
- Table 74. Grouser Products Three-Point Linkage Product
- Table 75. Grouser Products Revenue in Three-Point Linkage Business (2018-2023) & (US$ Million)
- Table 76. North America Three-Point Linkage Market Size Growth Rate (CAGR) by Country (US$ Million): 2018 VS 2022 VS 2029
- Table 77. North America Three-Point Linkage Market Size by Country (2018-2023) & (US$ Million)
- Table 78. North America Three-Point Linkage Market Size by Country (2024-2029) & (US$ Million)
- Table 79. Europe Three-Point Linkage Market Size Growth Rate (CAGR) by Country (US$ Million): 2018 VS 2022 VS 2029
- Table 80. Europe Three-Point Linkage Market Size by Country (2018-2023) & (US$ Million)
- Table 81. Europe Three-Point Linkage Market Size by Country (2024-2029) & (US$ Million)
- Table 82. Asia-Pacific Three-Point Linkage Market Size Growth Rate (CAGR) by Region (US$ Million): 2018 VS 2022 VS 2029
- Table 83. Asia-Pacific Three-Point Linkage Market Size by Region (2018-2023) & (US$ Million)
- Table 84. Asia-Pacific Three-Point Linkage Market Size by Region (2024-2029) & (US$ Million)
- Table 85. Latin America Three-Point Linkage Market Size Growth Rate (CAGR) by Country (US$ Million): 2018 VS 2022 VS 2029
- Table 86. Latin America Three-Point Linkage Market Size by Country (2018-2023) & (US$ Million)
- Table 87. Latin America Three-Point Linkage Market Size by Country (2024-2029) & (US$ Million)
- Table 88. Middle East and Africa Three-Point Linkage Market Size Growth Rate (CAGR) by Country (US$ Million): 2018 VS 2022 VS 2029
- Table 89. Middle East & Africa Three-Point Linkage Market Size by Country (2018-2023) & (US$ Million)
- Table 90. Middle East & Africa Three-Point Linkage Market Size by Country (2024-2029) & (US$ Million)
- Table 91. Three-Point Linkage Market Trends
- Table 92. Three-Point Linkage Market Drivers
- Table 93. Three-Point Linkage Market Challenges
- Table 94. Three-Point Linkage Market Restraints
- Table 95. Research Programs/Design for This Report
- Table 96. Key Data Information from Secondary Sources
- Table 97. Key Data Information from Primary Sources
- Table 98. QYR Business Unit and Senior & Team Lead Analysts
List of Figures
- Figure 1. Three-Point Linkage
- Figure 2. Global Three-Point Linkage Market Size Year-over-Year (2018-2029) & (US$ Million)
- Figure 3. Global Three-Point Linkage Market Size, (US$ Million), 2018 VS 2023 VS 2029
- Figure 4. Global Three-Point Linkage Market Share by Region: 2022 VS 2029
- Figure 5. North America Three-Point Linkage Market Size Growth Rate (2018-2029) & (US$ Million)
- Figure 6. Europe Three-Point Linkage Market Size Growth Rate (2018-2029) & (US$ Million)
- Figure 7. Asia-Pacific Three-Point Linkage Market Size Growth Rate (2018-2029) & (US$ Million)
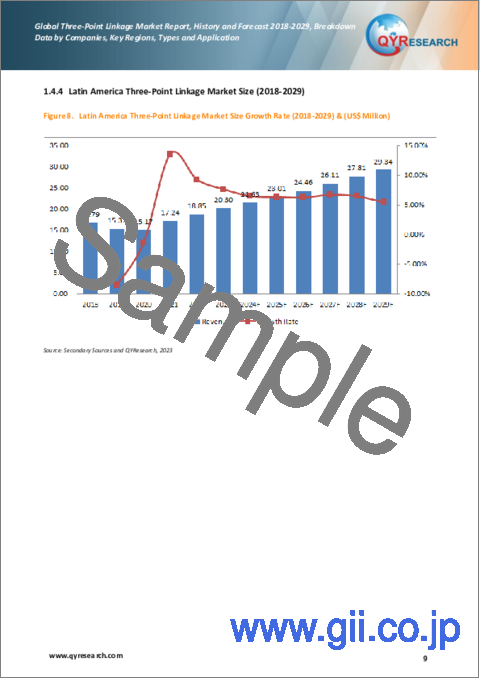
- Figure 8. Latin America Three-Point Linkage Market Size Growth Rate (2018-2029) & (US$ Million)
- Figure 9. Middle East & Africa Three-Point Linkage Market Size Growth Rate (2018-2029) & (US$ Million)
- Figure 10. Global Category 0-2 Market Size YoY Growth (2018-2029) & (US$ Million)
- Figure 11. Global Category 3-4 Market Size YoY Growth (2018-2029) & (US$ Million)
- Figure 12. Global Three-Point Linkage Market Size Share by Type: 2022 & 2029
- Figure 13. North America Three-Point Linkage Revenue Market Share by Type (2018-2029)
- Figure 14. Europe Three-Point Linkage Revenue Market Share by Type (2018-2029)
- Figure 15. Asia-Pacific Three-Point Linkage Revenue Market Share by Type (2018-2029)
- Figure 16. Latin America Three-Point Linkage Revenue Market Share by Type (2018-2029)
- Figure 17. Middle East and Africa Three-Point Linkage Revenue Market Share by Type (2018-2029)
- Figure 18. Agricultural Case Studies
- Figure 19. Agricultural Market Size (US$ Million) & YoY Growth (2018-2029)
- Figure 20. Forestry Case Studies
- Figure 21. Forestry Market Size (US$ Million) & YoY Growth (2018-2029)
- Figure 22. Global Three-Point Linkage Revenue Share by Application: 2022 & 2029
- Figure 23. North America Three-Point Linkage Revenue Market Share by Application (2018-2029)
- Figure 24. Europe Three-Point Linkage Revenue Market Share by Application (2018-2029)
- Figure 25. Asia-Pacific Three-Point Linkage Revenue Market Share by Application (2018-2029)
- Figure 26. Latin America Three-Point Linkage Revenue Market Share by Application (2018-2029)
- Figure 27. Middle East and Africa Three-Point Linkage Revenue Market Share by Application (2018-2029)
- Figure 28. The Top 5 Players Market Share by Three-Point Linkage Sales in 2022
- Figure 29. North America Three-Point Linkage Market Share by Country (2018-2029)
- Figure 30. United States Three-Point Linkage Market Size (2018-2029) & (US$ Million)
- Figure 31. Canada Three-Point Linkage Market Size (2018-2029) & (US$ Million)
- Figure 32. Europe Three-Point Linkage Market Share by Country (2018-2029)
- Figure 33. Germany Three-Point Linkage Market Size (2018-2029) & (US$ Million)
- Figure 34. France Three-Point Linkage Market Size (2018-2029) & (US$ Million)
- Figure 35. U.K. Three-Point Linkage Market Size (2018-2029) & (US$ Million)
- Figure 36. Italy Three-Point Linkage Market Size (2018-2029) & (US$ Million)
- Figure 37. Russia Three-Point Linkage Market Size (2018-2029) & (US$ Million)
- Figure 38. Asia-Pacific Three-Point Linkage Market Share by Region (2018-2029)
- Figure 39. China Three-Point Linkage Market Size (2018-2029) & (US$ Million)
- Figure 40. Japan Three-Point Linkage Market Size (2018-2029) & (US$ Million)
- Figure 41. Southeast Asia Three-Point Linkage Market Size (2018-2029) & (US$ Million)
- Figure 42. India Three-Point Linkage Market Size (2018-2029) & (US$ Million)
- Figure 43. Latin America Three-Point Linkage Market Share by Country (2018-2029)
- Figure 44. Mexico Three-Point Linkage Market Size (2018-2029) & (US$ Million)
- Figure 45. Brazil Three-Point Linkage Market Size (2018-2029) & (US$ Million)
- Figure 46. Middle East & Africa Three-Point Linkage Market Share by Country (2018-2029)
- Figure 47. Middle East Three-Point Linkage Market Size (2018-2029) & (US$ Million)
- Figure 48. Africa Three-Point Linkage Market Size (2018-2029) & (US$ Million)
- Figure 49. Bottom-up and Top-down Approaches for This Report
- Figure 50. Data Triangulation
The global market for Three-Point Linkage estimated was at US$ 386.94 million in the year 2022, is projected to reach a revised size of US$ 610.42 million by 2029, growing at a CAGR of 6.14% during the forecast period 2023-2029.
Report Scope
This report aims to provide a comprehensive presentation of the global market for Three-Point Linkage, with both quantitative and qualitative analysis, to help readers develop business/growth strategies, assess the market competitive situation, analyze their position in the current marketplace, and make informed business decisions regarding Three-Point Linkage.
The Three-Point Linkage market size, estimations, and forecasts are provided in terms of revenue ($ millions), considering 2021 as the base year, with history and forecast data for the period from 2018 to 2029. This report segments the global Three-Point Linkage market comprehensively. Regional market sizes, concerning products by Type, by Application, and by players, are also provided. The influence of COVID-19 and the Russia-Ukraine War were considered while estimating market sizes.
For a more in-depth understanding of the market, the report provides profiles of the competitive landscape, key competitors, and their respective market ranks. The report also discusses technological trends and new product developments.
This report will help the readers to understand the competition within the industries and strategies for the competitive environment to enhance the potential profit. The report also focuses on the competitive landscape of the global Three-Point Linkage market, and introduces in detail the market share, industry ranking, competitor ecosystem, market performance, new product development, operation situation, expansion, and acquisition. etc. of the main players, which helps the readers to identify the main competitors and deeply understand the competition pattern of the market.
Market Segmentation
This report covers the Three-Point Linkage segments by company, by Type, by Application, by region and country, and provides market size and CAGR for the history and forecast period (2018-2023, 2024-2029), considering 2022 as the base year. It elucidates potential revenue opportunities across different segments and explains attractive investment proposition matrices for this market.
By Company
- Bobcat Company
- Deere & Company
- CBM Spa
- Yanmar
- Zuidberg
- GDS Gangl Docking Systems
- Avant Tecno Oy
- IronCraft
- Ventrac
- Grouser Products
Segment by Type
- Category 0-2
- Category 3-4
Segment by Application
- Agricultural
- Forestry
By Region
- North America
- United States
- Canada
- Asia-Pacific
- China
- Japan
- Southeast Asia
- India
- Others
- Europe
- Germany
- France
- U.K.
- Italy
- Russia
- Others
- Latin America
- Mexico
- Brazil
- Others
- Middle East & Africa
- Middle East
- Africa
Core Chapters
- Chapter One: Introduces the report scope of the report, executive summary of global and regional market size and CAGR for the history and forecast period (2018-2023, 2024-2029). It offers a high-level view of the current state of the market and its likely evolution in the short to mid-term, and long term.
- Chapter Two: Provides the analysis of various market segments by Type, covering the market size and development potential of each market segment, to help readers find the blue ocean market in different market segments.
- Chapter Three: Provides the analysis of various market segments by Application, covering the market size and development potential of each market segment, to help readers find the blue ocean market in different downstream markets.
- Chapter Four: Detailed analysis of Three-Point Linkage companies' competitive landscape, revenue, market share and ranking, latest development plan, merger, and acquisition information, etc.
- Chapter Five: Provides profiles of key players, introducing the basic situation of the main companies in the market in detail, including product introduction, revenue, recent development, etc.
- Chapter Six, Seven, Eight, Nine and Ten: North America, Europe, Asia Pacific, Latin America, Middle East & Africa, revenue by country.
- Chapter Eleven: this section also introduces the market dynamics, latest developments of the market, the driving factors and restrictive factors of the market, the challenges and risks faced by companies in the industry, and the analysis of relevant policies in the industry.
- Chapter Twelve: Research Finding/Conclusion
Table of Contents
1 Market Overview of Three-Point Linkage
- 1.1 Three-Point Linkage Market Overview
- 1.1.1 Three-Point Linkage Product Scope
- 1.1.2 Three-Point Linkage Market Status and Outlook
- 1.2 Global Three-Point Linkage Market Size Overview by Region 2018 VS 2022 VS 2029
- 1.3 Global Three-Point Linkage Market Size by Region (2018-2029)
- 1.3.1 Global Three-Point Linkage Historic Market Size by Region (2018-2023)
- 1.3.2 Global Three-Point Linkage Market Size Forecast by Region (2024-2029)
- 1.4 Key Regions Three-Point Linkage Market Size (2018-2029)
- 1.4.1 North America Three-Point Linkage Market Size (2018-2029)
- 1.4.2 Europe Three-Point Linkage Market Size (2018-2029)
- 1.4.3 Asia-Pacific Three-Point Linkage Market Size (2018-2029)
- 1.4.4 Latin America Three-Point Linkage Market Size (2018-2029)
- 1.4.5 Middle East & Africa Three-Point Linkage Market Size (2018-2029)
2 Three-Point Linkage Market by Type
- 2.1 Introduction
- 2.1.1 Category 0-2
- 2.1.2 Category 3-4
- 2.2 Global Three-Point Linkage Market Size by Type: 2018 VS 2022 VS 2029
- 2.2.1 Global Three-Point Linkage Historic Market Size by Type (2018-2023)
- 2.2.2 Global Three-Point Linkage Forecasted Market Size by Type (2024-2029)
- 2.3 Key Regions Market Size by Type
- 2.3.1 North America Three-Point Linkage Revenue Breakdown by Type (2018-2029)
- 2.3.2 Europe Three-Point Linkage Revenue Breakdown by Type (2018-2029)
- 2.3.3 Asia-Pacific Three-Point Linkage Revenue Breakdown by Type (2018-2029)
- 2.3.4 Latin America Three-Point Linkage Revenue Breakdown by Type (2018-2029)
- 2.3.5 Middle East and Africa Three-Point Linkage Revenue Breakdown by Type (2018-2029)
3 Three-Point Linkage Market Overview by Application
- 3.1 Introduction
- 3.1.1 Agricultural
- 3.1.2 Forestry
- 3.2 Global Three-Point Linkage Market Size by Application: 2018 VS 2022 VS 2029
- 3.2.1 Global Three-Point Linkage Historic Revenue by Application (2018-2023)
- 3.2.2 Global Three-Point Linkage Forecasted Revenue by Application (2024-2029)
- 3.3 Key Regions Market Size by Application
- 3.3.1 North America Three-Point Linkage Revenue Breakdown by Application (2018-2029)
- 3.3.2 Europe Three-Point Linkage Revenue Breakdown by Application (2018-2029)
- 3.3.3 Asia-Pacific Three-Point Linkage Revenue Breakdown by Application (2018-2029)
- 3.3.4 Latin America Three-Point Linkage Revenue Breakdown by Application (2018-2029)
- 3.3.5 Middle East and Africa Three-Point Linkage Revenue Breakdown by Application (2018-2029)
4 Three-Point Linkage Competition Analysis by Players
- 4.1 Global Three-Point Linkage Market Size by Players (2018-2023)
- 4.2 Global Top Players by Company Type (Tier 1, Tier 2, and Tier 3) & (based on the Revenue in Three-Point Linkage as of 2022)
- 4.3 Competitive Status
- 4.3.1 Three-Point Linkage Market Concentration Rate
- 4.3.2 Three-Point Linkage Top 5 Players Market Share in 2022
- 4.4 Global Key Players of Three-Point Linkage Head office and Area Served
- 4.5 Mergers & Acquisitions, Expansion Plans
5 Company (Top Players) Profiles
- 5.1 Bobcat
- 5.1.1 Bobcat Company Details
- 5.1.2 Bobcat Business Overview
- 5.1.3 Bobcat Three-Point Linkage Introduction
- 5.1.4 Bobcat Revenue in Three-Point Linkage Business (2018-2023)
- 5.2 Deere & Company
- 5.2.1 Deere & Company Company Details
- 5.2.2 Deere & Company Business Overview
- 5.2.3 Deere & Company Three-Point Linkage Introduction
- 5.2.4 Deere & Company Revenue in Three-Point Linkage Business (2018-2023)
- 5.3 CBM Spa
- 5.3.1 CBM Spa Company Details
- 5.3.2 CBM Spa Business Overview
- 5.3.3 CBM Spa Three-Point Linkage Introduction
- 5.3.4 CBM Spa Revenue in Three-Point Linkage Business (2018-2023)
- 5.4 Yanmar
- 5.4.1 Yanmar Company Details
- 5.4.2 Yanmar Business Overview
- 5.4.3 Yanmar Three-Point Linkage Introduction
- 5.4.4 Yanmar Revenue in Three-Point Linkage Business (2018-2023)
- 5.5 Zuidberg
- 5.5.1 Zuidberg Company Details
- 5.5.2 Zuidberg Business Overview
- 5.5.3 Zuidberg Three-Point Linkage Introduction
- 5.5.4 Zuidberg Revenue in Three-Point Linkage Business (2018-2023)
- 5.6 GDS Gangl Docking Systems
- 5.6.1 GDS Gangl Docking Systems Company Details
- 5.6.2 GDS Gangl Docking Systems Business Overview
- 5.6.3 GDS Gangl Docking Systems Three-Point Linkage Introduction
- 5.6.4 GDS Gangl Docking Systems Revenue in Three-Point Linkage Business (2018-2023)
- 5.7 Avant Tecno Oy
- 5.7.1 Avant Tecno Oy Company Details
- 5.7.2 Avant Tecno Oy Business Overview
- 5.7.3 Avant Tecno Oy Three-Point Linkage Introduction
- 5.7.4 Avant Tecno Oy Revenue in Three-Point Linkage Business (2018-2023)
- 5.8 IronCraft
- 5.8.1 IronCraft Company Details
- 5.8.2 IronCraft Business Overview
- 5.8.3 IronCraft Three-Point Linkage Introduction
- 5.8.4 IronCraft Revenue in Three-Point Linkage Business (2018-2023)
- 5.9 Ventrac
- 5.9.1 Ventrac Company Details
- 5.9.2 Ventrac Business Overview
- 5.9.3 Ventrac Three-Point Linkage Introduction
- 5.9.4 Ventrac Revenue in Three-Point Linkage Business (2018-2023)
- 5.10 Grouser Products
- 5.10.1 Grouser Products Company Details
- 5.10.2 Grouser Products Business Overview
- 5.10.3 Grouser Products Three-Point Linkage Introduction
- 5.10.4 Grouser Products Revenue in Three-Point Linkage Business (2018-2023)
6 North America
- 6.1 North America Three-Point Linkage Market Size by Country (2018-2029)
- 6.2 United States
- 6.3 Canada
7 Europe
- 7.1 Europe Three-Point Linkage Market Size by Country (2018-2029)
- 7.2 Germany
- 7.3 France
- 7.4 U.K.
- 7.5 Italy
- 7.6 Russia
8 Asia-Pacific
- 8.1 Asia-Pacific Three-Point Linkage Market Size by Region (2018-2029)
- 8.2 China
- 8.3 Japan
- 8.4 Southeast Asia
- 8.5 India
9 Latin America
- 9.1 Latin America Three-Point Linkage Market Size by Country (2018-2029)
- 9.2 Mexico
- 9.3 Brazil
10 Middle East & Africa
- 10.1 Middle East & Africa Three-Point Linkage Market Size by Country
- 10.2 Middle East
- 10.3 Africa
11 Three-Point Linkage Market Dynamics
- 11.1 Three-Point Linkage Industry Trends
- 11.2 Three-Point Linkage Market Drivers
- 11.3 Three-Point Linkage Market Challenges
- 11.4 Three-Point Linkage Market Restraints
12 Research Finding/Conclusion
13 Methodology and Data Source
- 13.1 Methodology/Research Approach
- 13.1.1 Research Programs/Design
- 13.1.2 Market Size Estimation
- 13.1.3 Market Breakdown and Data Triangulation
- 13.2 Data Source
- 13.2.1 Secondary Sources
- 13.2.2 Primary Sources
- 13.3 Author List
- 13.4 Disclaimer