|
|
市場調査レポート
商品コード
1304143
三点支持装置の世界市場(2023年)Global Three-Point Linkage Market Research Report 2023 |
||||||
|
|
|||||||
|
● お客様のご希望に応じて、既存データの加工や未掲載情報(例:国別セグメント)の追加などの対応が可能です。 詳細はお問い合わせください。 |
|||||||


| 三点支持装置の世界市場(2023年) |
|
出版日: 2023年07月11日
発行: QYResearch
ページ情報: 英文 94 Pages
納期: 2~3営業日
|
- 全表示
- 概要
- 図表
- 目次
世界の三点支持装置の市場規模は、2022年の3億8,694万米ドルから2029年までに6億1,042万米ドルに達し、予測期間の2023年~2029年にCAGRで6.14%の成長が予測されています。
当レポートでは、世界の三点支持装置市場について調査分析し、市場規模と予測、地域とセグメントの分析、企業プロファイルなどを提供しています。
目次
第1章 レポートの概要
- 調査の範囲
- 市場の分析:タイプ別
- 世界の三点支持装置の市場規模成長率:タイプ別(2018年・2022年・2029年)
- カテゴリ0~2
- カテゴリ3~4
- 市場:用途別
- 世界の三点支持装置市場の成長:用途別(2018年・2022年・2029年)
- 農業
- 林業
- 前提条件と制限
- 調査目的
- 考慮された年数
第2章 世界の成長動向
- 世界の三点支持装置市場の見通し(2018年~2029年)
- 世界の三点支持装置の成長動向:地域別
- 世界の三点支持装置の市場規模:地域別(2018年・2022年・2029年)
- 三点支持装置の市場規模の実績:地域別(2018年~2023年)
- 三点支持装置の市場規模の予測:地域別(2024年~2029年)
- 三点支持装置の市場力学
- 三点支持装置業界の動向
- 三点支持装置市場の促進要因
- 三点支持装置市場の課題
- 三点支持装置市場の抑制要因
第3章 競合情勢:主要企業別
- 世界の主要三点支持装置企業:収益別
- 世界の主要三点支持装置企業:収益別(2018年~2023年)
- 世界の三点支持装置の収益の市場シェア:企業別(2018年~2023年)
- 世界の三点支持装置の市場シェア:企業タイプ別(Tier 1、Tier 2、Tier 3)
- 世界の主要企業の三点支持装置収益ランキング
- 世界の三点支持装置市場の集中率
- 世界の三点支持装置市場の集中率(CR5・HHI)
- 世界の三点支持装置売上の上位5社(2022年)
- 世界の三点支持装置の主要企業の本社、サービス地域
- 合併と買収、拡張計画
第4章 三点支持装置の内訳データ:タイプ別
- 世界の三点支持装置の市場規模の実績:タイプ別(2018年~2023年)
- 世界の三点支持装置の市場規模の予測:タイプ別(2024年~2029年)
第5章 三点支持装置の内訳データ:用途別
- 世界の三点支持装置の市場規模の実績:用途別(2018年~2023年)
- 世界の三点支持装置の市場規模の予測:用途別(2024年~2029年)
第6章 北米
- 北米の三点支持装置の市場規模(2018年~2029年)
- 北米の三点支持装置市場の成長率:国別(2018年・2022年・2029年)
- 北米の三点支持装置の市場規模:国別(2018年~2023年)
- 北米の三点支持装置の市場規模:国別(2024年~2029年)
- 米国
- カナダ
第7章 欧州
- 欧州の三点支持装置の市場規模(2018年~2029年)
- 欧州の三点支持装置市場の成長率:国別(2018年・2022年・2029年)
- 欧州の三点支持装置の市場規模:国別(2018年~2023年)
- 欧州の三点支持装置の市場規模:国別(2024年~2029年)
- ドイツ
- フランス
- 英国
- イタリア
- ロシア
第8章 アジア太平洋
- アジア太平洋の三点支持装置の市場規模(2018年~2029年)
- アジア太平洋の三点支持装置市場の成長率:国別(2018年・2022年・2029年)
- アジア太平洋の三点支持装置の市場規模:地域別(2018年~2023年)
- アジア太平洋の三点支持装置の市場規模:地域別(2024年~2029年)
- 中国
- 日本
- 東南アジア
- インド
第9章 ラテンアメリカ
- ラテンアメリカの三点支持装置の市場規模(2018年~2029年)
- ラテンアメリカの三点支持装置市場の成長率:国別(2018年・2022年・2029年)
- ラテンアメリカの三点支持装置の市場規模:国別(2018年~2023年)
- ラテンアメリカの三点支持装置の市場規模:国別(2024年~2029年)
- メキシコ
- ブラジル
第10章 中東・アフリカ
- 中東・アフリカの三点支持装置の市場規模(2018年~2029年)
- 中東・アフリカの三点支持装置市場の成長率:国別(2018年・2022年・2029年)
- 中東・アフリカの三点支持装置の市場規模:国別(2018年~2023年)
- 中東・アフリカの三点支持装置の市場規模:国別(2024年~2029年)
- 中東
- アフリカ
第11章 主要企業のプロファイル
- Bobcat
- Deere & Company
- CBM Spa
- Yanmar
- Zuidberg
- GDS Gangl Docking Systems
- Avant Tecno Oy
- IronCraft
- Ventrac
- Grouser Products
第12章 アナリストの視点/結論
第13章 付録
List of Tables
- Table 1. Global Three-Point Linkage Market Size Growth Rate by Type (US$ Million): 2018 VS 2022 VS 2029
- Table 2. Key Parameter of Category 0-2
- Table 3. Key Players of Category 0-2
- Table 4. Key Parameter of Category 3-4
- Table 5. Key Players of Category 3-4
- Table 6. Global Three-Point Linkage Market Size Growth by Application (US$ Million): 2018 VS 2022 VS 2029
- Table 7. Global Three-Point Linkage Market Size by Region (US$ Million): 2018 VS 2022 VS 2029
- Table 8. Global Three-Point Linkage Market Size by Region (2018-2023) & (US$ Million)
- Table 9. Global Three-Point Linkage Market Share by Region (2018-2023)
- Table 10. Global Three-Point Linkage Forecasted Market Size by Region (2024-2029) & (US$ Million)
- Table 11. Global Three-Point Linkage Market Share by Region (2024-2029)
- Table 12. Three-Point Linkage Market Trends
- Table 13. Three-Point Linkage Market Drivers
- Table 14. Three-Point Linkage Market Challenges
- Table 15. Three-Point Linkage Market Restraints
- Table 16. Global Three-Point Linkage Revenue by Players (2018-2023) & (US$ Million)
- Table 17. Global Three-Point Linkage Market Share by Players (2018-2023)
- Table 18. Global Top Three-Point Linkage Players by Company Type (Tier 1, Tier 2, and Tier 3) & (based on the Revenue in Three-Point Linkage as of 2022)
- Table 19. Ranking of Global Top Three-Point Linkage Companies by Revenue (US$ Million) in 2022
- Table 20. Global 5 Largest Players Market Share by Three-Point Linkage Revenue (CR5 and HHI) & (2018-2023)
- Table 21. Global Key Players of Three-Point Linkage, Headquarters and Area Served
- Table 22. Mergers & Acquisitions, Expansion Plans
- Table 23. Global Three-Point Linkage Market Size by Type (2018-2023) & (US$ Million)
- Table 24. Global Three-Point Linkage Revenue Market Share by Type (2018-2023)
- Table 25. Global Three-Point Linkage Forecasted Market Size by Type (2024-2029) & (US$ Million)
- Table 26. Global Three-Point Linkage Revenue Market Share by Type (2024-2029)
- Table 27. Global Three-Point Linkage Market Size by Application (2018-2023) & (US$ Million)
- Table 28. Global Three-Point Linkage Revenue Market Share by Application (2018-2023)
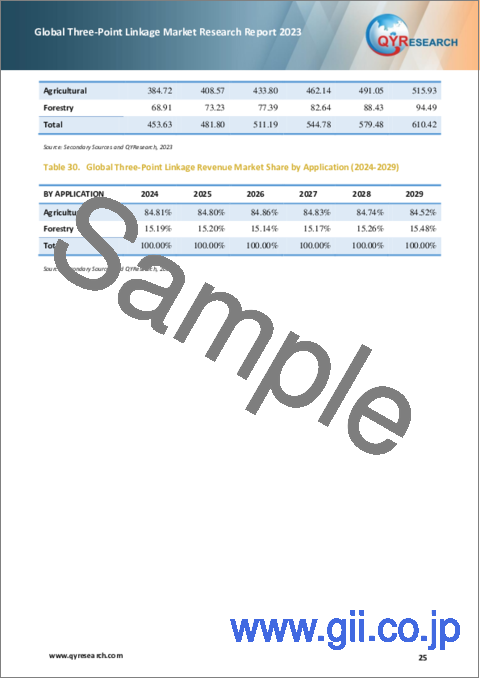
- Table 29. Global Three-Point Linkage Forecasted Market Size by Application (2024-2029) & (US$ Million)
- Table 30. Global Three-Point Linkage Revenue Market Share by Application (2024-2029)
- Table 31. North America Three-Point Linkage Market Size Growth Rate by Country (US$ Million): 2018 VS 2022 VS 2029
- Table 32. North America Three-Point Linkage Market Size by Country (2018-2023) & (US$ Million)
- Table 33. North America Three-Point Linkage Market Size by Country (2024-2029) & (US$ Million)
- Table 34. Europe Three-Point Linkage Market Size Growth Rate by Country (US$ Million): 2018 VS 2022 VS 2029
- Table 35. Europe Three-Point Linkage Market Size by Country (2018-2023) & (US$ Million)
- Table 36. Europe Three-Point Linkage Market Size by Country (2024-2029) & (US$ Million)
- Table 37. Asia-Pacific Three-Point Linkage Market Size Growth Rate by Country (US$ Million): 2018 VS 2022 VS 2029
- Table 38. Asia-Pacific Three-Point Linkage Market Size by Region (2018-2023) & (US$ Million)
- Table 39. Asia-Pacific Three-Point Linkage Market Size by Region (2024-2029) & (US$ Million)
- Table 40. Latin America Three-Point Linkage Market Size Growth Rate by Country (US$ Million): 2018 VS 2022 VS 2029
- Table 41. Latin America Three-Point Linkage Market Size by Country (2018-2023) & (US$ Million)
- Table 42. Latin America Three-Point Linkage Market Size by Country (2024-2029) & (US$ Million)
- Table 43. Middle East & Africa Three-Point Linkage Market Size Growth Rate by Country (US$ Million): 2018 VS 2022 VS 2029
- Table 44. Middle East & Africa Three-Point Linkage Market Size by Country (2018-2023) & (US$ Million)
- Table 45. Middle East & Africa Three-Point Linkage Market Size by Country (2024-2029) & (US$ Million)
- Table 46. Bobcat Company Details
- Table 47. Bobcat Three-Point Linkage Product
- Table 48. Bobcat Revenue in Three-Point Linkage Business (2018-2023) & (US$ Million)
- Table 49. Deere & Company Company Details
- Table 50. Deere & Company Three-Point Linkage Product
- Table 51. Deere & Company Revenue in Three-Point Linkage Business (2018-2023) & (US$ Million)
- Table 52. CBM Spa Company Details
- Table 53. CBM Spa Three-Point Linkage Product
- Table 54. CBM Spa Revenue in Three-Point Linkage Business (2018-2023) & (US$ Million)
- Table 55. Yanmar Company Details
- Table 56. Yanmar Three-Point Linkage Product
- Table 57. Yanmar Revenue in Three-Point Linkage Business (2018-2023) & (US$ Million)
- Table 58. Zuidberg Company Details
- Table 59. Zuidberg Three-Point Linkage Product
- Table 60. Zuidberg Revenue in Three-Point Linkage Business (2018-2023) & (US$ Million)
- Table 61. GDS Gangl Docking Systems Company Details
- Table 62. GDS Gangl Docking Systems Three-Point Linkage Product
- Table 63. GDS Gangl Docking Systems Revenue in Three-Point Linkage Business (2018-2023) & (US$ Million)
- Table 64. Avant Tecno Oy Company Details
- Table 65. Avant Tecno Oy Three-Point Linkage Product
- Table 66. Avant Tecno Oy Revenue in Three-Point Linkage Business (2018-2023) & (US$ Million)
- Table 67. IronCraft Company Details
- Table 68. IronCraft Three-Point Linkage Product
- Table 69. IronCraft Revenue in Three-Point Linkage Business (2018-2023) & (US$ Million)
- Table 70. Ventrac Company Details
- Table 71. Ventrac Three-Point Linkage Product
- Table 72. Ventrac Revenue in Three-Point Linkage Business (2018-2023) & (US$ Million)
- Table 73. Grouser Products Company Details
- Table 74. Grouser Products Three-Point Linkage Product
- Table 75. Grouser Products Revenue in Three-Point Linkage Business (2018-2023) & (US$ Million)
- Table 76. Research Programs/Design for This Report
- Table 77. Key Data Information from Secondary Sources
- Table 78. Key Data Information from Primary Sources
- Table 79. Authors List of This Report
- Table 80. QYR Business Unit and Senior & Team Lead Analysts
List of Figures
- Figure 1. Three-Point Linkage
- Figure 2. Global Three-Point Linkage Market Share by Type: 2022 VS 2029
- Figure 3. Global Three-Point Linkage Market Share by Application: 2022 VS 2029
- Figure 4. Agricultural Case Studies
- Figure 5. Forestry Case Studies
- Figure 6. Three-Point Linkage Report Years Considered
- Figure 7. Global Three-Point Linkage Market Size (US$ Million), Year-over-Year: 2018-2029
- Figure 8. Global Three-Point Linkage Market Size, (US$ Million), 2018 VS 2022 VS 2029
- Figure 9. Global Three-Point Linkage Market Share by Region: 2022 VS 2029
- Figure 10. The Top 5 Players Market Share by Three-Point Linkage Revenue in 2022
- Figure 11. North America Three-Point Linkage Market Size YoY Growth (2018-2029) & (US$ Million)
- Figure 12. North America Three-Point Linkage Market Share by Country (2018-2029)
- Figure 13. United States Three-Point Linkage Market Size YoY Growth (2018-2029) & (US$ Million)
- Figure 14. Canada Three-Point Linkage Market Size YoY Growth (2018-2029) & (US$ Million)
- Figure 15. Europe Three-Point Linkage Market Size YoY Growth (2018-2029) & (US$ Million)
- Figure 16. Europe Three-Point Linkage Market Share by Country (2018-2029)
- Figure 17. Germany Three-Point Linkage Market Size YoY Growth (2018-2029) & (US$ Million)
- Figure 18. France Three-Point Linkage Market Size YoY Growth (2018-2029) & (US$ Million)
- Figure 19. U.K. Three-Point Linkage Market Size YoY Growth (2018-2029) & (US$ Million)
- Figure 20. Italy Three-Point Linkage Market Size YoY Growth (2018-2029) & (US$ Million)
- Figure 21. Russia Three-Point Linkage Market Size YoY Growth (2018-2029) & (US$ Million)
- Figure 22. Asia-Pacific Three-Point Linkage Market Size YoY Growth (2018-2029) & (US$ Million)
- Figure 23. Asia-Pacific Three-Point Linkage Market Share by Region (2018-2029)
- Figure 24. China Three-Point Linkage Market Size YoY Growth (2018-2029) & (US$ Million)
- Figure 25. Japan Three-Point Linkage Market Size YoY Growth (2018-2029) & (US$ Million)
- Figure 26. Southeast Asia Three-Point Linkage Market Size YoY Growth (2018-2029) & (US$ Million)
- Figure 27. India Three-Point Linkage Market Size YoY Growth (2018-2029) & (US$ Million)
- Figure 28. Latin America Three-Point Linkage Market Size YoY Growth (2018-2029) & (US$ Million)
- Figure 29. Latin America Three-Point Linkage Market Share by Country (2018-2029)
- Figure 30. Mexico Three-Point Linkage Market Size YoY Growth (2018-2029) & (US$ Million)
- Figure 31. Brazil Three-Point Linkage Market Size YoY Growth (2018-2029) & (US$ Million)
- Figure 32. Middle East & Africa Three-Point Linkage Market Size YoY Growth (2018-2029) & (US$ Million)
- Figure 33. Middle East & Africa Three-Point Linkage Market Share by Country (2018-2029)
- Figure 34. Middle East Three-Point Linkage Market Size YoY Growth (2018-2029) & (US$ Million)
- Figure 35. Africa Three-Point Linkage Market Size YoY Growth (2018-2029) & (US$ Million)
- Figure 36. Bottom-up and Top-down Approaches for This Report
- Figure 37. Data Triangulation
- Figure 38. Key Executives Interviewed
The global Three-Point Linkage market was valued at US$ 386.94 million in 2022 and is anticipated to reach US$ 610.42 million by 2029, witnessing a CAGR of 6.14% during the forecast period 2023-2029.
Report Scope
This report aims to provide a comprehensive presentation of the global market for Three-Point Linkage, with both quantitative and qualitative analysis, to help readers develop business/growth strategies, assess the market competitive situation, analyze their position in the current marketplace, and make informed business decisions regarding Three-Point Linkage.
The Three-Point Linkage market size, estimations, and forecasts are provided in terms of and revenue ($ millions), considering 2022 as the base year, with history and forecast data for the period from 2018 to 2029. This report segments the global Three-Point Linkage market comprehensively. Regional market sizes, concerning products by Type, by Application, and by players, are also provided.
For a more in-depth understanding of the market, the report provides profiles of the competitive landscape, key competitors, and their respective market ranks. The report also discusses technological trends and new product developments.
The report will help the Three-Point Linkage companies, new entrants, and industry chain related companies in this market with information on the revenues for the overall market and the sub-segments across the different segments, by company, by Type, by Application, and by regions.
By Company
- Bobcat Company
- Deere & Company
- CBM Spa
- Yanmar
- Zuidberg
- GDS Gangl Docking Systems
- Avant Tecno Oy
- IronCraft
- Ventrac
- Grouser Products
Segment by Type
- Category 0-2
- Category 3-4
Segment by Application
- Agricultural
- Forestry
By Region
- North America
- United States
- Canada
- Asia-Pacific
- China
- Japan
- Southeast Asia
- India
- Rest of Asia
- Europe
- Germany
- France
- U.K.
- Italy
- Russia
- Rest of Europe
- Latin America
- Mexico
- Brazil
- Rest of Latin America
- Middle East & Africa
- Middle East
- Africa
Core Chapters
- Chapter 1: Introduces the report scope of the report, executive summary of different market segments (by Type, by Application, etc), including the market size of each market segment, future development potential, and so on. It offers a high-level view of the current state of the market and its likely evolution in the short to mid-term, and long term.
- Chapter 2: Introduces executive summary of global market size, regional market size, this section also introduces the market dynamics, latest developments of the market, the driving factors and restrictive factors of the market, the challenges and risks faced by companies in the industry, and the analysis of relevant policies in the industry.
- Chapter 3: Detailed analysis of Three-Point Linkage companies's competitive landscape, revenue market share, latest development plan, merger, and acquisition information, etc.
- Chapter 4: Provides the analysis of various market segments by Type, covering the market size and development potential of each market segment, to help readers find the blue ocean market in different market segments.
- Chapter 5: Provides the analysis of various market segments by Application, covering the market size and development potential of each market segment, to help readers find the blue ocean market in different downstream markets.
- Chapter 6, 7, 8, 9, 10: North America, Europe, Asia Pacific, Latin America, Middle East and Africa segment by country. It provides a quantitative analysis of the market size and development potential of each region and its main countries and introduces the market development, future development prospects, market space, and capacity of each country in the world.
- Chapter 11: Provides profiles of key players, introducing the basic situation of the main companies in the market in detail, including product sales, revenue, price, gross margin, product introduction, etc.
- Chapter 12: The main points and conclusions of the report.
Table of Contents
1 Report Overview
- 1.1 Study Scope
- 1.2 Market Analysis by Type
- 1.2.1 Global Three-Point Linkage Market Size Growth Rate by Type: 2018 VS 2022 VS 2029
- 1.2.2 Category 0-2
- 1.2.3 Category 3-4
- 1.3 Market by Application
- 1.3.1 Global Three-Point Linkage Market Growth by Application: 2018 VS 2022 VS 2029
- 1.3.2 Agricultural
- 1.3.3 Forestry
- 1.4 Assumptions and Limitations
- 1.5 Study Objectives
- 1.6 Years Considered
2 Global Growth Trends
- 2.1 Global Three-Point Linkage Market Perspective (2018-2029)
- 2.2 Global Three-Point Linkage Growth Trends by Region
- 2.2.1 Global Three-Point Linkage Market Size by Region: 2018 VS 2022 VS 2029
- 2.2.2 Three-Point Linkage Historic Market Size by Region (2018-2023)
- 2.2.3 Three-Point Linkage Forecasted Market Size by Region (2024-2029)
- 2.3 Three-Point Linkage Market Dynamics
- 2.3.1 Three-Point Linkage Industry Trends
- 2.3.2 Three-Point Linkage Market Drivers
- 2.3.3 Three-Point Linkage Market Challenges
- 2.3.4 Three-Point Linkage Market Restraints
3 Competition Landscape by Key Players
- 3.1 Global Top Three-Point Linkage Players by Revenue
- 3.1.1 Global Top Three-Point Linkage Players by Revenue (2018-2023)
- 3.1.2 Global Three-Point Linkage Revenue Market Share by Players (2018-2023)
- 3.2 Global Three-Point Linkage Market Share by Company Type (Tier 1, Tier 2, and Tier 3)
- 3.3 Global Key Players Ranking by Three-Point Linkage Revenue
- 3.4 Global Three-Point Linkage Market Concentration Ratio
- 3.4.1 Global Three-Point Linkage Market Concentration Ratio (CR5 and HHI)
- 3.4.2 Global Top 5 Companies by Three-Point Linkage Revenue in 2022
- 3.5 Global Key Players of Three-Point Linkage Head office and Area Served
- 3.6 Mergers & Acquisitions, Expansion Plans
4 Three-Point Linkage Breakdown Data by Type
- 4.1 Global Three-Point Linkage Historic Market Size by Type (2018-2023)
- 4.2 Global Three-Point Linkage Forecasted Market Size by Type (2024-2029)
5 Three-Point Linkage Breakdown Data by Application
- 5.1 Global Three-Point Linkage Historic Market Size by Application (2018-2023)
- 5.2 Global Three-Point Linkage Forecasted Market Size by Application (2024-2029)
6 North America
- 6.1 North America Three-Point Linkage Market Size (2018-2029)
- 6.2 North America Three-Point Linkage Market Growth Rate by Country: 2018 VS 2022 VS 2029
- 6.3 North America Three-Point Linkage Market Size by Country (2018-2023)
- 6.4 North America Three-Point Linkage Market Size by Country (2024-2029)
- 6.5 United States
- 6.6 Canada
7 Europe
- 7.1 Europe Three-Point Linkage Market Size (2018-2029)
- 7.2 Europe Three-Point Linkage Market Growth Rate by Country: 2018 VS 2022 VS 2029
- 7.3 Europe Three-Point Linkage Market Size by Country (2018-2023)
- 7.4 Europe Three-Point Linkage Market Size by Country (2024-2029)
- 7.5 Germany
- 7.6 France
- 7.7 U.K.
- 7.8 Italy
- 7.9 Russia
8 Asia-Pacific
- 8.1 Asia-Pacific Three-Point Linkage Market Size (2018-2029)
- 8.2 Asia-Pacific Three-Point Linkage Market Growth Rate by Country: 2018 VS 2022 VS 2029
- 8.3 Asia-Pacific Three-Point Linkage Market Size by Region (2018-2023)
- 8.4 Asia-Pacific Three-Point Linkage Market Size by Region (2024-2029)
- 8.5 China
- 8.6 Japan
- 8.7 Southeast Asia
- 8.8 India
9 Latin America
- 9.1 Latin America Three-Point Linkage Market Size (2018-2029)
- 9.2 Latin America Three-Point Linkage Market Growth Rate by Country: 2018 VS 2022 VS 2029
- 9.3 Latin America Three-Point Linkage Market Size by Country (2018-2023)
- 9.4 Latin America Three-Point Linkage Market Size by Country (2024-2029)
- 9.5 Mexico
- 9.6 Brazil
10 Middle East & Africa
- 10.1 Middle East & Africa Three-Point Linkage Market Size (2018-2029)
- 10.2 Middle East & Africa Three-Point Linkage Market Growth Rate by Country: 2018 VS 2022 VS 2029
- 10.3 Middle East & Africa Three-Point Linkage Market Size by Country (2018-2023)
- 10.4 Middle East & Africa Three-Point Linkage Market Size by Country (2024-2029)
- 10.5 Middle East
- 10.6 Africa
11 Key Players Profiles
- 11.1 Bobcat
- 11.1.1 Bobcat Company Details
- 11.1.2 Bobcat Business Overview
- 11.1.3 Bobcat Three-Point Linkage Introduction
- 11.1.4 Bobcat Revenue in Three-Point Linkage Business (2018-2023)
- 11.2 Deere & Company
- 11.2.1 Deere & Company Company Details
- 11.2.2 Deere & Company Business Overview
- 11.2.3 Deere & Company Three-Point Linkage Introduction
- 11.2.4 Deere & Company Revenue in Three-Point Linkage Business (2018-2023)
- 11.3 CBM Spa
- 11.3.1 CBM Spa Company Details
- 11.3.2 CBM Spa Business Overview
- 11.3.3 CBM Spa Three-Point Linkage Introduction
- 11.3.4 CBM Spa Revenue in Three-Point Linkage Business (2018-2023)
- 11.4 Yanmar
- 11.4.1 Yanmar Company Details
- 11.4.2 Yanmar Business Overview
- 11.4.3 Yanmar Three-Point Linkage Introduction
- 11.4.4 Yanmar Revenue in Three-Point Linkage Business (2018-2023)
- 11.5 Zuidberg
- 11.5.1 Zuidberg Company Details
- 11.5.2 Zuidberg Business Overview
- 11.5.3 Zuidberg Three-Point Linkage Introduction
- 11.5.4 Zuidberg Revenue in Three-Point Linkage Business (2018-2023)
- 11.6 GDS Gangl Docking Systems
- 11.6.1 GDS Gangl Docking Systems Company Details
- 11.6.2 GDS Gangl Docking Systems Business Overview
- 11.6.3 GDS Gangl Docking Systems Three-Point Linkage Introduction
- 11.6.4 GDS Gangl Docking Systems Revenue in Three-Point Linkage Business (2018-2023)
- 11.7 Avant Tecno Oy
- 11.7.1 Avant Tecno Oy Company Details
- 11.7.2 Avant Tecno Oy Business Overview
- 11.7.3 Avant Tecno Oy Three-Point Linkage Introduction
- 11.7.4 Avant Tecno Oy Revenue in Three-Point Linkage Business (2018-2023)
- 11.8 IronCraft
- 11.8.1 IronCraft Company Details
- 11.8.2 IronCraft Business Overview
- 11.8.3 IronCraft Three-Point Linkage Introduction
- 11.8.4 IronCraft Revenue in Three-Point Linkage Business (2018-2023)
- 11.9 Ventrac
- 11.9.1 Ventrac Company Details
- 11.9.2 Ventrac Business Overview
- 11.9.3 Ventrac Three-Point Linkage Introduction
- 11.9.4 Ventrac Revenue in Three-Point Linkage Business (2018-2023)
- 11.10 Grouser Products
- 11.10.1 Grouser Products Company Details
- 11.10.2 Grouser Products Business Overview
- 11.10.3 Grouser Products Three-Point Linkage Introduction
- 11.10.4 Grouser Products Revenue in Three-Point Linkage Business (2018-2023)
12 Analyst's Viewpoints/Conclusions
13 Appendix
- 13.1 Research Methodology
- 13.1.1 Methodology/Research Approach
- 13.1.2 Data Source
- 13.2 Author Details
- 13.3 Disclaimer