|
|
市場調査レポート
商品コード
1304144
水処理薬品の世界市場、実績と予測(2018年~2029年)Global Water Treatment Chemicals Market Report, History and Forecast 2018-2029 |
||||||
|
|
|||||||
カスタマイズ可能
適宜更新あり
|
|||||||


| 水処理薬品の世界市場、実績と予測(2018年~2029年) |
|
出版日: 2023年07月11日
発行: QYResearch
ページ情報: 英文 180 Pages
納期: 2~3営業日
|

- 全表示
- 概要
- 図表
- 目次
世界の水処理薬品の市場規模は、2022年の361億8,160万米ドルから2029年までに461億1,318万米ドルに達し、予測期間中にCAGRで3.74%の成長が予測されています。
当レポートでは、世界の水処理薬品市場について調査分析し、市場規模の実績と予測、地域とセグメントの分析、企業プロファイルなどを提供しています。
目次
第1章 水処理薬品市場の概要
- 水処理薬品市場の概要
- 水処理薬品の製品の範囲
- 水処理薬品市場の現状と見通し
- 世界の水処理薬品の市場規模の概要:地域別(2018年・2023年・2029年)
- 世界の水処理薬品の市場規模:地域別(2018年~2029年)
- 世界の水処理薬品の市場規模の実績:地域別(2018年~2023年)
- 世界の水処理薬品の市場規模の予測:地域別(2024年~2029年)
- 主要地域の水処理薬品の市場規模(2018年~2029年)
- 北米の水処理薬品の市場規模(2018年~2029年)
- 欧州の水処理薬品の市場規模(2018年~2029年)
- アジア太平洋の水処理薬品の市場規模(2018年~2029年)
- ラテンアメリカの水処理薬品の市場規模(2018年~2029年)
- 中東・アフリカの水処理薬品の市場規模(2018年~2029年)
第2章 水処理薬品市場の概要:タイプ別
- 世界の水処理薬品の市場規模:タイプ別(2018年・2023年・2029年)
- 世界の水処理向けホスホン酸塩、EDTA塩、DTPA塩の市場規模(2018年~2023年)
- 世界の水処理薬品の市場規模の実績:タイプ別(2018年~2023年)
- 世界の水処理薬品の市場規模の予測:タイプ別(2024年~2029年)
- Ph調整剤・軟化剤
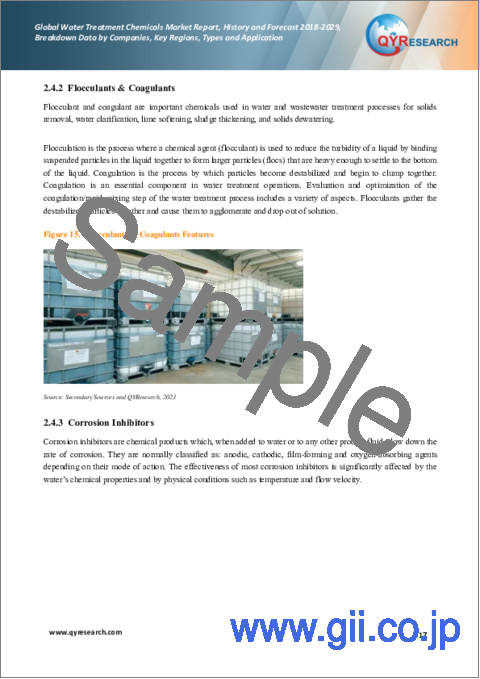
- 凝集剤・凝固剤
- 腐食防止剤
- スケール防止剤/分散剤
- 殺生剤・消毒剤
第3章 水処理薬品市場の概要:用途別
- 世界の水処理薬品の市場規模:用途別(2018年・2023年・2029年)
- 世界の水処理薬品の市場規模の実績:用途別(2018年~2023年)
- 世界の水処理薬品の市場規模の予測:用途別(2024年~2029年)
- 都市の水処理
- 製紙排水処理
- 金属・鉱業
- 石油・ガス産業
第4章 水処理薬品の競合分析:企業別
- 世界の水処理薬品の市場規模:企業別(2018年~2023年)
- 世界の主要企業:企業タイプ別(Tier 1、Tier 2、Tier 3)(2022年の水処理薬品の収益に基づく)
- 世界の水処理薬品の主要企業の本社、製造施設
- 世界の水処理薬品の主要企業、製品、用途
- 競合ステータス
- 水処理薬品市場の集中率
- 合併と買収、拡張計画
第5章 主要企業のプロファイル
- Solenis
- SNF Group
- Ecolab
- Veolia
- Kemira
- Kurita Water Industries
- Chemtrade Logistics
- Shandong Taihe
- Dow
- Italmatch AWS
- Henan Qingshuiyuan Technology
- Feralco Group
- USALCO
- Ixom Watercare
- Changlong Tech
- Jianheng Industry
- Nouryon
- Nantong Uniphos Chemicals
- Grupo Bauminas
- Aditya Birla Chemicals
- PT Lautan Luas Tbk
- Holland Company
第6章 北米
- 北米の水処理薬品の市場規模:国別(2018年~2029年)
- 米国
- カナダ
第7章 欧州
- 欧州の水処理薬品の市場規模:国別(2018年~2029年)
- ドイツ
- フランス
- 英国
- イタリア
- ロシア
- 北欧諸国
第8章 アジア太平洋
- アジア太平洋の水処理薬品の市場規模(2018年~2029年)
- 中国
- 日本
- インド
- 韓国
- インドネシア
- タイ
- オーストラリア
第9章 ラテンアメリカ
- ラテンアメリカの水処理薬品の市場規模:国別(2018年~2029年)
- メキシコ
- ブラジル
- アルゼンチン
第10章 中東・アフリカ
- 中東・アフリカの水処理薬品の市場規模:国別
- GCC諸国
- トルコ
- 南アフリカ
第11章 水処理薬品の市場力学
- 水処理薬品業界の動向
- 水処理薬品市場の促進要因
- 水処理薬品市場の課題
- 水処理薬品市場の抑制要因
第12章 調査結果/結論
第13章 調査手法とデータソース
List of Tables
- Table 1. Global Market Water Treatment Chemicals Market Size (US$ Million) Comparison by Region: 2018 VS 2023 VS 2029
- Table 2. Global Water Treatment Chemicals Market Size by Region (2018-2023) & (US$ Million)
- Table 3. Global Water Treatment Chemicals Market Size Share by Region (2018-2023)
- Table 4. Global Water Treatment Chemicals Forecasted Market Size by Region (2024-2029) & (US$ Million)
- Table 5. Global Water Treatment Chemicals Forecasted Market Size Share by Region (2024-2029)
- Table 6. Global Water Treatment Chemicals Market Size (US$ Million) by Type: 2018 VS 2023 VS 2029
- Table 7. Global Water Treatment Chemicals Market Size by Type (2018-2023) & (US$ Million)
- Table 8. Global Water Treatment Chemicals Revenue Market Share by Type (2018-2023)
- Table 9. Global Water Treatment Chemicals Forecasted Market Size by Type (2024-2029) & (US$ Million)
- Table 10. Global Water Treatment Chemicals Revenue Market Share by Type (2024-2029)
- Table 11. Global Water Treatment Chemicals Market Size by Application: (US$ Million) 2018 VS 2023 VS 2029
- Table 12. Global Water Treatment Chemicals Market Size by Application (2018-2023) & (US$ Million)
- Table 13. Global Water Treatment Chemicals Revenue Market Share by Application (2018-2023)
- Table 14. Global Water Treatment Chemicals Forecasted Market Size by Application (2024-2029) & (US$ Million)
- Table 15. Global Water Treatment Chemicals Revenue Market Share by Application (2024-2029)
- Table 16. Global Water Treatment Chemicals Revenue by Players (2018-2023) & (US$ Million)
- Table 17. Global Water Treatment Chemicals Revenue Market Share by Players (2018-2023)
- Table 18. Global Top Players Market Share by Company Type (Tier 1, Tier 2, and Tier 3) & (based on the Revenue in Water Treatment Chemicals as of 2022)
- Table 19. Global Key Players of Water Treatment Chemicals, Headquarters and Manufacturing Sites
- Table 20. Global Key Players of Water Treatment Chemicals, Product and Application
- Table 21. Mergers & Acquisitions, Expansion Plans
- Table 22. Solenis Company Details
- Table 23. Solenis Business Overview
- Table 24. Solenis Water Treatment Chemicals Product
- Table 25. Solenis Revenue in Water Treatment Chemicals Business (2018-2023) & (US$ Million)
- Table 26. SNF Group Company Details
- Table 27. SNF Group Business Overview
- Table 28. SNF Group Water Treatment Chemicals Product
- Table 29. SNF Group Revenue in Water Treatment Chemicals Business (2018-2023) & (US$ Million)
- Table 30. Ecolab Company Details
- Table 31. Ecolab Business Overview
- Table 32. Ecolab Water Treatment Chemicals Product
- Table 33. Ecolab Revenue in Water Treatment Chemicals Business (2018-2023) & (US$ Million)
- Table 34. Veolia Company Details
- Table 35. Veolia Business Overview
- Table 36. Veolia Water Treatment Chemicals Product
- Table 37. Veolia Revenue in Water Treatment Chemicals Business (2018-2023) & (US$ Million)
- Table 38. Kemira Company Details
- Table 39. Kemira Business Overview
- Table 40. Kemira Water Treatment Chemicals Product
- Table 41. Kemira Revenue in Water Treatment Chemicals Business (2018-2023) & (US$ Million)
- Table 42. Kurita Water Industries Company Details
- Table 43. Kurita Water Industries Business Overview
- Table 44. Kurita Water Industries Water Treatment Chemicals Product
- Table 45. Kurita Water Industries Revenue in Water Treatment Chemicals Business (2018-2023) & (US$ Million)
- Table 46. Chemtrade Logistics Company Details
- Table 47. Chemtrade Logistics Business Overview
- Table 48. Chemtrade Logistics Water Treatment Chemicals Product
- Table 49. Chemtrade Logistics Revenue in Water Treatment Chemicals Business (2018-2023) & (US$ Million)
- Table 50. Shandong Taihe Company Details
- Table 51. Shandong Taihe Business Overview
- Table 52. Shandong Taihe Water Treatment Chemicals Product
- Table 53. Shandong Taihe Revenue in Water Treatment Chemicals Business (2018-2023) & (US$ Million)
- Table 54. Dow Company Details
- Table 55. Dow Business Overview
- Table 56. Dow Water Treatment Chemicals Product
- Table 57. Dow Revenue in Water Treatment Chemicals Business (2018-2023) & (US$ Million)
- Table 58. Italmatch AWS Company Details
- Table 59. Italmatch AWS Business Overview
- Table 60. Italmatch AWS Water Treatment Chemicals Product
- Table 61. Italmatch AWS Revenue in Water Treatment Chemicals Business (2018-2023) & (US$ Million)
- Table 62. Henan Qingshuiyuan Technology Company Details
- Table 63. Henan Qingshuiyuan Technology Business Overview
- Table 64. Henan Qingshuiyuan Technology Water Treatment Chemicals Product
- Table 65. Henan Qingshuiyuan Technology Revenue in Water Treatment Chemicals Business (2018-2023) & (US$ Million)
- Table 66. Feralco Group Company Details
- Table 67. Feralco Group Business Overview
- Table 68. Feralco Group Water Treatment Chemicals Product
- Table 69. Feralco Group Revenue in Water Treatment Chemicals Business (2018-2023) & (US$ Million)
- Table 70. USALCO Company Details
- Table 71. USALCO Business Overview
- Table 72. USALCO Water Treatment Chemicals Product
- Table 73. USALCO Revenue in Water Treatment Chemicals Business (2018-2023) & (US$ Million)
- Table 74. Ixom Watercare Company Details
- Table 75. Ixom Watercare Business Overview
- Table 76. Ixom Watercare Water Treatment Chemicals Product
- Table 77. Ixom Watercare Revenue in Water Treatment Chemicals Business (2018-2023) & (US$ Million)
- Table 78. Changlong Tech Company Details
- Table 79. Changlong Tech Business Overview
- Table 80. Changlong Tech Water Treatment Chemicals Product
- Table 81. Changlong Tech Revenue in Water Treatment Chemicals Business (2018-2023) & (US$ Million)
- Table 82. Jianheng Industry Company Details
- Table 83. Jianheng Industry Business Overview
- Table 84. Jianheng Industry Water Treatment Chemicals Product
- Table 85. Jianheng Industry Revenue in Water Treatment Chemicals Business (2018-2023) & (US$ Million)
- Table 86. Nouryon Company Details
- Table 87. Nouryon Business Overview
- Table 88. Nouryon Water Treatment Chemicals Product
- Table 89. Nouryon Revenue in Water Treatment Chemicals Business (2018-2023) & (US$ Million)
- Table 90. Nantong Uniphos Chemicals Company Details
- Table 91. Nantong Uniphos Chemicals Business Overview
- Table 92. Nantong Uniphos Chemicals Water Treatment Chemicals Product
- Table 93. Nantong Uniphos Chemicals Revenue in Water Treatment Chemicals Business (2018-2023) & (US$ Million)
- Table 94. Grupo Bauminas Company Details
- Table 95. Grupo Bauminas Business Overview
- Table 96. Grupo Bauminas Water Treatment Chemicals Product
- Table 97. Grupo Bauminas Revenue in Water Treatment Chemicals Business (2018-2023) & (US$ Million)
- Table 98. Aditya Birla Chemicals Company Details
- Table 99. Aditya Birla Chemicals Business Overview
- Table 100. Aditya Birla Chemicals Water Treatment Chemicals Product
- Table 101. Aditya Birla Chemicals Revenue in Water Treatment Chemicals Business (2018-2023) & (US$ Million)
- Table 102. PT Lautan Luas Tbk Company Details
- Table 103. PT Lautan Luas Tbk Business Overview
- Table 104. PT Lautan Luas Tbk Water Treatment Chemicals Product
- Table 105. PT Lautan Luas Tbk Revenue in Water Treatment Chemicals Business (2018-2023) & (US$ Million)
- Table 106. Holland Company Company Details
- Table 107. Holland Company Business Overview
- Table 108. Holland Company Water Treatment Chemicals Product
- Table 109. Holland Company Revenue in Water Treatment Chemicals Business (2018-2023) & (US$ Million)
- Table 110. North America Water Treatment Chemicals Market Size Growth Rate (CAGR) by Country (US$ Million): 2018 VS 2023 VS 2029
- Table 111. North America Water Treatment Chemicals Market Size by Country (2018-2023) & (US$ Million)
- Table 112. North America Water Treatment Chemicals Market Size by Country (2024-2029) & (US$ Million)
- Table 113. Europe Water Treatment Chemicals Market Size Growth Rate (CAGR) by Country (US$ Million): 2018 VS 2023 VS 2029
- Table 114. Europe Water Treatment Chemicals Market Size by Country (2018-2023) & (US$ Million)
- Table 115. Europe Water Treatment Chemicals Market Size by Country (2024-2029) & (US$ Million)
- Table 116. Europe Water Treatment Chemicals Market Share by Country (2018-2023)
- Table 117. Europe Water Treatment Chemicals Market Share by Country (2024-2029)
- Table 118. Asia-Pacific Water Treatment Chemicals Market Size Growth Rate (CAGR) by Region (US$ Million): 2018 VS 2023 VS 2029
- Table 119. Asia-Pacific Water Treatment Chemicals Market Size by Region (2018-2023) & (US$ Million)
- Table 120. Asia-Pacific Water Treatment Chemicals Market Size by Region (2024-2029) & (US$ Million)
- Table 121. Asia-Pacific Water Treatment Chemicals Market Share by Region (2018-2023)
- Table 122. Asia-Pacific Water Treatment Chemicals Market Share by Region (2024-2029)
- Table 123. Latin America Water Treatment Chemicals Market Size Growth Rate (CAGR) by Country (US$ Million): 2018 VS 2023 VS 2029
- Table 124. Latin America Water Treatment Chemicals Market Size by Country (2018-2023) & (US$ Million)
- Table 125. Latin America Water Treatment Chemicals Market Size by Country (2024-2029) & (US$ Million)
- Table 126. Latin America Water Treatment Chemicals Market Share by Country (2018-2023)
- Table 127. Latin America Water Treatment Chemicals Market Share by Country (2024-2029)
- Table 128. Middle East and Africa Water Treatment Chemicals Market Size Growth Rate (CAGR) by Country (US$ Million): 2018 VS 2023 VS 2029
- Table 129. Middle East & Africa Water Treatment Chemicals Market Size by Country (2018-2023) & (US$ Million)
- Table 130. Middle East & Africa Water Treatment Chemicals Market Size by Country (2024-2029) & (US$ Million)
- Table 131. Middle East and Africa Water Treatment Chemicals Market Share by Region (2018-2023)
- Table 132. Middle East and Africa Water Treatment Chemicals Market Share by Region (2024-2029)
- Table 133. Water Treatment Chemicals Market Trends
- Table 134. Water Treatment Chemicals Market Drivers
- Table 135. Water Treatment Chemicals Market Challenges
- Table 136. Research Programs/Design for This Report
- Table 137. Key Data Information from Secondary Sources
- Table 138. Key Data Information from Primary Sources
- Table 139. QYR Business Unit and Senior & Team Lead Analysts
List of Figures
- Figure 1. Global Water Treatment Chemicals Market Size Year-over-Year (2018-2029) & (US$ Million)
- Figure 2. Global Water Treatment Chemicals Market Size, (US$ Million), 2018 VS 2023 VS 2029
- Figure 3. Global Water Treatment Chemicals Market Share by Region: 2022 VS 2029
- Figure 4. Global Water Treatment Chemicals Forecasted Market Size Share by Region (2018-2029)
- Figure 5. North America Water Treatment Chemicals Market Size Growth Rate (2018-2029) & (US$ Million)
- Figure 6. Europe Water Treatment Chemicals Market Size Growth Rate (2018-2029) & (US$ Million)
- Figure 7. Asia-Pacific Water Treatment Chemicals Market Size Growth Rate (2018-2029) & (US$ Million)
- Figure 8. Latin America Water Treatment Chemicals Market Size Growth Rate (2018-2029) & (US$ Million)
- Figure 9. Middle East & Africa Water Treatment Chemicals Market Size Growth Rate (2018-2029) & (US$ Million)
- Figure 10. Global Water Treatment Chemicals Market Size Share by Type: 2022 & 2029
- Figure 11. Global Phosphonates for Water Treatment Market Size (2018-2023) & (US$ Million)
- Figure 12. Global EDTA Salts for Water Treatment Market Size (2018-2023) & (US$ Million)
- Figure 13. Global DTPA Salts for Water Treatment Market Size (2018-2023) & (US$ Million)
- Figure 14. Ph Adjusters & Softeners Features
- Figure 15. Flocculants & Coagulants Features
- Figure 16. Corrosion Inhibitors Features
- Figure 17. Scale Inhibitors/Dispersants Features
- Figure 18. Biocides & Disinfectants Features
- Figure 19. Global Water Treatment Chemicals Market Size Share by Application: 2022 & 2029
- Figure 20. Municipal Water Treatment Case Studies
- Figure 21. Papermaking Waste Water Treatment Case Studies
- Figure 22. Metal & Mining Industry Case Studies
- Figure 23. Oil & Gas industry Case Studies
- Figure 24. Global Water Treatment Chemicals Market Share by Players in 2022
- Figure 25. Global Top Water Treatment Chemicals Players by Company Type (Tier 1, Tier 2, and Tier 3) & (based on the Revenue in Water Treatment Chemicals as of 2022)
- Figure 26. Solenis Revenue Growth Rate in Water Treatment Chemicals Business (2018-2023)
- Figure 27. SNF Group Revenue Growth Rate in Water Treatment Chemicals Business (2018-2023)
- Figure 28. Ecolab Revenue Growth Rate in Water Treatment Chemicals Business (2018-2023)
- Figure 29. Veolia Revenue Growth Rate in Water Treatment Chemicals Business (2018-2023)
- Figure 30. Kemira Revenue Growth Rate in Water Treatment Chemicals Business (2018-2023)
- Figure 31. Kurita Water Industries Revenue Growth Rate in Water Treatment Chemicals Business (2018-2023)
- Figure 32. Chemtrade Logistics Revenue Growth Rate in Water Treatment Chemicals Business (2018-2023)
- Figure 33. Shandong Taihe Revenue Growth Rate in Water Treatment Chemicals Business (2018-2023)
- Figure 34. Dow Revenue Growth Rate in Water Treatment Chemicals Business (2018-2023)
- Figure 35. Italmatch AWS Revenue Growth Rate in Water Treatment Chemicals Business (2018-2023)
- Figure 36. Henan Qingshuiyuan Technology Revenue Growth Rate in Water Treatment Chemicals Business (2018-2023)
- Figure 37. Feralco Group Revenue Growth Rate in Water Treatment Chemicals Business (2018-2023)
- Figure 38. USALCO Revenue Growth Rate in Water Treatment Chemicals Business (2018-2023)
- Figure 39. Ixom Watercare Revenue Growth Rate in Water Treatment Chemicals Business (2018-2023)
- Figure 40. Changlong Tech Revenue Growth Rate in Water Treatment Chemicals Business (2018-2023)
- Figure 41. Jianheng Industry Revenue Growth Rate in Water Treatment Chemicals Business (2018-2023)
- Figure 42. Nouryon Revenue Growth Rate in Water Treatment Chemicals Business (2018-2023)
- Figure 43. Nantong Uniphos Chemicals Revenue Growth Rate in Water Treatment Chemicals Business (2018-2023)
- Figure 44. Grupo Bauminas Revenue Growth Rate in Water Treatment Chemicals Business (2018-2023)
- Figure 45. Aditya Birla Chemicals Revenue Growth Rate in Water Treatment Chemicals Business (2018-2023)
- Figure 46. PT Lautan Luas Tbk Revenue Growth Rate in Water Treatment Chemicals Business (2018-2023)
- Figure 47. Holland Company Revenue Growth Rate in Water Treatment Chemicals Business (2018-2023)
- Figure 48. North America Water Treatment Chemicals Market Share by Country (2018-2029)
- Figure 49. United States Water Treatment Chemicals Market Size YoY Growth (2018-2029) & (US$ Million)
- Figure 50. Canada Water Treatment Chemicals Market Size YoY Growth (2018-2029) & (US$ Million)
- Figure 51. Europe Water Treatment Chemicals Market Share by Region (2018-2029)
- Figure 52. Germany Water Treatment Chemicals Market Size YoY Growth (2018-2029) & (US$ Million)
- Figure 53. France Water Treatment Chemicals Market Size YoY Growth (2018-2029) & (US$ Million)
- Figure 54. U.K. Water Treatment Chemicals Market Size YoY Growth (2018-2029) & (US$ Million)
- Figure 55. Italy Water Treatment Chemicals Market Size YoY Growth (2018-2029) & (US$ Million)
- Figure 56. Russia Water Treatment Chemicals Market Size YoY Growth (2018-2029) & (US$ Million)
- Figure 57. Nordic Countries Water Treatment Chemicals Market Size YoY Growth (2018-2029) & (US$ Million)
- Figure 58. Asia-Pacific Water Treatment Chemicals Market Share by Region (2018-2029)
- Figure 59. China Water Treatment Chemicals Market Size (2018-2029) & (US$ Million)
- Figure 60. Japan Water Treatment Chemicals Market Size YoY Growth (2018-2029) & (US$ Million)
- Figure 61. India Water Treatment Chemicals Market Size YoY Growth (2018-2029) & (US$ Million)
- Figure 62. South Korea Water Treatment Chemicals Market Size YoY Growth (2018-2029) & (US$ Million)
- Figure 63. Indonesia Water Treatment Chemicals Market Size YoY Growth (2018-2029) & (US$ Million)
- Figure 64. Thailand Water Treatment Chemicals Market Size YoY Growth (2018-2029) & (US$ Million)
- Figure 65. Australia Water Treatment Chemicals Market Size YoY Growth (2018-2029) & (US$ Million)
- Figure 66. Latin America Water Treatment Chemicals Market Share by Region (2018-2029)
- Figure 67. Mexico Water Treatment Chemicals Market Size YoY Growth (2018-2029) & (US$ Million)
- Figure 68. Brazil Water Treatment Chemicals Market Size YoY Growth (2018-2029) & (US$ Million)
- Figure 69. Argentina Water Treatment Chemicals Market Size YoY Growth (2018-2029) & (US$ Million)
- Figure 70. Middle East & Africa Water Treatment Chemicals Market Share by Country (2018-2029)
- Figure 71. GCC Countries Water Treatment Chemicals Market Size YoY Growth (2018-2029) & (US$ Million)
- Figure 72. Turkey Water Treatment Chemicals Market Size YoY Growth (2018-2029) & (US$ Million)
- Figure 73. South Africa Water Treatment Chemicals Market Size YoY Growth (2018-2029) & (US$ Million)
- Figure 74. Global Economic Forecast
- Figure 75. Bottom-up and Top-down Approaches for This Report
- Figure 76. Data Triangulation
The global Water Treatment Chemicals market is projected to grow from US$ 36,181.60 million in 2022 to US$ 46,113.18 million by 2029, at a Compound Annual Growth Rate (CAGR) of 3.74% during the forecast period.
The North America market for Water Treatment Chemicals is estimated to increase from $ 11,107.76 million in 2022 to reach $ 14,925.86 million by 2029, at a CAGR of 3.67% during the forecast period of 2023 through 2029.
The China market for Water Treatment Chemicals is estimated to increase from $ 8,568.95 million in 2022 to reach $ 9,626.83 million by 2029, at a CAGR of 4.29% during the forecast period of 2023 through 2029.
The Europe market for Water Treatment Chemicals is estimated to increase from $ 8,204.01 million in 2022 to reach $ 10,193.47 million by 2029, at a CAGR of 2.71% during the forecast period of 2023 through 2029.
The global key companies of Water Treatment Chemicals include: Solenis, SNF Group, Ecolab, Veolia, Kemira and Kurita Water Industries, etc. In 2022, the global top five players had a share approximately 29.41% in terms of revenue.
Report Scope
This report aims to provide a comprehensive presentation of the global market for Water Treatment Chemicals, with both quantitative and qualitative analysis, to help readers develop business/growth strategies, assess the market competitive situation, analyze their position in the current marketplace, and make informed business decisions regarding Water Treatment Chemicals.
The Water Treatment Chemicals market size, estimations, and forecasts are provided in terms of revenue ($ millions), considering 2021 as the base year, with history and forecast data for the period from 2018 to 2029. This report segments the global Water Treatment Chemicals market comprehensively. Regional market sizes, concerning products by Type, by Application, and by players, are also provided. The influence of COVID-19 and the Russia-Ukraine War were considered while estimating market sizes.
For a more in-depth understanding of the market, the report provides profiles of the competitive landscape, key competitors, and their respective market ranks. The report also discusses technological trends and new product developments.
This report will help the readers to understand the competition within the industries and strategies for the competitive environment to enhance the potential profit. The report also focuses on the competitive landscape of the global Water Treatment Chemicals market, and introduces in detail the market share, industry ranking, competitor ecosystem, market performance, new product development, operation situation, expansion, and acquisition. etc. of the main players, which helps the readers to identify the main competitors and deeply understand the competition pattern of the market.
Market Segmentation
This report covers the Water Treatment Chemicals segments by company, by Type, by Application, by region and country, and provides market size and CAGR for the history and forecast period (2018-2023, 2024-2029), considering 2022 as the base year. It elucidates potential revenue opportunities across different segments and explains attractive investment proposition matrices for this market.
By Company
- BASF
- DOW
- Mitsubishi Chemical
- AkzoNobel
- Economy Polymers & Chemicals
- IRO Chemical
- REDA Water
- Italmatch Chemicals
- Aquapharm Chemicals
- Zeel Product
- Qingshuiyuan Technology
- Shandong Taihe Water Treatment Technologies
- SunSing Photographic
- Kemira
- SNF Group
- Chemtrade Logistics
- Solenis
- Ecolab
- Feralco Group
- Grupo Bauminas
Segment by Type
- Ph Adjusters & Softeners
- Flocculants & Coagulants
- Corrosion Inhibitors
- Scale Inhibitors/Dispersants
- Biocides & Disinfectants
- Others
Segment by Application
- Municipal Water Treatment
- Papermaking Waste Water Treatment
- Metal & Mining Industry
- Oil & Gas industry
- Others
By Region
- North America
- United States
- Canada
- Asia-Pacific
- China
- Japan
- Korea
- India
- Indonesia
- Thailand
- Australia
- Europe
- Germany
- France
- U.K.
- Italy
- Russia
- Nordic Countries
- Latin America
- Mexico
- Brazil
- Argentina
- Middle East & Africa
- GCC Countries
- Turkey
- South Africa
Core Chapters
- Chapter One: Introduces the report scope of the report, executive summary of global and regional market size and CAGR for the history and forecast period (2018-2023, 2024-2029). It offers a high-level view of the current state of the market and its likely evolution in the short to mid-term, and long term.
- Chapter Two: Provides the analysis of various market segments by Type, covering the market size and development potential of each market segment, to help readers find the blue ocean market in different market segments.
- Chapter Three: Provides the analysis of various market segments by Application, covering the market size and development potential of each market segment, to help readers find the blue ocean market in different downstream markets.
- Chapter Four: Detailed analysis of Water Treatment Chemicals companies's competitive landscape, revenue, market share and ranking, latest development plan, merger, and acquisition information, etc.
- Chapter Five: Provides profiles of key players, introducing the basic situation of the main companies in the market in detail, including product introduction, revenue, recent development, etc.
- Chapter Six, Seven, Eight, Nine and Ten: North America, Europe, Asia Pacific, Latin America, Middle East & Africa, revenue by country.
- Chapter Eleven: this section also introduces the market dynamics, latest developments of the market, the driving factors and restrictive factors of the market, the challenges and risks faced by companies in the industry, and the analysis of relevant policies in the industry.
- Chapter Twelve: Research Finding/Conclusion
Table of Contents
1 Market Overview of Water Treatment Chemicals
- 1.1 Water Treatment Chemicals Market Overview
- 1.1.1 Water Treatment Chemicals Product Scope
- 1.1.2 Water Treatment Chemicals Market Status and Outlook
- 1.2 Global Water Treatment Chemicals Market Size Overview by Region 2018 VS 2023 VS 2029
- 1.3 Global Water Treatment Chemicals Market Size by Region (2018-2029)
- 1.4 Global Water Treatment Chemicals Historic Market Size by Region (2018-2023)
- 1.5 Global Water Treatment Chemicals Market Size Forecast by Region (2024-2029)
- 1.6 Key Regions Water Treatment Chemicals Market Size (2018-2029)
- 1.6.1 North America Water Treatment Chemicals Market Size (2018-2029)
- 1.6.2 Europe Water Treatment Chemicals Market Size (2018-2029)
- 1.6.3 Asia-Pacific Water Treatment Chemicals Market Size (2018-2029)
- 1.6.4 Latin America Water Treatment Chemicals Market Size (2018-2029)
- 1.6.5 Middle East & Africa Water Treatment Chemicals Market Size (2018-2029)
2 Water Treatment Chemicals Market Overview by Type
- 2.1 Global Water Treatment Chemicals Market Size by Type: 2018 VS 2023 VS 2029
- 2.2 Global Phosphonates & EDTA Salts & DTPA Salts for Water Treatment Market Size (2018-2023)
- 2.3 Global Water Treatment Chemicals Historic Market Size by Type (2018-2023)
- 2.4 Global Water Treatment Chemicals Forecasted Market Size by Type (2024-2029)
- 2.4.1 Ph Adjusters & Softeners
- 2.4.2 Flocculants & Coagulants
- 2.4.3 Corrosion Inhibitors
- 2.4.4 Scale Inhibitors/Dispersants
- 2.4.5 Biocides & Disinfectants
3 Water Treatment Chemicals Market Overview by Application
- 3.1 Global Water Treatment Chemicals Market Size by Application: 2018 VS 2023 VS 2029
- 3.2 Global Water Treatment Chemicals Historic Market Size by Application (2018-2023)
- 3.3 Global Water Treatment Chemicals Forecasted Market Size by Application (2024-2029)
- 3.4 Municipal Water Treatment
- 3.5 Papermaking Waste Water Treatment
- 3.6 Metal & Mining Industry
- 3.7 Oil & Gas industry
4 Water Treatment Chemicals Competition Analysis by Players
- 4.1 Global Water Treatment Chemicals Market Size by Players (2018-2023)
- 4.2 Global Top Players by Company Type (Tier 1, Tier 2, and Tier 3) & (based on the Revenue in Water Treatment Chemicals as of 2022)
- 4.3 Global Key Players of Water Treatment Chemicals Head office and Manufacturing Sites
- 4.4 Global Key Players of Water Treatment Chemicals, Product and Application
- 4.5 Competitive Status
- 4.5.1 Water Treatment Chemicals Market Concentration Rate
- 4.5.2 Mergers & Acquisitions, Expansion Plans
5 Key Players Profiles
- 5.1 Solenis
- 5.1.1 Solenis Company Details
- 5.1.2 Solenis Business Overview
- 5.1.3 Solenis Water Treatment Chemicals Introduction
- 5.1.4 Solenis Revenue in Water Treatment Chemicals Business (2018-2023)
- 5.2 SNF Group
- 5.2.1 SNF Group Company Details
- 5.2.2 SNF Group Business Overview
- 5.2.3 SNF Group Water Treatment Chemicals Introduction
- 5.2.4 SNF Group Revenue in Water Treatment Chemicals Business (2018-2023)
- 5.3 Ecolab
- 5.3.1 Ecolab Company Details
- 5.3.2 Ecolab Business Overview
- 5.3.3 Ecolab Water Treatment Chemicals Introduction
- 5.3.4 Ecolab Revenue in Water Treatment Chemicals Business (2018-2023)
- 5.4 Veolia
- 5.4.1 Veolia Company Details
- 5.4.2 Veolia Business Overview
- 5.4.3 Veolia Water Treatment Chemicals Introduction
- 5.4.4 Veolia Revenue in Water Treatment Chemicals Business (2018-2023)
- 5.5 Kemira
- 5.5.1 Kemira Company Details
- 5.5.2 Kemira Business Overview
- 5.5.3 Kemira Water Treatment Chemicals Introduction
- 5.5.4 Kemira Revenue in Water Treatment Chemicals Business (2018-2023)
- 5.6 Kurita Water Industries
- 5.6.1 Kurita Water Industries Company Details
- 5.6.2 Kurita Water Industries Business Overview
- 5.6.3 Kurita Water Industries Water Treatment Chemicals Introduction
- 5.6.4 Kurita Water Industries Revenue in Water Treatment Chemicals Business (2018-2023)
- 5.7 Chemtrade Logistics
- 5.7.1 Chemtrade Logistics Company Details
- 5.7.2 Chemtrade Logistics Business Overview
- 5.7.3 Chemtrade Logistics Water Treatment Chemicals Introduction
- 5.7.4 Chemtrade Logistics Revenue in Water Treatment Chemicals Business (2018-2023)
- 5.8 Shandong Taihe
- 5.8.1 Shandong Taihe Company Details
- 5.8.2 Shandong Taihe Business Overview
- 5.8.3 Shandong Taihe Water Treatment Chemicals Introduction
- 5.8.4 Shandong Taihe Revenue in Water Treatment Chemicals Business (2018-2023)
- 5.9 Dow
- 5.9.1 Dow Company Details
- 5.9.2 Dow Business Overview
- 5.9.3 Dow Water Treatment Chemicals Introduction
- 5.9.4 Dow Revenue in Water Treatment Chemicals Business (2018-2023)
- 5.10 Italmatch AWS
- 5.10.1 Italmatch AWS Company Details
- 5.10.2 Italmatch AWS Business Overview
- 5.10.3 Italmatch AWS Water Treatment Chemicals Introduction
- 5.10.4 Italmatch AWS Revenue in Water Treatment Chemicals Business (2018-2023)
- 5.11 Henan Qingshuiyuan Technology
- 5.11.1 Henan Qingshuiyuan Technology Company Details
- 5.11.2 Henan Qingshuiyuan Technology Business Overview
- 5.11.3 Henan Qingshuiyuan Technology Water Treatment Chemicals Introduction
- 5.11.4 Henan Qingshuiyuan Technology Revenue in Water Treatment Chemicals Business (2018-2023)
- 5.12 Feralco Group
- 5.12.1 Feralco Group Company Details
- 5.12.2 Feralco Group Business Overview
- 5.12.3 Feralco Group Water Treatment Chemicals Introduction
- 5.12.4 Feralco Group Revenue in Water Treatment Chemicals Business (2018-2023)
- 5.13 USALCO
- 5.13.1 USALCO Company Details
- 5.13.2 USALCO Business Overview
- 5.13.3 USALCO Water Treatment Chemicals Introduction
- 5.13.4 USALCO Revenue in Water Treatment Chemicals Business (2018-2023)
- 5.14 Ixom Watercare
- 5.14.1 Ixom Watercare Company Details
- 5.14.2 Ixom Watercare Business Overview
- 5.14.3 Ixom Watercare Water Treatment Chemicals Introduction
- 5.14.4 Ixom Watercare Revenue in Water Treatment Chemicals Business (2018-2023)
- 5.15 Changlong Tech
- 5.15.1 Changlong Tech Company Details
- 5.15.2 Changlong Tech Business Overview
- 5.15.3 Changlong Tech Water Treatment Chemicals Introduction
- 5.15.4 Changlong Tech Revenue in Water Treatment Chemicals Business (2018-2023)
- 5.16 Jianheng Industry
- 5.16.1 Jianheng Industry Company Details
- 5.16.2 Jianheng Industry Business Overview
- 5.16.3 Jianheng Industry Water Treatment Chemicals Introduction
- 5.16.4 Jianheng Industry Revenue in Water Treatment Chemicals Business (2018-2023)
- 5.17 Nouryon
- 5.17.1 Nouryon Company Details
- 5.17.2 Nouryon Business Overview
- 5.17.3 Nouryon Water Treatment Chemicals Introduction
- 5.17.4 Nouryon Revenue in Water Treatment Chemicals Business (2018-2023)
- 5.18 Nantong Uniphos Chemicals
- 5.18.1 Nantong Uniphos Chemicals Company Details
- 5.18.2 Nantong Uniphos Chemicals Business Overview
- 5.18.3 Nantong Uniphos Chemicals Water Treatment Chemicals Introduction
- 5.18.4 Nantong Uniphos Chemicals Revenue in Water Treatment Chemicals Business (2018-2023)
- 5.19 Grupo Bauminas
- 5.19.1 Grupo Bauminas Company Details
- 5.19.2 Grupo Bauminas Business Overview
- 5.19.3 Grupo Bauminas Water Treatment Chemicals Introduction
- 5.19.4 Grupo Bauminas Revenue in Water Treatment Chemicals Business (2018-2023)
- 5.20 Aditya Birla Chemicals
- 5.20.1 Aditya Birla Chemicals Company Details
- 5.20.2 Aditya Birla Chemicals Business Overview
- 5.20.3 Aditya Birla Chemicals Water Treatment Chemicals Introduction
- 5.20.4 Aditya Birla Chemicals Revenue in Water Treatment Chemicals Business (2018-2023)
- 5.21 PT Lautan Luas Tbk
- 5.21.1 PT Lautan Luas Tbk Company Details
- 5.21.2 PT Lautan Luas Tbk Business Overview
- 5.21.3 PT Lautan Luas Tbk Water Treatment Chemicals Introduction
- 5.21.4 PT Lautan Luas Tbk Revenue in Water Treatment Chemicals Business (2018-2023)
- 5.22 Holland Company
- 5.22.1 Holland Company Company Details
- 5.22.2 Holland Company Business Overview
- 5.22.3 Holland Company Water Treatment Chemicals Introduction
- 5.22.4 Holland Company Revenue in Water Treatment Chemicals Business (2018-2023)
6 North America
- 6.1 North America Water Treatment Chemicals Market Size by Country (2018-2029)
- 6.2 United States
- 6.3 Canada
7 Europe
- 7.1 Europe Water Treatment Chemicals Market Size by Country (2018-2029)
- 7.2 Germany
- 7.3 France
- 7.4 U.K.
- 7.5 Italy
- 7.6 Russia
- 7.7 Nordic Countries
8 Asia-Pacific
- 8.1 Asia-Pacific Water Treatment Chemicals Market Size by Region (2018-2029)
- 8.2 China
- 8.3 Japan
- 8.4 India
- 8.5 South Korea
- 8.6 Indonesia
- 8.7 Thailand
- 8.8 Australia
9 Latin America
- 9.1 Latin America Water Treatment Chemicals Market Size by Country (2018-2029)
- 9.2 Mexico
- 9.3 Brazil
- 9.4 Argentina
10 Middle East & Africa
- 10.1 Middle East & Africa Water Treatment Chemicals Market Size by Country
- 10.2 GCC Countries
- 10.3 Turkey
- 10.4 South Africa
11 Water Treatment Chemicals Market Dynamics
- 11.1 Water Treatment Chemicals Industry Trends
- 11.2 Water Treatment Chemicals Market Drivers
- 11.3 Water Treatment Chemicals Market Challenges
- 11.4 Water Treatment Chemicals Market Restraints
12 Research Finding/Conclusion
13 Methodology and Data Source
- 13.1 Methodology/Research Approach
- 13.1.1 Research Programs/Design
- 13.1.2 Market Size Estimation
- 13.1.3 Market Breakdown and Data Triangulation
- 13.2 Data Source
- 13.2.1 Secondary Sources
- 13.2.2 Primary Sources
- 13.3 Author List
- 13.4 Disclaimer
