|
|
市場調査レポート
商品コード
1258791
ナイロン6の世界市場:分析・実績・予測 (2023年~2029年)Global Nylon 6 Market Report, History and Forecast 2023-2029 - Customized Version |
||||||
|
|
|||||||
|
● お客様のご希望に応じて、既存データの加工や未掲載情報(例:国別セグメント)の追加などの対応が可能です。 詳細はお問い合わせください。 |
|||||||


| ナイロン6の世界市場:分析・実績・予測 (2023年~2029年) |
|
出版日: 2023年04月18日
発行: QYResearch
ページ情報: 英文 167 Pages
納期: 2~3営業日
|
- 全表示
- 概要
- 図表
- 目次
世界のナイロン6樹脂の市場は、COVID-19のパンデミックとロシア・ウクライナ戦争の影響により、この数年間に大幅な変化を遂げました。
世界のナイロン6の市場規模は、2018年の139億8,575万米ドルから増加し、2022年には169億6,794万米ドルとなり、2029年には252億394万米ドルに達し、2023年から2029年の間に5.73%のCAGRで成長すると予測されています。
目次
第1章 ナイロン6:市場概要
- ナイロン6:製品概要
- ナイロン6市場:種類別
- 標準ナイロン
- 強化ナイロン
- 世界のナイロン6の市場規模:種類別
- 世界のナイロン6の市場規模の概要:種類別 (2018年~2029年)
- 世界のナイロン6の過去の市場規模の分析:種類別 (2018年~2023年)
- 世界のナイロン6の市場規模の予測:種類別 (2024年~2029年)
- 主要地域の市場規模:種類別
- 北米のナイロン6の販売内訳:種類別 (2018年~2023年)
- 欧州のナイロン6の販売内訳:種類別 (2018年~2023年)
- アジア太平洋のナイロン6の販売内訳:種類別 (2018年~2023年)
- ラテンアメリカのナイロン6の販売内訳:種類別 (2018年~2023年)
- 中東・アフリカのナイロン6の販売内訳:種類別 (2018年~2023年)
第2章 ナイロン6の市場競合:企業別
- 世界のナイロン6の主要企業の販売 (2018年~2023年)
- 世界のナイロン6の主要企業の収益 (2018年~2023年)
- 世界のナイロン6の主要企業の価格 (2018年~2023年)
- ナイロン6市場の競争状況と動向
- 世界の主要メーカー:企業の種類別 (ティア1、ティア2、ティア3) (ナイロン6の収益別、2022年)
- 企業合併・買収 (M&A)、拡大
第3章 ナイロン6の現状と展望:地域別
- 世界のナイロン6の市場規模・CAGR:地域別 (2018年・2022年・2029年)
- 世界のナイロン6の過去の市場規模:地域別
- 世界のナイロン6の市場規模の予測:地域別
第4章 ナイロン6:用途別
- ナイロン6市場:用途別
- 自動車産業
- エレクトロニクス・電気
- 包装産業
- その他
- 世界のナイロン6の市場規模:用途別
- 世界のナイロン6の市場規模の概要:用途別 (2018年~2029年)
- 世界のナイロン6の過去の市場規模の分析:用途別 (2018年~2023年)
- 世界のナイロン6の市場規模の予測:用途別 (2024年~2029年)
- 主要地域の市場規模:用途別
- 北米のナイロン6の販売内訳:用途別 (2018年~2023年)
- 欧州のナイロン6の販売内訳:用途別 (2018年~2023年)
- アジア太平洋のナイロン6の販売内訳:用途別 (2018年~2023年)
- ラテンアメリカのナイロン6の販売内訳:用途別 (2018年~2023年)
- 中東・アフリカのナイロン6の販売内訳:用途別 (2018年~2023年)
第5章 北米のナイロン6:国別
- 北米のナイロン6の過去の市場規模:国別
- 北米のナイロン6の市場規模の予測:国別
第6章 欧州のナイロン6:国別
第7章 アジア太平洋のナイロン6:地域別
第8章 ラテンアメリカのナイロン6:国別
第9章 中東・アフリカのナイロン6:国別
第10章 企業プロファイル
- BASF SE
- Advansix
- Royal DSM NV
- Lanxess
- Clariant Corporation
- Unitika
- DOMO Chemicals
- Grupa Azoty
- LIBOLON
- Polymeric Resources Corporation (PRC)
- UBE
- Ems-Grivory
- Shakespeare
第11章 上流工程・機会・課題・リスク・影響要因の分析
- ナイロン6の主要原材料
- 製造コストの構造
- ナイロン6の産業チェーンの分析
- ナイロン6の市場力学
第12章 マーケティング戦略分析、流通業者
- 販売チャンネル
- ナイロン6の流通業者
- ナイロン6の下流工程の顧客
第13章 ナイロンのリサイクル事業
- ナイロンのリサイクル工程
- 商業リサイクル事業
- 製造プロセス
- リサイクルの産業チェーンの分析
第14章 調査結果と結論
第15章 付録
List of Tables
- Table 1. Global Nylon 6 Sales by Type: 2018 VS 2022 VS 2029 (US$ Million)
- Table 2. Global Nylon 6 Sales by Type (2018-2023) & (K MT)
- Table 3. Global Nylon 6 Sales Market Share in Volume by Type (2018-2023)
- Table 4. Global Nylon 6 Sales by Type (2018-2023) & (US$ Million)
- Table 5. Global Nylon 6 Sales Market Share in Value by Type (2018-2023)
- Table 6. Global Nylon 6 Price by Type (2018-2023) & (USD/MT)
- Table 7. Global Nylon 6 Sales by Type (2024-2029) & (K MT)
- Table 8. Global Nylon 6 Sales Market Share in Volume by Type (2024-2029)
- Table 9. Global Nylon 6 Sales by Type (2024-2029) & (US$ Million)
- Table 10. Global Nylon 6 Sales Market Share in Value by Type (2024-2029)
- Table 11. Global Nylon 6 Price by Type (2024-2029) & (USD/MT)
- Table 12. North America Nylon 6 Sales by Type (2018-2023) & (K MT)
- Table 13. North America Nylon 6 Sales by Type (2018-2023) & (US$ Million)
- Table 14. Europe Nylon 6 Sales (K MT) by Type (2018-2023)
- Table 15. Europe Nylon 6 Sales by Type (2018-2023) & (US$ Million)
- Table 16. Asia-Pacific Nylon 6 Sales (K MT) by Type (2018-2023)
- Table 17. Asia-Pacific Nylon 6 Sales by Type (2018-2023) & (US$ Million)
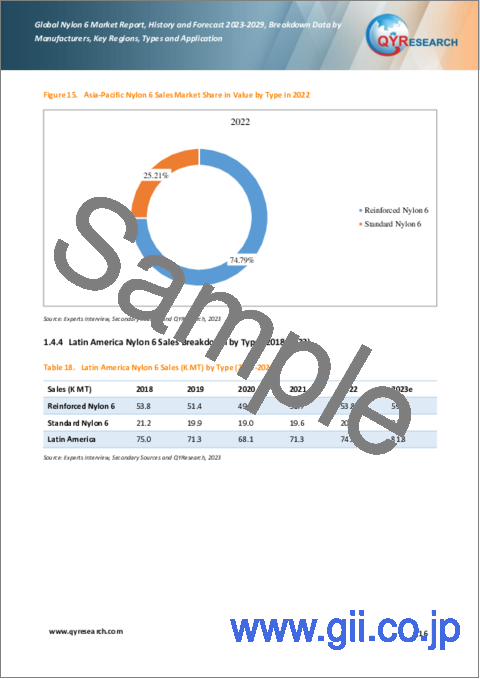
- Table 18. Latin America Nylon 6 Sales (K MT) by Type (2018-2023)
- Table 19. Latin America Nylon 6 Sales by Type (2018-2023) & (US$ Million)
- Table 20. Middle East and Africa Nylon 6 Sales (K MT) by Type (2018-2023)
- Table 21. Middle East and Africa Nylon 6 Sales by Type (2018-2023) & (US$ Million)
- Table 22. Global Nylon 6 Sales by Company (2018-2023) & (K MT)
- Table 23. Global Nylon 6 Sales Share by Company (2018-2023)
- Table 24. Global Nylon 6 Revenue by Company (2018-2023) & (US$ Million)
- Table 25. Global Nylon 6 Revenue Share by Company (2018-2023)
- Table 26. Global Market Nylon 6 Price by Company (2018-2023) & (USD/MT)
- Table 27. Global Nylon 6 Manufacturers Market Concentration Ratio (CR5 and HHI)
- Table 28. Global Top Manufacturers Market Share by Company Type (Tier 1, Tier 2, and Tier 3) & (based on the Revenue in Nylon 6 as of 2022)
- Table 29. Mergers & Acquisitions, Expansion Plans
- Table 30. Global Nylon 6 Market Size Comparison by Region (US$ Million): 2018 VS 2022 VS 2029
- Table 31. Global Nylon 6 Sales by Region (2018-2023) & (K MT)
- Table 32. Global Nylon 6 Sales Market Share in Volume by Region (2018-2023)
- Table 33. Global Nylon 6 Sales by Region (2018-2023) & (US$ Million)
- Table 34. Global Nylon 6 Sales Market Share in Value by Region (2018-2023)
- Table 35. Global Nylon 6 Sales Price (USD/MT) (2018-2023)
- Table 36. Global Nylon 6 Sales by Region (2024-2029) & (K MT)
- Table 37. Global Nylon 6 Sales Market Share in Volume by Region (2024-2029)
- Table 38. Global Nylon 6 Sales by Region (2024-2029) & (US$ Million)
- Table 39. Global Nylon 6 Sales Market Share in Value by Region (2024-2029)
- Table 40. Global Nylon 6 Sales Price (USD/MT) (2024-2029)
- Table 41. Global Nylon 6 Sales by Application: 2018 VS 2022 VS 2029 (US$ Million)
- Table 42. Global Nylon 6 Sales by Application (2018-2023) & (K MT)
- Table 43. Global Nylon 6 Sales Market Share in Volume by Application (2018-2023)
- Table 44. Global Nylon 6 Sales by Application (2018-2023) & (US$ Million)
- Table 45. Global Nylon 6 Sales Market Share in Value by Application (2018-2023)
- Table 46. Global Nylon 6 Price by Application (2018-2023) & (USD/MT)
- Table 47. Global Nylon 6 Sales by Application (2024-2029) & (K MT)
- Table 48. Global Nylon 6 Sales Market Share in Volume by Application (2024-2029)
- Table 49. Global Nylon 6 Sales by Application (2024-2029) & (US$ Million)
- Table 50. Global Nylon 6 Sales Market Share in Value by Application (2024-2029)
- Table 51. Global Nylon 6 Price by Application (2024-2029) & (USD/MT)
- Table 52. North America Nylon 6 Sales by Application (2018-2023) & (K MT)
- Table 53. North America Nylon 6 Sales by Application (2018-2023) & (US$ Million)
- Table 54. Europe Nylon 6 Sales (K MT) by Application (2018-2023)
- Table 55. Europe Nylon 6 Sales by Application (2018-2023) & (US$ Million)
- Table 56. Asia-Pacific Nylon 6 Sales (K MT) by Application (2018-2023)
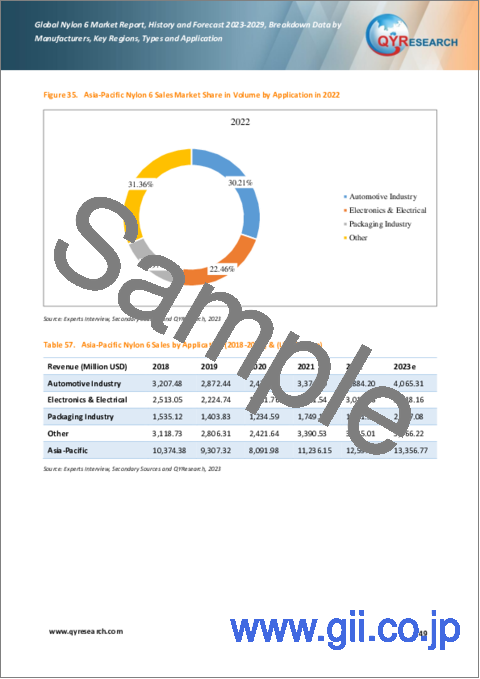
- Table 57. Asia-Pacific Nylon 6 Sales by Application (2018-2023) & (US$ Million)
- Table 58. Latin America Nylon 6 Sales (K MT) by Application (2018-2023)
- Table 59. Latin America Nylon 6 Sales by Application (2018-2023) & (US$ Million)
- Table 60. Middle East and Africa Nylon 6 Sales (K MT) by Application (2018-2023)
- Table 61. Middle East and Africa Nylon 6 Sales by Application (2018-2023) & (US$ Million)
- Table 62. North America Nylon 6 Market Size Growth Rate (CAGR) by Country (US$ Million): 2018 VS 2022 VS 2029
- Table 63. North America Nylon 6 Sales by Country (2018-2023) & (K MT)
- Table 64. North America Nylon 6 Sales Market Share in Volume by Country (2018-2023)
- Table 65. North America Nylon 6 Sales by Country (2018-2023) & (US$ Million)
- Table 66. North America Nylon 6 Sales Market Share in Value by Country (2018-2023)
- Table 67. North America Nylon 6 Sales by Country (2024-2029) & (K MT)
- Table 68. North America Nylon 6 Sales Market Share in Volume by Country (2024-2029)
- Table 69. North America Nylon 6 Sales by Country (2024-2029) & (US$ Million)
- Table 70. North America Nylon 6 Sales Market Share in Value by Country (2024-2029)
- Table 71. Europe Nylon 6 Market Size Growth Rate (CAGR) by Country (US$ Million): 2018 VS 2022 VS 2029
- Table 72. Europe Nylon 6 Sales by Country (2018-2023) & (K MT)
- Table 73. Europe Nylon 6 Sales Market Share in Volume by Country (2018-2023)
- Table 74. Europe Nylon 6 Sales by Country (2018-2023) & (US$ Million)
- Table 75. Europe Nylon 6 Sales Market Share in Value by Country (2018-2023)
- Table 76. Europe Nylon 6 Sales by Country (2024-2029) & (K MT)
- Table 77. Europe Nylon 6 Sales Market Share in Volume by Country (2024-2029)
- Table 78. Europe Nylon 6 Sales by Country (2024-2029) & (US$ Million)
- Table 79. Europe Nylon 6 Sales Market Share in Value by Country (2024-2029)
- Table 80. Asia-Pacific Nylon 6 Market Size Growth Rate (CAGR) by Region (US$ Million): 2018 VS 2022 VS 2029
- Table 81. Asia-Pacific Nylon 6 Sales by Region (2018-2023) & (K MT)
- Table 82. Asia-Pacific Nylon 6 Sales Market Share in Volume by Region (2018-2023)
- Table 83. Asia-Pacific Nylon 6 Sales by Region (2018-2023) & (US$ Million)
- Table 84. Asia-Pacific Nylon 6 Sales Market Share in Value by Region (2018-2023)
- Table 85. Asia-Pacific Nylon 6 Sales by Region (2024-2029) & (K MT)
- Table 86. Asia-Pacific Nylon 6 Sales Market Share in Volume by Region (2024-2029)
- Table 87. Asia-Pacific Nylon 6 Sales by Region (2024-2029) & (US$ Million)
- Table 88. Asia-Pacific Nylon 6 Sales Market Share in Value by Region (2024-2029)
- Table 89. Latin America Nylon 6 Market Size Growth Rate (CAGR) by Country (US$ Million): 2018 VS 2022 VS 2029
- Table 90. Latin America Nylon 6 Sales by Country (2018-2023) & (K MT)
- Table 91. Latin America Nylon 6 Sales Market Share in Volume by Country (2018-2023)
- Table 92. Latin America Nylon 6 Sales by Country (2018-2023) & (US$ Million)
- Table 93. Latin America Nylon 6 Sales Market Share in Value by Country (2018-2023)
- Table 94. Latin America Nylon 6 Sales by Country (2024-2029) & (K MT)
- Table 95. Latin America Nylon 6 Sales Market Share in Volume by Country (2024-2029)
- Table 96. Latin America Nylon 6 Sales by Country (2024-2029) & (US$ Million)
- Table 97. Latin America Nylon 6 Sales Market Share in Value by Country (2024-2029)
- Table 98. Middle East and Africa Nylon 6 Market Size Growth Rate (CAGR) by Country (US$ Million): 2018 VS 2022 VS 2029
- Table 99. Middle East and Africa Nylon 6 Sales by Country (2018-2023) & (K MT)
- Table 100. Middle East and Africa Nylon 6 Sales Market Share in Volume by Country (2018-2023)
- Table 101. Middle East and Africa Nylon 6 Sales by Country (2018-2023) & (US$ Million)
- Table 102. Middle East and Africa Nylon 6 Sales Market Share in Value by Country (2018-2023)
- Table 103. Middle East and Africa Nylon 6 Sales by Country (2024-2029) & (K MT)
- Table 104. Middle East and Africa Nylon 6 Sales Market Share by Country (2024-2029)
- Table 105. Middle East and Africa Nylon 6 Sales by Country (2024-2029) & (US$ Million)
- Table 106. Middle East and Africa Nylon 6 Sales Market Share in Value by Country (2024-2029)
- Table 107. BASF SE Company Information
- Table 108. BASF SE Introduction and Business Overview
- Table 109. BASF SE Nylon 6 Sales (K MT), Revenue (US$ Million), Price (USD/MT) and Gross Margin (2018-2023)
- Table 110. BASF SE Nylon 6 Product
- Table 111. BASF SE Recent Development
- Table 112. Advansix Company Information
- Table 113. Advansix Introduction and Business Overview
- Table 114. Advansix Nylon 6 Sales (K MT), Revenue (US$ Million), Price (USD/MT) and Gross Margin (2018-2023)
- Table 115. Advansix Nylon 6 Product
- Table 116. Advansix Recent Development
- Table 117. Royal DSM N.V Company Information
- Table 118. Royal DSM N.V Introduction and Business Overview
- Table 119. Royal DSM N.V Nylon 6 Sales (K MT), Revenue (US$ Million), Price (USD/MT) and Gross Margin (2018-2023)
- Table 120. Royal DSM N.V Nylon 6 Product
- Table 121. Royal DSM N.V Recent Development
- Table 122. Lanxess Company Information
- Table 123. Lanxess Introduction and Business Overview
- Table 124. Lanxess Nylon 6 Sales (K MT), Revenue (US$ Million), Price (USD/MT) and Gross Margin (2018-2023)
- Table 125. Lanxess Nylon 6 Product
- Table 126. Lanxess Recent Development
- Table 127. Clariant Corporation Company Information
- Table 128. Clariant Corporation Introduction and Business Overview
- Table 129. Clariant Corporation Nylon 6 Sales (K MT), Revenue (US$ Million), Price (USD/MT) and Gross Margin (2018-2023)
- Table 130. Clariant Corporation Nylon 6 Products
- Table 131. Unitika Company Information
- Table 132. Unitika Introduction and Business Overview
- Table 133. Unitika Nylon 6 Sales (K MT), Revenue (US$ Million), Price (USD/MT) and Gross Margin (2018-2023)
- Table 134. Unitika Nylon 6 Grade List
- Table 135. Unitika Recent Development
- Table 136. DOMO Chemicals Company Information
- Table 137. DOMO Chemicals Introduction and Business Overview
- Table 138. DOMO Chemicals Nylon 6 Sales (K MT), Revenue (US$ Million), Price (USD/MT) and Gross Margin (2018-2023)
- Table 139. DOMO Chemicals Nylon 6 Product
- Table 140. DOMO Chemicals Recent Development
- Table 141. Grupa Azoty Company Information
- Table 142. Grupa Azoty Introduction and Business Overview
- Table 143. Grupa Azoty Nylon 6 Sales (K MT), Revenue (US$ Million), Price (USD/MT) and Gross Margin (2018-2023)
- Table 144. Grupa Azoty Nylon 6 Product
- Table 145. Grupa Azoty Recent Development
- Table 146. LIBOLON Company Information
- Table 147. LIBOLON Introduction and Business Overview
- Table 148. LIBOLON Nylon 6 Sales (K MT), Revenue (US$ Million), Price (USD/MT) and Gross Margin (2018-2023)
- Table 149. LIBOLON Nylon 6 Product
- Table 150. LIBOLON Recent Development
- Table 151. Polymeric Resources Corporation (PRC) Company Information
- Table 152. Polymeric Resources Corporation (PRC) Introduction and Business Overview
- Table 153. Polymeric Resources Corporation (PRC) Nylon 6 Sales (K MT), Revenue (US$ Million), Price (USD/MT) and Gross Margin (2018-2023)
- Table 154. Polymeric Resources Corporation (PRC) Nylon 6 Product
- Table 155. UBE Company Information
- Table 156. UBE Introduction and Business Overview
- Table 157. UBE Nylon 6 Sales (K MT), Revenue (US$ Million), Price (USD/MT) and Gross Margin (2018-2023)
- Table 158. UBE Nylon 6 Product
- Table 159. UBE Recent Development
- Table 160. Ems-Grivory Company Information
- Table 161. Ems-Grivory Introduction and Business Overview
- Table 162. Ems-Grivory Nylon 6 Sales (K MT), Revenue (US$ Million), Price (USD/MT) and Gross Margin (2018-2023)
- Table 163. Ems-Grivory Nylon 6 Product
- Table 164. Shakespeare Company Information
- Table 165. Shakespeare Introduction and Business Overview
- Table 166. Shakespeare Nylon 6 Sales (K MT), Revenue (US$ Million), Price (USD/MT) and Gross Margin (2018-2023)
- Table 167. Shakespeare Nylon 6 Product
- Table 168. Shakespeare Recent Development
- Table 169. Key Raw Materials Lists
- Table 170. Raw Materials Key Suppliers Lists
- Table 171. Nylon 6 Market Trends
- Table 172. Nylon 6 Market Drivers
- Table 173. Nylon 6 Market Challenges
- Table 174. Nylon 6 Distributors List
- Table 175. Nylon 6 Downstream Customers
- Table 176. Nylon 6 Commercial Recycling Operations
- Table 177. Research Programs/Design for This Report
- Table 178. Key Data Information from Secondary Sources
- Table 179. Key Data Information from Primary Sources
- Table 180. QYR Business Unit and Senior & Team Lead Analysts
List of Figures
- Figure 1. Nylon 6 Product Picture
- Figure 2. Global Nylon 6 Market Size Status and Outlook (2018-2029) & (US$ Million)
- Figure 3. Global Nylon 6 Sales Status and Outlook (2018-2029) & (K MT)
- Figure 4. Product Picture of Standard Nylon 6
- Figure 5. Global Standard Nylon 6 Sales YoY Growth (2018-2029) & (K MT)
- Figure 6. Product Picture of Reinforced Nylon 6
- Figure 7. Global Reinforced Nylon 6 Sales YoY Growth (2018-2029) & (K MT)
- Figure 8. Global Nylon 6 Sales by Type (2018-2029) & (US$ Million)
- Figure 9. Global Nylon 6 Market Share by Type in 2022-2029
- Figure 10. North America Nylon 6 Sales Market Share in Volume by Type in 2022
- Figure 11. North America Nylon 6 Sales Market Share in Value by Type in 2022
- Figure 12. Europe Nylon 6 Sales Market Share in Volume by Type in 2022
- Figure 13. Europe Nylon 6 Sales Market Share in Value by Type in 2022
- Figure 14. Asia-Pacific Nylon 6 Sales Market Share in Volume by Type in 2022
- Figure 15. Asia-Pacific Nylon 6 Sales Market Share in Value by Type in 2022
- Figure 16. Latin America Nylon 6 Sales Market Share in Volume by Type in 2022
- Figure 17. Latin America Nylon 6 Sales Market Share in Value by Type in 2022
- Figure 18. Middle East and Africa Nylon 6 Sales Market Share in Volume by Type in 2022
- Figure 19. Middle East and Africa Nylon 6 Sales Market Share in Value by Type in 2022
- Figure 20. The 5 Largest Manufacturers in the World: Market Share by Nylon 6 Sales in 2022
- Figure 21. The 5 Largest Manufacturers in the World: Market Share by Nylon 6 Revenue in 2022
- Figure 22. Product Picture of Automotive Industry
- Figure 23. Global Automotive Industry Sales YoY Growth (2018-2029) & (K MT)
- Figure 24. Product Picture of Electronics & Electrical
- Figure 25. Global Electronics & Electrical Sales YoY Growth (2018-2029) & (K MT)
- Figure 26. Product Picture of Packaging Industry
- Figure 27. Global Packaging Industry Sales YoY Growth (2018-2029) & (K MT)
- Figure 28. Global Others Sales YoY Growth (2018-2029) & (K MT)
- Figure 29. Global Nylon 6 Sales by Application (2018-2029) & (US$ Million)
- Figure 30. Global Nylon 6 Market Share by Application in 2022-2029
- Figure 31. North America Nylon 6 Sales Market Share in Volume by Application in 2022
- Figure 32. North America Nylon 6 Sales Market Share in Value by Application in 2022
- Figure 33. Europe Nylon 6 Sales Market Share in Volume by Application in 2022
- Figure 34. Europe Nylon 6 Sales Market Share in Value by Application in 2022
- Figure 35. Asia-Pacific Nylon 6 Sales Market Share in Volume by Application in 2022
- Figure 36. Asia-Pacific Nylon 6 Sales Market Share in Value by Application in 2022
- Figure 37. Latin America Nylon 6 Sales Market Share in Volume by Application in 2022
- Figure 38. Latin America Nylon 6 Sales Market Share in Value by Application in 2022
- Figure 39. Middle East and Africa Nylon 6 Sales Market Share in Volume by Application in 2022
- Figure 40. Middle East and Africa Nylon 6 Sales Market Share in Value by Application in 2022
- Figure 41. Caprolactam Price Trend
- Figure 42. Nylon 6 Manufacturing Cost Structure
- Figure 43. Nylon 6 Industrial Chain Analysis
- Figure 44. Channels of Distribution
- Figure 45. Distributors Profiles
- Figure 46. Nylon 6-Recycled Flow Chart
- Figure 47. Nylon 6 Recycle Industrial Chain
- Figure 48. Bottom-up and Top-down Approaches for This Report
- Figure 49. Data Triangulation
- Figure 50. Key Executives Interviewed
Due to the COVID-19 pandemic and Russia-Ukraine War Influence, the global market for Nylon 6 resin has undergone significant change over the past few years. Base on the study, in 2022, the Global Nylon 6 market size was valued at 16967.94 Million USD, increased from 13985.75 Million USD in 2018, and the market is forecasted to reach 25203.94 Million USD by 2029, growing at CAGR of 5.73% between 2023 and 2029.
Report Scope
This report aims to provide a comprehensive presentation of the global market for Nylon 6, with both quantitative and qualitative analysis, to help readers develop business/growth strategies, assess the market competitive situation, analyze their position in the current marketplace, and make informed business decisions regarding Nylon 6.
The Nylon 6 market size, estimations, and forecasts are provided in terms of sales volume (K MT) and revenue ($ millions), considering 2022 as the base year, with history and forecast data for the period from 2018 to 2029. This report segments the global Nylon 6 market comprehensively. Regional market sizes, concerning products by Type, by Application, and by players, are also provided. The influence of COVID-19 and the Russia-Ukraine War were considered while estimating market sizes.
For a more in-depth understanding of the market, the report provides profiles of the competitive landscape, key competitors, and their respective market ranks. The report also discusses technological trends and new product developments.
This report will help the readers to understand the competition within the industries and strategies for the competitive environment to enhance the potential profit. The report also focuses on the competitive landscape of the global Nylon 6 market, and introduces in detail the market share, industry ranking, competitor ecosystem, market performance, new product development, operation situation, expansion, and acquisition. etc. of the main players, which helps the readers to identify the main competitors and deeply understand the competition pattern of the market.
Market Segmentation
This report covers the Nylon 6 segments by manufacturers, by Type, by Application, by region and country, and provides market size (value, volume and average price) and CAGR for the history and forecast period (2018-2022, 2023-2029), considering 2022 as the base year. It elucidates potential revenue opportunities across different segments and explains attractive investment proposition matrices for this market.
By Company
- BASF SE
- AdvanSix
- Royal DSM N.V
- Lanxess
- Clariant Corporation
- Unitika
- DOMO Chemicals
- Grupa Azoty
- LIBOLON
- Polymeric Resources Corporation (PRC)
- UBE
- Ems-Grivory
- Shakespeare
Segment by Type
- Standard Nylon 6
- Reinforced Nylon 6
Segment by Application
- Automotive Industry
- Electronics & Electrical
- Packaging Industry
- Others
By Region
- North America
- U.S.
- Canada
- Asia-Pacific
- China
- Japan
- South Korea
- India
- Australia
- Southeast Asia
- Europe
- Germany
- France
- U.K.
- Italy
- Russia
- Latin America
- Mexico
- Brazil
- Argentina
- Middle East & Africa
- Turkey
- Saudi Arabia
- U.A.E
Core Chapters
- Chapter One: Introduces the study scope of this report, executive summary of market segments by Type, market size segments for North America, Europe, Asia Pacific, Latin America, Middle East & Africa.
- Chapter Two: Detailed analysis of Nylon 6 manufacturers competitive landscape, price, sales, revenue, market share and ranking, latest development plan, merger, and acquisition information, etc.
- Chapter Three: Sales, revenue of Nylon 6 in regional level. It provides a quantitative analysis of the market size and development potential of each region and introduces the future development prospects, and market space in the world.
- Chapter Four: Introduces market segments by Application, market size segment for North America, Europe, Asia Pacific, Latin America, Middle East & Africa.
- Chapter Five, Six, Seven, Eight and Nine: North America, Europe, Asia Pacific, Latin America, Middle East & Africa, sales and revenue by country.
- Chapter Ten: Provides profiles of key players, introducing the basic situation of the main companies in the market in detail, including product sales, revenue, price, gross margin, product introduction, recent development, etc.
- Chapter Eleven: Analysis of industrial chain, key raw materials, manufacturing cost, and market dynamics. Introduces the market dynamics, latest developments of the market, the driving factors and restrictive factors of the market, the challenges and risks faced by manufacturers in the industry, and the analysis of relevant policies in the industry.
- Chapter Twelve: Analysis of sales channel, distributors and customers.
- Chapter Thirteen: Research Findings and Conclusion.
Table of Contents
1 Nylon 6 Market Overview
- 1.1 Nylon 6 Product Overview
- 1.2 Nylon 6 Market by Type
- 1.2.1 Standard Nylon 6
- 1.2.2 Reinforced Nylon 6
- 1.3 Global Nylon 6 Market Size by Type
- 1.3.1 Global Nylon 6 Market Size Overview by Type (2018-2029)
- 1.3.2 Global Nylon 6 Historic Market Size Review by Type (2018-2023)
- 1.3.3 Global Nylon 6 Forecasted Market Size by Type (2024-2029)
- 1.4 Key Regions Market Size by Type
- 1.4.1 North America Nylon 6 Sales Breakdown by Type (2018-2023)
- 1.4.2 Europe Nylon 6 Sales Breakdown by Type (2018-2023)
- 1.4.3 Asia-Pacific Nylon 6 Sales Breakdown by Type (2018-2023)
- 1.4.4 Latin America Nylon 6 Sales Breakdown by Type (2018-2023)
- 1.4.5 Middle East and Africa Nylon 6 Sales Breakdown by Type (2018-2023)
2 Nylon 6 Market Competition by Company
- 2.1 Global Top Players by Nylon 6 Sales (2018-2023)
- 2.2 Global Top Players by Nylon 6 Revenue (2018-2023)
- 2.3 Global Top Players by Nylon 6 Price (2018-2023)
- 2.4 Nylon 6 Market Competitive Situation and Trends
- 2.4.1 Nylon 6 Market Concentration Rate (2018-2023)
- 2.4.2 Global 5 Largest Manufacturers by Nylon 6 Sales and Revenue in 2022
- 2.5 Global Top Manufacturers by Company Type (Tier 1, Tier 2, and Tier 3) & (based on the Revenue in Nylon 6 as of 2022)
- 2.6 Mergers & Acquisitions, Expansion
3 Nylon 6 Status and Outlook by Region
- 3.1 Global Nylon 6 Market Size and CAGR by Region: 2018 VS 2022 VS 2029
- 3.2 Global Nylon 6 Historic Market Size by Region
- 3.2.1 Global Nylon 6 Sales in Volume by Region (2018-2023)
- 3.2.2 Global Nylon 6 Sales in Value by Region (2018-2023)
- 3.2.3 Global Nylon 6 Sales Price (2018-2023)
- 3.3 Global Nylon 6 Forecasted Market Size by Region
- 3.3.1 Global Nylon 6 Sales in Volume by Region (2024-2029)
- 3.3.2 Global Nylon 6 Sales in Value by Region (2024-2029)
- 3.3.3 Global Nylon 6 Sales Price (2024-2029)
4 Nylon 6 by Application
- 4.1 Nylon 6 Market by Application
- 4.1.1 Automotive Industry
- 4.1.2 Electronics & Electrical
- 4.1.3 Packaging Industry
- 4.1.4 Others
- 4.2 Global Nylon 6 Market Size by Application
- 4.2.1 Global Nylon 6 Market Size Overview by Application (2018-2029)
- 4.2.2 Global Nylon 6 Historic Market Size Review by Application (2018-2023)
- 4.2.3 Global Nylon 6 Forecasted Market Size by Application (2024-2029)
- 4.3 Key Regions Market Size by Application
- 4.3.1 North America Nylon 6 Sales Breakdown by Application (2018-2023)
- 4.3.2 Europe Nylon 6 Sales Breakdown by Application (2018-2023)
- 4.3.3 Asia-Pacific Nylon 6 Sales Breakdown by Application (2018-2023)
- 4.3.4 Latin America Nylon 6 Sales Breakdown by Application (2018-2023)
- 4.3.5 Middle East and Africa Nylon 6 Sales Breakdown by Application (2018-2023)
5 North America Nylon 6 by Country
- 5.1 North America Nylon 6 Historic Market Size by Country
- 5.1.1 North America Nylon 6 Market Size Growth Rate (CAGR) by Country: 2018 VS 2022 VS 2029
- 5.1.2 North America Nylon 6 Sales in Volume by Country (2018-2023)
- 5.1.3 North America Nylon 6 Sales in Value by Country (2018-2023)
- 5.2 North America Nylon 6 Forecasted Market Size by Country
- 5.2.1 North America Nylon 6 Sales in Volume by Country (2024-2029)
- 5.2.2 North America Nylon 6 Sales in Value by Country (2024-2029)
6 Europe Nylon 6 by Country
- 6.1 Europe Nylon 6 Historic Market Size by Country
- 6.1.1 Europe Nylon 6 Market Size Growth Rate (CAGR) by Country: 2018 VS 2022 VS 2029
- 6.1.2 Europe Nylon 6 Sales in Volume by Country (2018-2023)
- 6.1.3 Europe Nylon 6 Sales in Value by Country (2018-2023)
- 6.2 Europe Nylon 6 Forecasted Market Size by Country
- 6.2.1 Europe Nylon 6 Sales in Volume by Country (2024-2029)
- 6.2.2 Europe Nylon 6 Sales in Value by Country (2024-2029)
7 Asia-Pacific Nylon 6 by Region
- 7.1 Asia-Pacific Nylon 6 Historic Market Size by Region
- 7.1.1 Asia-Pacific Nylon 6 Market Size Growth Rate (CAGR) by Region: 2018 VS 2022 VS 2029
- 7.1.2 Asia-Pacific Nylon 6 Sales in Volume by Region (2018-2023)
- 7.1.3 Asia-Pacific Nylon 6 Sales in Value by Region (2018-2023)
- 7.2 Asia-Pacific Nylon 6 Forecasted Market Size by Region
- 7.2.1 Asia-Pacific Nylon 6 Sales in Volume by Region (2024-2029)
- 7.2.2 Asia-Pacific Nylon 6 Sales in Value by Region (2024-2029)
8 Latin America Nylon 6 by Country
- 8.1 Latin America Nylon 6 Historic Market Size by Country
- 8.1.1 Latin America Nylon 6 Market Size Growth Rate (CAGR) by Country: 2018 VS 2022 VS 2029
- 8.1.2 Latin America Nylon 6 Sales in Volume by Country (2018-2023)
- 8.1.3 Latin America Nylon 6 Sales in Value by Country (2018-2023)
- 8.2 Latin America Nylon 6 Forecasted Market Size by Country
- 8.2.1 Latin America Nylon 6 Sales in Volume by Country (2024-2029)
- 8.2.2 Latin America Nylon 6 Sales in Value by Country (2024-2029)
9 Middle East and Africa Nylon 6 by Country
- 9.1 Middle East and Africa Nylon 6 Historic Market Size by Country
- 9.1.1 Middle East and Africa Nylon 6 Market Size Growth Rate (CAGR) by Country: 2018 VS 2022 VS 2029
- 9.1.2 Middle East and Africa Nylon 6 Sales in Volume by Country (2018-2023)
- 9.1.3 Middle East and Africa Nylon 6 Sales in Value by Country (2018-2023)
- 9.2 Middle East and Africa Nylon 6 Forecasted Market Size by Country
- 9.2.1 Middle East and Africa Nylon 6 Sales in Volume by Country (2024-2029)
- 9.2.2 Middle East and Africa Nylon 6 Sales in Value by Country (2024-2029)
10 Company Profiles
- 10.1 BASF SE
- 10.1.1 BASF SE Company Information
- 10.1.2 BASF SE Introduction and Business Overview
- 10.1.3 BASF SE Nylon 6 Sales, Revenue and Gross Margin (2018-2023)
- 10.1.4 BASF SE Nylon 6 Products Offered
- 10.1.5 BASF SE Recent Development
- 10.2 Advansix
- 10.2.1 Advansix Company Information
- 10.2.2 Advansix Introduction and Business Overview
- 10.2.3 Advansix Nylon 6 Sales, Revenue and Gross Margin (2018-2023)
- 10.2.4 Advansix Nylon 6 Products Offered
- 10.2.5 Advansix Recent Development
- 10.3 Royal DSM N.V
- 10.3.1 Royal DSM N.V Company Information
- 10.3.2 Royal DSM N.V Introduction and Business Overview
- 10.3.3 Royal DSM N.V Nylon 6 Sales, Revenue and Gross Margin (2018-2023)
- 10.3.4 Royal DSM N.V Nylon 6 Products Offered
- 10.3.5 Royal DSM N.V Recent Development
- 10.4 Lanxess
- 10.4.1 Lanxess Company Information
- 10.4.2 Lanxess Introduction and Business Overview
- 10.4.3 Lanxess Nylon 6 Sales, Revenue and Gross Margin (2018-2023)
- 10.4.4 Lanxess Nylon 6 Products Offered
- 10.4.5 Lanxess Recent Development
- 10.5 Clariant Corporation
- 10.5.1 Clariant Corporation Company Information
- 10.5.2 Clariant Corporation Introduction and Business Overview
- 10.5.3 Clariant Corporation Nylon 6 Sales, Revenue and Gross Margin (2018-2023)
- 10.5.4 Clariant Corporation Nylon 6 Products Offered
- 10.6 Unitika
- 10.6.1 Unitika Company Information
- 10.6.2 Unitika Introduction and Business Overview
- 10.6.3 Unitika Nylon 6 Sales, Revenue and Gross Margin (2018-2023)
- 10.6.4 Unitika Nylon 6 Products Offered
- 10.6.5 Unitika Recent Development
- 10.7 DOMO Chemicals
- 10.7.1 DOMO Chemicals Company Information
- 10.7.2 DOMO Chemicals Introduction and Business Overview
- 10.7.3 DOMO Chemicals Nylon 6 Sales, Revenue and Gross Margin (2018-2023)
- 10.7.4 DOMO Chemicals Nylon 6 Products Offered
- 10.7.5 DOMO Chemicals Recent Development
- 10.8 Grupa Azoty
- 10.8.1 Grupa Azoty Company Information
- 10.8.2 Grupa Azoty Introduction and Business Overview
- 10.8.3 Grupa Azoty Nylon 6 Sales, Revenue and Gross Margin (2018-2023)
- 10.8.4 Grupa Azoty Nylon 6 Products Offered
- 10.8.5 Grupa Azoty Recent Development
- 10.9 LIBOLON
- 10.9.1 LIBOLON Company Information
- 10.9.2 LIBOLON Introduction and Business Overview
- 10.9.3 LIBOLON Nylon 6 Sales, Revenue and Gross Margin (2018-2023)
- 10.9.4 LIBOLON Nylon 6 Products Offered
- 10.9.5 LIBOLON Recent Development
- 10.10 Polymeric Resources Corporation (PRC)
- 10.10.1 Polymeric Resources Corporation (PRC) Company Information
- 10.10.2 Polymeric Resources Corporation (PRC) Introduction and Business Overview
- 10.10.3 Polymeric Resources Corporation (PRC) Nylon 6 Sales, Revenue and Gross Margin (2018-2023)
- 10.10.4 Polymeric Resources Corporation (PRC) Nylon 6 Products Offered
- 10.11 UBE
- 10.11.1 UBE Company Information
- 10.11.2 UBE Introduction and Business Overview
- 10.11.3 UBE Nylon 6 Sales, Revenue and Gross Margin (2018-2023)
- 10.11.4 UBE Nylon 6 Products Offered
- 10.11.5 UBE Recent Development
- 10.12 Ems-Grivory
- 10.12.1 Ems-Grivory Company Information
- 10.12.2 Ems-Grivory Introduction and Business Overview
- 10.12.3 Ems-Grivory Nylon 6 Sales, Revenue and Gross Margin (2018-2023)
- 10.12.4 Ems-Grivory Nylon 6 Products Offered
- 10.13 Shakespeare
- 10.13.1 Shakespeare Company Information
- 10.13.2 Shakespeare Introduction and Business Overview
- 10.13.3 Shakespeare Nylon 6 Sales, Revenue and Gross Margin (2018-2023)
- 10.13.4 Shakespeare Nylon 6 Products Offered
- 10.13.5 Shakespeare Recent Development
11 Upstream, Opportunities, Challenges, Risks and Influences Factors Analysis
- 11.1 Nylon 6 Key Raw Materials
- 11.1.1 Key Raw Materials
- 11.1.2 Key Raw Materials Price
- 11.1.3 Raw Materials Key Suppliers
- 11.2 Manufacturing Cost Structure
- 11.2.1 Raw Materials
- 11.2.2 Labor Cost
- 11.2.3 Manufacturing Expenses
- 11.3 Nylon 6 Industrial Chain Analysis
- 11.4 Nylon 6 Market Dynamics
- 11.4.1 Nylon 6 Industry Trends
- 11.4.2 Nylon 6 Market Drivers
- 11.4.3 Nylon 6 Market Challenges
- 11.4.4 Nylon 6 Market Restraints
12 Marketing Strategy Analysis, Distributors
- 12.1 Sales Channel
- 12.2 Nylon 6 Distributors
- 12.3 Nylon 6 Downstream Customers
13 Recycle Business of Nylon 6
- 13.1 Recycling Process of Nylon 6
- 13.2 Commercial Recycling Operations
- 13.3 Manufacturing Process
- 13.4 Recycle Industrial Chain Analysis
14 Research Findings and Conclusion
15 Appendix
- 15.1 Research Methodology
- 15.1.1 Methodology/Research Approach
- 15.1.2 Data Source
- 15.2 Author Details
- 15.3 Disclaimer