|
|
市場調査レポート
商品コード
1214607
大豆タンパク質分離物の世界市場の分析 (2023年)Global Soy Protein Isolate Market Research Report 2023 |
||||||
|
|
|||||||
|
● お客様のご希望に応じて、既存データの加工や未掲載情報(例:国別セグメント)の追加などの対応が可能です。 詳細はお問い合わせください。 |
|||||||


| 大豆タンパク質分離物の世界市場の分析 (2023年) |
|
出版日: 2023年02月10日
発行: QYResearch
ページ情報: 英文 136 Pages
納期: 2~3営業日
|
- 全表示
- 概要
- 図表
- 目次
世界の大豆タンパク質分離物の市場規模は、2022年に21億1,100万米ドル、2029年には26億300万米ドルに達すると予測され、予測期間中 (2023年~2029年) に3.24%のCAGRで成長する見通しです。
北米の大豆タンパク質分離物の市場規模は、2023年の4億5,500万米ドルから2029年には5億2,400万米ドルに増加し、予測期間中 (2023年~2029年) に2.37%のCAGRで成長する、と予測されます。
アジア太平洋の大豆タンパク質分離物の市場規模は、2023年の11億2,300万米ドルから2029年には14億1,900万米ドルに達する、予測期間中 (2023年~2029年) に3.98%のCAGRで成長する、と推定されます。
当レポートでは、世界の大豆タンパク質分離物の市場について分析し、種類別・用途別・地域別 (国別) の市場動向の見通し (2018年~2029年)、主要企業のプロファイルなどについて調査しております。
目次
第1章 大豆タンパク質分離物:市場概要
- 製品の定義
- 大豆タンパク質分離物市場:種類別
- 市場規模の比較:種類別 (金額ベース、2023年~2029年)
- ゲル化型
- インジェクション型
- 分散型
- その他
- 大豆タンパク質分離物市場:用途別
- 市場規模:用途別 (金額ベース、2023年~2029年)
- 肉製品
- 乳製品
- 小麦粉製品
- 飲料
- 世界の大豆タンパク質分離物市場の推定・予測
- 世界の大豆タンパク質分離物の収益 (2018年~2029年)
- 世界の大豆タンパク質分離物の販売 (2018年~2029年)
- 世界の大豆タンパク質分離物の平均市場価格 (2018年~2029年)
- 前提・制約条件
第2章 メーカー別の市場競争
- 世界の大豆タンパク質分離物の販売・市場シェア:メーカー別 (2018年~2023年)
- 世界の大豆タンパク質分離物の収益・市場シェア:メーカー別 (2018年~2023年)
- 世界の大豆タンパク質分離物の平均価格:メーカー別 (2018年~2023年)
- 世界の大豆タンパク質分離物の主要企業:業界ランキング (2021年・2022年)
- 大豆タンパク質分離物の主要メーカー:製造拠点・本社
- 大豆タンパク質分離物の主要メーカー:製品種類
- 大豆タンパク質分離物の主要メーカー:設立時期
- 世界の大豆タンパク質分離物市場:競争状況と動向
- メーカーの企業合併・買収 (M&A)、拡張計画
第3章 世界の大豆タンパク質分離物市場:地域別のシナリオ
- 世界の大豆タンパク質分離物の市場規模:地域別 (2018年・2022年・2029年)
- 世界の大豆タンパク質分離物の販売:地域別 (2018年~2029年)
- 販売:地域別 (2018年~2023年)
- 販売:地域別 (2024年~2029年)
- 世界の大豆タンパク質分離物の収益:地域別 (2018年~2029年)
- 収益:地域別 (2018年~2023年)
- 収益:地域別 (2024年~2029年)
- 北米の大豆タンパク質分離物市場:国別の詳細データ
- 米国
- カナダ
- 欧州の大豆タンパク質分離物市場:国別の詳細データ
- ドイツ
- フランス
- 英国
- イタリア
- ロシア
- アジア太平洋の大豆タンパク質分離物市場:地域別の詳細データ
- 中国
- 日本
- 韓国
- インド
- オーストラリア
- 東南アジア
- ラテンアメリカの大豆タンパク質分離物市場:国別の詳細データ
- メキシコ
- ブラジル
- 中東・アフリカの大豆タンパク質分離物市場:国別の詳細データ
- トルコ
- サウジアラビア
- アラブ首長国連邦
第4章 種類別のセグメント
- 大豆タンパク質分離物の販売:種類別 (2018年~2029年)
- 大豆タンパク質分離物の収益:種類別 (2018年~2029年)
- 大豆タンパク質分離物の価格:種類別 (2018年~2029年)
第5章 用途別のセグメント
- 大豆タンパク質分離物の販売:用途別 (2018年~2029年)
- 大豆タンパク質分離物の収益:用途別 (2018年~2029年)
- 大豆タンパク質分離物の価格:用途別 (2018年~2029年)
第6章 主要企業のプロファイル
- IFF
- 企業情報
- 企業・事業概要
- 販売・収益・粗利益 (2018年~2023年)
- 製品ポートフォリオ
- 近年の動向
- ADM
- FUJIOIL
- Solbar
- Yuwang Group
- Shansong Biological
- Gushen Biological
- Dezhou Ruikang
- Scents Holdings
- Sinoglory Health Food
- Goldensea
第7章 産業チェーンと販売チャネルの分析
- 大豆タンパク質分離物の産業チェーンの分析
- 大豆タンパク質分離物の主要原材料
- 大豆タンパク質分離物の製造モードとプロセス
- 大豆タンパク質分離物の販売とマーケティング
- 大豆タンパク質分離物の顧客
第8章 大豆タンパク質分離物の市場力学
- 大豆タンパク質分離物業界の動向
- 大豆タンパク質分離物市場の促進要因
- 大豆タンパク質分離物市場の課題
- 大豆タンパク質分離物市場の抑制要因
第9章 調査結果と結論
第10章 調査手法とデータソース
List of Tables
- Table 1. Global Soy Protein Isolate Market Value Comparison by Type (2023-2029) & (US$ Million)
- Table 2. Global Soy Protein Isolate Market Value by Application (2023-2029) & (US$ Million)
- Table 3. Global Soy Protein Isolate Market Competitive Situation by Manufacturers in 2022
- Table 4. Global Soy Protein Isolate Sales (K MT) of Key Manufacturers (2018-2023)
- Table 5. Global Soy Protein Isolate Sales Market Share by Manufacturers (2018-2023)
- Table 6. Global Soy Protein Isolate Revenue (US$ Million) by Manufacturers (2018-2023)
- Table 7. Global Soy Protein Isolate Revenue Share by Manufacturers (2018-2023)
- Table 8. Global Market Soy Protein Isolate Average Price (USD/MT) of Key Manufacturers (2018-2023)
- Table 9. Global Key Players of Soy Protein Isolate, Industry Ranking, 2021 VS 2022 (Million USD)
- Table 10. Global Key Manufacturers of Soy Protein Isolate, Manufacturing Sites & Headquarters
- Table 11. Global Key Manufacturers of Soy Protein Isolate, Product Type
- Table 12. Founded Date Global Key Soy Protein Isolate Manufacturers
- Table 13. Global Manufacturers Market Concentration Ratio (CR5 and HHI)
- Table 14. Global Soy Protein Isolate by Company Type (Tier 1, Tier 2, and Tier 3) & (based on the Revenue in Soy Protein Isolate as of 2022)
- Table 15. Manufacturers Mergers & Acquisitions, Expansion Plans
- Table 16. Global Soy Protein Isolate Market Size by Region (US$ Million): 2018 VS 2022 VS 2029
- Table 17. Global Soy Protein Isolate Sales by Region (2018-2023) & (K MT)
- Table 18. Global Soy Protein Isolate Sales Market Share by Region (2018-2023)
- Table 19. Global Soy Protein Isolate Sales by Region (2024-2029) & (K MT)
- Table 20. Global Soy Protein Isolate Sales Market Share by Region (2024-2029)
- Table 21. Global Soy Protein Isolate Revenue by Region (2018-2023) & (US$ Million)
- Table 22. Global Soy Protein Isolate Revenue Market Share by Region (2018-2023)
- Table 23. Global Soy Protein Isolate Revenue by Region (2024-2029) & (US$ Million)
- Table 24. Global Soy Protein Isolate Revenue Market Share by Region (2024-2029)
- Table 25. North America Soy Protein Isolate Revenue by Country: 2018 VS 2022 VS 2029 (US$ Million)
- Table 26. North America Soy Protein Isolate Sales by Country (2018-2023) & (K MT)
- Table 27. North America Soy Protein Isolate Sales by Country (2024-2029) & (K MT)
- Table 28. North America Soy Protein Isolate Revenue by Country (2018-2023) & (US$ Million)
- Table 29. North America Soy Protein Isolate Revenue by Country (2024-2029) & (US$ Million)
- Table 30. Europe Soy Protein Isolate Revenue by Country: 2018 VS 2022 VS 2029 (US$ Million)
- Table 31. Europe Soy Protein Isolate Sales by Country (2018-2023) & (K MT)
- Table 32. Europe Soy Protein Isolate Sales by Country (2024-2029) & (K MT)
- Table 33. Europe Soy Protein Isolate Revenue by Country (2018-2023) & (US$ Million)
- Table 34. Europe Soy Protein Isolate Revenue by Country (2024-2029) & (US$ Million)
- Table 35. Asia Pacific Soy Protein Isolate Revenue by Region: 2018 VS 2022 VS 2029 (US$ Million)
- Table 36. Asia Pacific Soy Protein Isolate Sales by Region (2018-2023) & (K MT)
- Table 37. Asia Pacific Soy Protein Isolate Sales by Region (2024-2029) & (K MT)
- Table 38. Asia Pacific Soy Protein Isolate Revenue by Region (2018-2023) & (US$ Million)
- Table 39. Asia Pacific Soy Protein Isolate Revenue by Region (2024-2029) & (US$ Million)
- Table 40. Latin America Soy Protein Isolate Revenue by Country: 2018 VS 2022 VS 2029 (US$ Million)
- Table 41. Latin America Soy Protein Isolate Sales by Country (2018-2023) & (K MT)
- Table 42. Latin America Soy Protein Isolate Sales by Country (2024-2029) & (K MT)
- Table 43. Latin America Soy Protein Isolate Revenue by Country (2018-2023) & (US$ Million)
- Table 44. Latin America Soy Protein Isolate Revenue Market Share by Country (2018-2023)
- Table 45. Middle East and Africa Soy Protein Isolate Revenue by Country: 2018 VS 2022 VS 2029 (US$ Million)
- Table 46. Middle East and Africa Soy Protein Isolate Sales by Country (2018-2023) & (K MT)
- Table 47. Middle East and Africa Soy Protein Isolate Sales by Country (2024-2029) & (K MT)
- Table 48. Middle East and Africa Soy Protein Isolate Revenue by Country (2018-2023) & (US$ Million)
- Table 49. Middle East and Africa Soy Protein Isolate Revenue by Country (2024-2029) & (US$ Million)
- Table 50. Global Soy Protein Isolate Sales (K MT) by Type (2018-2023)
- Table 51. Global Soy Protein Isolate Sales (K MT) by Type (2024-2029)
- Table 52. Global Soy Protein Isolate Sales Market Share by Type (2018-2023)
- Table 53. Global Soy Protein Isolate Sales Market Share by Type (2024-2029)
- Table 54. Global Soy Protein Isolate Revenue (US$ Million) by Type (2018-2023)
- Table 55. Global Soy Protein Isolate Revenue (US$ Million) by Type (2024-2029)
- Table 56. Global Soy Protein Isolate Revenue Market Share by Type (2018-2023)
- Table 57. Global Soy Protein Isolate Revenue Market Share by Type (2024-2029)
- Table 58. Global Soy Protein Isolate Price (USD/MT) by Type (2018-2023)
- Table 59. Global Soy Protein Isolate Price (USD/MT) by Type (2024-2029)
- Table 60. Global Soy Protein Isolate Sales (K MT) by Application (2018-2023)
- Table 61. Global Soy Protein Isolate Sales (K MT) by Application (2024-2029)
- Table 62. Global Soy Protein Isolate Sales Market Share by Application (2018-2023)
- Table 63. Global Soy Protein Isolate Sales Market Share by Application (2024-2029)
- Table 64. Global Soy Protein Isolate Revenue (US$ Million) by Application (2018-2023)
- Table 65. Global Soy Protein Isolate Revenue (US$ Million) by Application (2024-2029)
- Table 66. Global Soy Protein Isolate Revenue Market Share by Application (2018-2023)
- Table 67. Global Soy Protein Isolate Revenue Market Share by Application (2024-2029)
- Table 68. Global Soy Protein Isolate Price (USD/MT) by Application (2018-2023)
- Table 69. Global Soy Protein Isolate Price (USD/MT) by Application (2024-2029)
- Table 70. IFF Company Information
- Table 71. IFF Description and Business Overview
- Table 72. IFF Soy Protein Isolate Sales (K MT), Revenue (US$ Million), Price (USD/MT) and Gross Margin (2018-2023)
- Table 73. IFF Soy Protein Isolate Product
- Table 74. IFF Recent Developments/Updates
- Table 75. ADM Company Information
- Table 76. ADM Description and Business Overview
- Table 77. ADM Soy Protein Isolate Sales (K MT), Revenue (US$ Million), Price (USD/MT) and Gross Margin (2018-2023)
- Table 78. ADM Soy Protein Isolate Product
- Table 79. FUJIOIL Company Information
- Table 80. FUJIOIL Description and Business Overview
- Table 81. FUJIOIL Soy Protein Isolate Sales (K MT), Revenue (US$ Million), Price (USD/MT) and Gross Margin (2018-2023)
- Table 82. FUJIOIL Soy Protein Isolate Product
- Table 83. Solbar Company Information
- Table 84. Solbar Description and Business Overview
- Table 85. Solbar Soy Protein Isolate Sales (K MT), Revenue (US$ Million), Price (USD/MT) and Gross Margin (2018-2023)
- Table 86. Solbar Soy Protein Isolate Product
- Table 87. Yuwang Group Company Information
- Table 88. Yuwang Group Description and Business Overview
- Table 89. Yuwang Group Soy Protein Isolate Sales (K MT), Revenue (US$ Million), Price (USD/MT) and Gross Margin (2018-2023)
- Table 90. Yuwang Group Soy Protein Isolate Product
- Table 91. Shansong Biological Company Information
- Table 92. Shansong Biological Description and Business Overview
- Table 93. Shansong Biological Soy Protein Isolate Sales (K MT), Revenue (US$ Million), Price (USD/MT) and Gross Margin (2018-2023)
- Table 94. Shansong Biological Soy Protein Isolate Product
- Table 95. Gushen Biological Company Information
- Table 96. Gushen Biological Description and Business Overview
- Table 97. Gushen Biological Soy Protein Isolate Sales (K MT), Revenue (US$ Million), Price (USD/MT) and Gross Margin (2018-2023)
- Table 98. Gushen Biological Soy Protein Isolate Product
- Table 99. Dezhou Ruikang Company Information
- Table 100. Dezhou Ruikang Description and Business Overview
- Table 101. Dezhou Ruikang Soy Protein Isolate Sales (K MT), Revenue (US$ Million), Price (USD/MT) and Gross Margin (2018-2023)
- Table 102. Dezhou Ruikang Soy Protein Isolate Product
- Table 103. Scents Holdings Company Information
- Table 104. Scents Holdings Description and Business Overview
- Table 105. Scents Holdings Soy Protein Isolate Sales (K MT), Revenue (US$ Million), Price (USD/MT) and Gross Margin (2018-2023)
- Table 106. Scents Holdings Soy Protein Isolate Product
- Table 107. Sinoglory Health Food Company Information
- Table 108. Sinoglory Health Food Description and Business Overview
- Table 109. Sinoglory Health Food Soy Protein Isolate Sales (K MT), Revenue (US$ Million), Price (USD/MT) and Gross Margin (2018-2023)
- Table 110. Sinoglory Health Food Soy Protein Isolate Product
- Table 111. Goldensea Company Information
- Table 112. Goldensea Description and Business Overview
- Table 113. Goldensea Soy Protein Isolate Sales (K MT), Revenue (US$ Million), Price (USD/MT) and Gross Margin (2018-2023)
- Table 114. Goldensea Soy Protein Isolate Product
- Table 115. Key Raw Materials Lists
- Table 116. Raw Materials Key Suppliers Lists
- Table 117. Soy Protein Isolate Distributors List
- Table 118. Soy Protein Isolate Customers List
- Table 119. Soy Protein Isolate Market Trends
- Table 120. Soy Protein Isolate Market Drivers
- Table 121. Soy Protein Isolate Market Challenges
- Table 122. Soy Protein Isolate Market Restraints
- Table 123. Research Programs/Design for This Report
- Table 124. Key Data Information from Secondary Sources
- Table 125. Key Data Information from Primary Sources
- Table 126. Authors List of This Report
- Table 127. QYR Business Unit and Senior & Team Lead Analysts
List of Figures
- Figure 1. Product Picture of Soy Protein Isolate
- Figure 2. Global Soy Protein Isolate Market Value Comparison by Type (2023-2029) & (US$ Million)
- Figure 3. Global Soy Protein Isolate Market Share by Type: 2022 & 2029
- Figure 4. Gelation Type Product Picture
- Figure 5. Injection Type Product Picture
- Figure 6. Dispersion Type Product Picture
- Figure 7. Global Soy Protein Isolate Market Value by Application (2023-2029) & (US$ Million)
- Figure 8. Global Soy Protein Isolate Market Share by Application: 2022 & 2029
- Figure 9. Meat products
- Figure 10. Dairy products
- Figure 11. Flour products
- Figure 12. Beverage
- Figure 13. Global Soy Protein Isolate Revenue, (US$ Million), 2018 VS 2022 VS 2029
- Figure 14. Global Soy Protein Isolate Market Size (2018-2029) & (US$ Million)
- Figure 15. Global Soy Protein Isolate Sales (2018-2029) & (K MT)
- Figure 16. Global Soy Protein Isolate Average Price (USD/MT) & (2018-2029)
- Figure 17. Soy Protein Isolate Report Years Considered
- Figure 18. Soy Protein Isolate Sales Share by Manufacturers in 2022
- Figure 19. Global Soy Protein Isolate Revenue Share by Manufacturers in 2022
- Figure 20. Global 5 and 10 Largest Soy Protein Isolate Players: Market Share by Revenue in Soy Protein Isolate in 2022
- Figure 21. Global Soy Protein Isolate Market Size by Region (US$ Million): 2018 VS 2022 VS 2029
- Figure 22. North America Soy Protein Isolate Sales Market Share by Country (2018-2029)
- Figure 23. North America Soy Protein Isolate Revenue Market Share by Country (2018-2029)
- Figure 24. U.S. Soy Protein Isolate Revenue Growth Rate (2018-2029) & (US$ Million)
- Figure 25. Canada Soy Protein Isolate Revenue Growth Rate (2018-2029) & (US$ Million)
- Figure 26. Europe Soy Protein Isolate Sales Market Share by Country (2018-2029)
- Figure 27. Europe Soy Protein Isolate Revenue Market Share by Country (2018-2029)
- Figure 28. Germany Soy Protein Isolate Revenue Growth Rate (2018-2029) & (US$ Million)
- Figure 29. France Soy Protein Isolate Revenue Growth Rate (2018-2029) & (US$ Million)
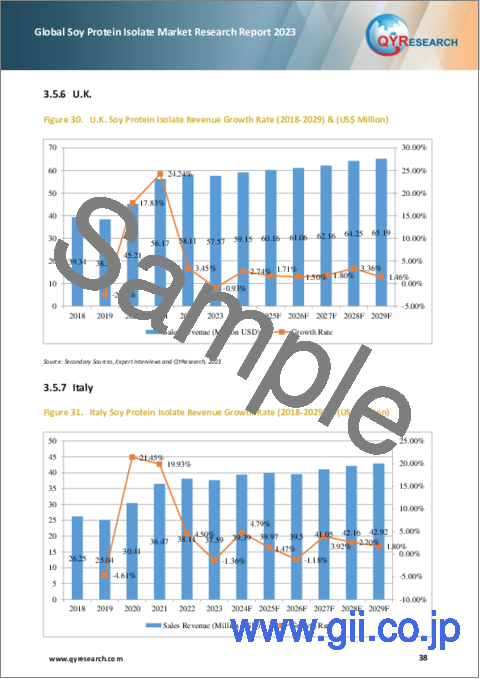
- Figure 30. U.K. Soy Protein Isolate Revenue Growth Rate (2018-2029) & (US$ Million)
- Figure 31. Italy Soy Protein Isolate Revenue Growth Rate (2018-2029) & (US$ Million)
- Figure 32. Russia Soy Protein Isolate Revenue Growth Rate (2018-2029) & (US$ Million)
- Figure 33. Asia Pacific Soy Protein Isolate Sales Market Share by Region (2018-2029)
- Figure 34. Asia Pacific Soy Protein Isolate Revenue Market Share by Region (2018-2029)
- Figure 35. China Soy Protein Isolate Revenue Growth Rate (2018-2029) & (US$ Million)
- Figure 36. Japan Soy Protein Isolate Revenue Growth Rate (2018-2029) & (US$ Million)
- Figure 37. South Korea Soy Protein Isolate Revenue Growth Rate (2018-2029) & (US$ Million)
- Figure 38. India Soy Protein Isolate Revenue Growth Rate (2018-2029) & (US$ Million)
- Figure 39. Australia Soy Protein Isolate Revenue Growth Rate (2018-2029) & (US$ Million)
- Figure 40. Southeast Asia Soy Protein Isolate Revenue Growth Rate (2018-2029) & (US$ Million)
- Figure 41. Latin America Soy Protein Isolate Sales Market Share by Country (2018-2029)
- Figure 42. Mexico Soy Protein Isolate Revenue Growth Rate (2018-2029) & (US$ Million)
- Figure 43. Brazil Soy Protein Isolate Revenue Growth Rate (2018-2029) & (US$ Million)
- Figure 44. Middle East and Africa Soy Protein Isolate Sales Market Share by Country (2018-2029)
- Figure 45. Middle East and Africa Soy Protein Isolate Revenue Market Share by Country (2018-2029)
- Figure 46. Turkey Soy Protein Isolate Revenue Growth Rate (2018-2029) & (US$ Million)
- Figure 47. Saudi Arabia Soy Protein Isolate Revenue Growth Rate (2018-2029) & (US$ Million)
- Figure 48. UAE Soy Protein Isolate Revenue Growth Rate (2018-2029) & (US$ Million)
- Figure 49. Global Sales Market Share of Soy Protein Isolate by Type (2018-2029)
- Figure 50. Global Revenue Market Share of Soy Protein Isolate by Type (2018-2029)
- Figure 51. Global Sales Market Share of Soy Protein Isolate by Application (2018-2029)
- Figure 52. Global Revenue Market Share of Soy Protein Isolate by Application (2018-2029)
- Figure 53. Soy Protein Isolate Value Chain
- Figure 54. Soy Protein Isolate Production Process
- Figure 55. Channels of Distribution
- Figure 56. Distributors Profiles
- Figure 57. Bottom-up and Top-down Approaches for This Report
- Figure 58. Data Triangulation
- Figure 59. Key Executives Interviewed
The global Soy Protein Isolate market was valued at US$ 2111 million in 2022 and is anticipated to reach US$ 2603 million by 2029, witnessing a CAGR of 3.24% during the forecast period 2023-2029. The influence of COVID-19 and the Russia-Ukraine War were considered while estimating market sizes.
North American market for Soy Protein Isolate is estimated to increase from $ 455 million in 2023 to reach $ 524 million by 2029, at a CAGR of 2.37% during the forecast period of 2023 through 2029.
Asia-Pacific market for Soy Protein Isolate is estimated to increase from $ 1123 million in 2023 to reach $ 1419 million by 2029, at a CAGR of 3.98% during the forecast period of 2023 through 2029.
The major global manufacturers of Soy Protein Isolate include: IFF, ADM, FUJIOIL, Yuwang Group, Shansong Biological, Gushen Biological, Dezhou Ruikang, and Scents Holdings, etc. In 2022, the world's top five vendors accounted for approximately 62.08% of the revenue.
Report Scope
This report aims to provide a comprehensive presentation of the global market for Soy Protein Isolate, with both quantitative and qualitative analysis, to help readers develop business/growth strategies, assess the market competitive situation, analyze their position in the current marketplace, and make informed business decisions regarding Soy Protein Isolate.
The Soy Protein Isolate market size, estimations, and forecasts are provided in terms of sales volume (K MT) and revenue ($ millions), considering 2021 as the base year, with history and forecast data for the period from 2017 to 2028. This report segments the global Soy Protein Isolate market comprehensively. Regional market sizes, concerning products by Type, by Application, and by players, are also provided.
For a more in-depth understanding of the market, the report provides profiles of the competitive landscape, key competitors, and their respective market ranks. The report also discusses technological trends and new product developments.
The report will help the Soy Protein Isolate manufacturers, new entrants, and industry chain related companies in this market with information on the revenues, sales volume, and average price for the overall market and the sub-segments across the different segments, by company, by Type, by Application, and by regions.
By Company
- IFF
- ADM
- FUJIOIL
- Solbar
- Yuwang Group
- Shansong Biological
- Gushen Biological
- Dezhou Ruikang
- Scents Holdings
- Sinoglory Health Food
- Goldensea
Segment by Type
- Gelation Type
- Injection Type
- Dispersion Type
- Others
Segment by Application
- Meat products
- Dairy products
- Flour products
- Beverage
- Others
Consumption by Region
- North America
- U.S.
- Canada
- Asia-Pacific
- China
- Japan
- Korea
- India
- Southeast Asia
- Australia
- Europe
- Germany
- France
- U.K.
- Italy
- Russia
- Rest of Europe
- Latin America
- Mexico
- Brazil
- Rest of Latin America
Core Chapters
- Chapter 1: Introduces the report scope of the report, executive summary of different market segments (by region, product type, application, etc), including the market size of each market segment, future development potential, and so on. It offers a high-level view of the current state of the market and its likely evolution in the short to mid-term, and long term.
- Chapter 2: Detailed analysis of Soy Protein Isolate manufacturers competitive landscape, price, sales and revenue market share, latest development plan, merger, and acquisition information, etc.
- Chapter 3: Sales, revenue of Soy Protein Isolate in regional level and country level. It provides a quantitative analysis of the market size and development potential of each region and its main countries and introduces the market development, future development prospects, market space, and market size of each country in the world.
- Chapter 4: Provides the analysis of various market segments by Type, covering the market size and development potential of each market segment, to help readers find the blue ocean market in different market segments.
- Chapter 5: Provides the analysis of various market segments by Application, covering the market size and development potential of each market segment, to help readers find the blue ocean market in different downstream markets.
- Chapter 6: Provides profiles of key players, introducing the basic situation of the main companies in the market in detail, including product sales, revenue, price, gross margin, product introduction, recent development, etc.
- Chapter 7: Analysis of industrial chain, including the upstream and downstream of the industry.
- Chapter 8: Introduces the market dynamics, latest developments of the market, the driving factors and restrictive factors of the market, the challenges and risks faced by manufacturers in the industry, and the analysis of relevant policies in the industry.
- Chapter 9: The main points and conclusions of the report.
Table of Contents
1 Soy Protein Isolate Market Overview
- 1.1 Product Definition
- 1.2 Soy Protein Isolate by Type
- 1.2.1 Global Soy Protein Isolate Market Value Comparison by Type (2023-2029)
- 1.2.2 Gelation Type
- 1.2.3 Injection Type
- 1.2.4 Dispersion Type
- 1.2.5 Others
- 1.3 Soy Protein Isolate by Application
- 1.3.1 Global Soy Protein Isolate Market Value by Application (2023-2029)
- 1.3.2 Meat products
- 1.3.3 Dairy products
- 1.3.4 Flour products
- 1.3.5 Beverage
- 1.4 Global Soy Protein Isolate Market Size Estimates and Forecasts
- 1.4.1 Global Soy Protein Isolate Revenue 2018-2029
- 1.4.2 Global Soy Protein Isolate Sales 2018-2029
- 1.4.3 Global Soy Protein Isolate Market Average Price (2018-2029)
- 1.5 Assumptions and Limitations
2 Soy Protein Isolate Market Competition by Manufacturers
- 2.1 Global Soy Protein Isolate Sales Market Share by Manufacturers (2018-2023)
- 2.2 Global Soy Protein Isolate Revenue Market Share by Manufacturers (2018-2023)
- 2.3 Global Soy Protein Isolate Average Price by Manufacturers (2018-2023)
- 2.4 Global Key Players of Soy Protein Isolate, Industry Ranking, 2021 VS 2022
- 2.5 Global Key Manufacturers of Soy Protein Isolate, Manufacturing Sites & Headquarters
- 2.6 Global Key Manufacturers of Soy Protein Isolate, Product Type
- 2.7 Founded Date Global Key Soy Protein Isolate Manufacturers
- 2.8 Global Soy Protein Isolate Market Competitive Situation and Trends
- 2.8.1 Global Soy Protein Isolate Market Concentration Rate
- 2.8.2 The Global 5 and 10 Largest Soy Protein Isolate Players Market Share by Revenue
- 2.8.3 Global Soy Protein Isolate by Company Type (Tier 1, Tier 2, and Tier 3)
- 2.9 Manufacturers Mergers & Acquisitions, Expansion Plans
3 Global Soy Protein Isolate Market Scenario by Region
- 3.1 Global Soy Protein Isolate Market Size by Region: 2018 Versus 2022 Versus 2029
- 3.2 Global Soy Protein Isolate Sales by Region: 2018-2029
- 3.2.1 Global Soy Protein Isolate Sales by Region: 2018-2023
- 3.2.2 Global Soy Protein Isolate Sales by Region: 2024-2029
- 3.3 Global Soy Protein Isolate Revenue by Region: 2018-2029
- 3.3.1 Global Soy Protein Isolate Revenue by Region: 2018-2023
- 3.3.2 Global Soy Protein Isolate Revenue by Region: 2024-2029
- 3.4 North America Soy Protein Isolate Market Facts & Figures by Country
- 3.4.1 North America Soy Protein Isolate Market Size by Country: 2018 VS 2022 VS 2029
- 3.4.2 North America Soy Protein Isolate Sales by Country (2018-2029)
- 3.4.3 North America Soy Protein Isolate Revenue by Country (2018-2029)
- 3.4.4 U.S.
- 3.4.5 Canada
- 3.5 Europe Soy Protein Isolate Market Facts & Figures by Country
- 3.5.1 Europe Soy Protein Isolate Market Size by Country: 2018 VS 2022 VS 2029
- 3.5.2 Europe Soy Protein Isolate Sales by Country (2018-2029)
- 3.5.3 Europe Soy Protein Isolate Revenue by Country (2018-2029)
- 3.5.4 Germany
- 3.5.5 France
- 3.5.6 U.K.
- 3.5.7 Italy
- 3.5.8 Russia
- 3.6 Asia Pacific Soy Protein Isolate Market Facts & Figures by Region
- 3.6.1 Asia Pacific Soy Protein Isolate Market Size by Region: 2018 VS 2022 VS 2029
- 3.6.2 Asia Pacific Soy Protein Isolate Sales by Region (2018-2029)
- 3.6.3 Asia Pacific Soy Protein Isolate Revenue by Region (2018-2029)
- 3.6.4 China
- 3.6.5 Japan
- 3.6.6 South Korea
- 3.6.7 India
- 3.6.8 Australia
- 3.6.9 Southeast Asia
- 3.7 Latin America Soy Protein Isolate Market Facts & Figures by Country
- 3.7.1 Latin America Soy Protein Isolate Market Size by Country: 2018 VS 2022 VS 2029
- 3.7.2 Latin America Soy Protein Isolate Sales by Country (2018-2029)
- 3.7.3 Latin America Soy Protein Isolate Revenue by Country
- 3.7.4 Mexico
- 3.7.5 Brazil
- 3.8 Middle East and Africa Soy Protein Isolate Market Facts & Figures by Country
- 3.8.1 Middle East and Africa Soy Protein Isolate Market Size by Country: 2018 VS 2022 VS 2029
- 3.8.2 Middle East and Africa Soy Protein Isolate Sales by Country (2018-2029)
- 3.8.3 Middle East and Africa Soy Protein Isolate Revenue by Country
- 3.8.4 Turkey
- 3.8.5 Saudi Arabia
- 3.8.6 UAE
4 Segment by Type
- 4.1 Global Soy Protein Isolate Sales by Type (2018-2029)
- 4.1.1 Global Soy Protein Isolate Sales by Type (2018-2023)
- 4.1.2 Global Soy Protein Isolate Sales by Type (2024-2029)
- 4.1.3 Global Soy Protein Isolate Sales Market Share by Type (2018-2029)
- 4.2 Global Soy Protein Isolate Revenue by Type (2018-2029)
- 4.2.1 Global Soy Protein Isolate Revenue by Type (2018-2023)
- 4.2.2 Global Soy Protein Isolate Revenue by Type (2024-2029)
- 4.2.3 Global Soy Protein Isolate Revenue Market Share by Type (2018-2029)
- 4.3 Global Soy Protein Isolate Price by Type (2018-2029)
5 Segment by Application
- 5.1 Global Soy Protein Isolate Sales by Application (2018-2029)
- 5.1.1 Global Soy Protein Isolate Sales by Application (2018-2023)
- 5.1.2 Global Soy Protein Isolate Sales by Application (2024-2029)
- 5.1.3 Global Soy Protein Isolate Sales Market Share by Application (2018-2029)
- 5.2 Global Soy Protein Isolate Revenue by Application (2018-2029)
- 5.2.1 Global Soy Protein Isolate Revenue by Application (2018-2023)
- 5.2.2 Global Soy Protein Isolate Revenue by Application (2024-2029)
- 5.2.3 Global Soy Protein Isolate Revenue Market Share by Application (2018-2029)
- 5.3 Global Soy Protein Isolate Price by Application (2018-2029)
6 Key Companies Profiled
- 6.1 IFF
- 6.1.1 IFF Company Information
- 6.1.2 IFF Description and Business Overview
- 6.1.3 IFF Soy Protein Isolate Sales, Revenue and Gross Margin (2018-2023)
- 6.1.4 IFF Soy Protein Isolate Product Portfolio
- 6.1.5 IFF Recent Developments/Updates
- 6.2 ADM
- 6.2.1 ADM Company Information
- 6.2.2 ADM Description and Business Overview
- 6.2.3 ADM Soy Protein Isolate Sales, Revenue and Gross Margin (2018-2023)
- 6.2.4 ADM Soy Protein Isolate Product Portfolio
- 6.3 FUJIOIL
- 6.3.1 FUJIOIL Company Information
- 6.3.2 FUJIOIL Description and Business Overview
- 6.3.3 FUJIOIL Soy Protein Isolate Sales, Revenue and Gross Margin (2018-2023)
- 6.3.4 FUJIOIL Soy Protein Isolate Product Portfolio
- 6.4 Solbar
- 6.4.1 Solbar Company Information
- 6.4.2 Solbar Description and Business Overview
- 6.4.3 Solbar Soy Protein Isolate Sales, Revenue and Gross Margin (2018-2023)
- 6.4.4 Solbar Soy Protein Isolate Product Portfolio
- 6.5 Yuwang Group
- 6.5.1 Yuwang Group Company Information
- 6.5.2 Yuwang Group Description and Business Overview
- 6.5.3 Yuwang Group Soy Protein Isolate Sales, Revenue and Gross Margin (2018-2023)
- 6.5.4 Yuwang Group Soy Protein Isolate Product Portfolio
- 6.6 Shansong Biological
- 6.6.1 Shansong Biological Company Information
- 6.6.2 Shansong Biological Description and Business Overview
- 6.6.3 Shansong Biological Soy Protein Isolate Sales, Revenue and Gross Margin (2018-2023)
- 6.6.4 Shansong Biological Soy Protein Isolate Product Portfolio
- 6.7 Gushen Biological
- 6.7.1 Gushen Biological Company Information
- 6.7.2 Gushen Biological Description and Business Overview
- 6.7.3 Gushen Biological Soy Protein Isolate Sales, Revenue and Gross Margin (2018-2023)
- 6.7.4 Gushen Biological Soy Protein Isolate Product Portfolio
- 6.8 Dezhou Ruikang
- 6.8.1 Dezhou Ruikang Company Information
- 6.8.2 Dezhou Ruikang Description and Business Overview
- 6.8.3 Dezhou Ruikang Soy Protein Isolate Sales, Revenue and Gross Margin (2018-2023)
- 6.8.4 Dezhou Ruikang Soy Protein Isolate Product Portfolio
- 6.9 Scents Holdings
- 6.9.1 Scents Holdings Company Information
- 6.9.2 Scents Holdings Description and Business Overview
- 6.9.3 Scents Holdings Soy Protein Isolate Sales, Revenue and Gross Margin (2018-2023)
- 6.9.4 Scents Holdings Soy Protein Isolate Product Portfolio
- 6.10 Sinoglory Health Food
- 6.10.1 Sinoglory Health Food Company Information
- 6.10.2 Sinoglory Health Food Description and Business Overview
- 6.10.3 Sinoglory Health Food Soy Protein Isolate Sales, Revenue and Gross Margin (2018-2023)
- 6.10.4 Sinoglory Health Food Soy Protein Isolate Product Portfolio
- 6.11 Goldensea
- 6.11.1 Goldensea Company Information
- 6.11.2 Goldensea Description and Business Overview
- 6.11.3 Goldensea Soy Protein Isolate Sales, Revenue and Gross Margin (2018-2023)
- 6.11.4 Goldensea Soy Protein Isolate Product Portfolio
7 Industry Chain and Sales Channels Analysis
- 7.1 Soy Protein Isolate Industry Chain Analysis
- 7.2 Soy Protein Isolate Key Raw Materials
- 7.2.1 Key Raw Materials
- 7.2.2 Raw Materials Key Suppliers
- 7.3 Soy Protein Isolate Production Mode & Process
- 7.4 Soy Protein Isolate Sales and Marketing
- 7.4.1 Soy Protein Isolate Sales Channels
- 7.4.2 Soy Protein Isolate Distributors
- 7.5 Soy Protein Isolate Customers
8 Soy Protein Isolate Market Dynamics
- 8.1 Soy Protein Isolate Industry Trends
- 8.2 Soy Protein Isolate Market Drivers
- 8.3 Soy Protein Isolate Market Challenges
- 8.4 Soy Protein Isolate Market Restraints
9 Research Findings and Conclusion
10 Methodology and Data Source
- 10.1 Methodology/Research Approach
- 10.1.1 Research Programs/Design
- 10.1.2 Market Size Estimation
- 10.1.3 Market Breakdown and Data Triangulation
- 10.2 Data Source
- 10.2.1 Secondary Sources
- 10.2.2 Primary Sources
- 10.3 Author List
- 10.4 Disclaimer