|
|
市場調査レポート
商品コード
1457944
自動車用V2Xの世界市場:市場規模・シェア分析 (提供製品/サービス別・コネクティビティ別・車種別・技術別・ユニット別)、産業需要の予測 (~2030年)Automotive V2X Market Size and Share Analysis by Offering, Communication, Connectivity, Vehicle Type, Technology, Unit - Global Industry Demand Forecast to 2030 |
||||||

|
|||||||
|
|||||||

| 自動車用V2Xの世界市場:市場規模・シェア分析 (提供製品/サービス別・コネクティビティ別・車種別・技術別・ユニット別)、産業需要の予測 (~2030年) |
|
出版日: 2024年02月01日
発行: Prescient & Strategic Intelligence
ページ情報: 英文 240 Pages
納期: 2~3営業日
|

全表示
- 概要
- 目次
世界の自動車用V2X市場は、2023年に6億3,380万米ドルの収益を上げ、2024~2030年のCAGRは49.9%に達し、2030年には102億2,550万米ドルに達すると予想されています。この背景には、自動車の安全性やエコロジーへの関心の高まり、長期的な価格優位性に関して、強化技術への需要が高まっていることがあります。
加えて、自動運転車への需要が高まっており、メーカーは先進的なV2Xシステムを車両に組み込む必要に迫られています。
さらに、道路インフラと自動車の安全性のために政府の規制も導入されつつあり、これが市場の強力な成長促進要因となっています。
高いCAGRで成長するソフトウェア・カテゴリー
ソフトウェアカテゴリーは、2024年から2030年にかけてCAGRが55%になると予測されています。
この成長の背景には、5G技術の統合と自動車の継続的な機能強化があります。
V2Vカテゴリーが最大の市場シェアを占める
2023年、通信の分野では、V2V (車車間通信) のカテゴリーが業界最大のシェアを占め、約90%を占めました。V2Vは位置・方向・速度などの情報をドライバーに提供し、交差点、大渋滞、地形の問題、死角などの潜在的脅威をドライバーに知らせます。
最も急速に発展する商用車カテゴリー
車種別では、商用車カテゴリーが予測期間中に業界で最も高いCAGR (54%) を記録すると推定されます。商用車には、大型トラック、バス、バンなどの大型商用車と小型商用車の両方が含まれます。乗用車よりも能力が高いため、このような車両は物資や運賃を支払う乗客の輸送に利用されます。
アジア太平洋が市場リーダー
2023年には、アジア太平洋地域が業界を支配し、その収益シェアは60%に達しました。APACは近年、自動車製造が発展している地域です。
当レポートでは、世界の自動車用V2Xの市場について分析し、市場の基本構造・最新情勢や主な促進・抑制要因、世界全体および地域別・主要国の市場規模の動向見通し (金額ベース、2017~2030年)、提供製品/サービス別・コネクティビティ別・車種別・技術別・ユニット別の詳細動向、現在の市場競争の状況、主要企業のプロファイルなどを調査しております。
目次
第1章 調査範囲
第2章 調査手法
第3章 エグゼクティブサマリー
第4章 市場指標
第5章 業界の展望
- 市場力学
- 動向
- 促進要因
- 抑制要因/課題
- 促進要因/抑制要因の影響分析
- 新型コロナウイルス感染症 (COVID-19) の影響
- ポーターのファイブフォース分析
第6章 世界市場
- 概要
- 市場収益:提供製品/サービス別 (2017~2030年)
- 市場収益:通信別 (2017~2030年)
- 市場収益:コネクティビティ別 (2017~2030年)
- 市場収益:車種別 (2017~2030年)
- 市場収益:技術別 (2017~2030年)
- 市場収益:ユニット別 (2017~2030年)
- 市場収益:地域別 (2017~2030年)
第7章 北米市場
- 概要
- 市場収益:提供製品/サービス別 (2017~2030年)
- 市場収益:通信別 (2017~2030年)
- 市場収益:コネクティビティ別 (2017~2030年)
- 市場収益:車種別 (2017~2030年)
- 市場収益:技術別 (2017~2030年)
- 市場収益:ユニット別 (2017~2030年)
- 市場収益:国別 (2017~2030年)
第8章 欧州市場
第9章 アジア太平洋市場
第10章 ラテンアメリカ市場
第11章 中東・アフリカ (MEA) 市場
第12章 米国市場
- 概要
- 市場収益:提供製品/サービス別 (2017~2030年)
- 市場収益:通信別 (2017~2030年)
- 市場収益:コネクティビティ別 (2017~2030年)
- 市場収益:車種別 (2017~2030年)
- 市場収益:技術別 (2017~2030年)
- 市場収益:ユニット別 (2017~2030年)
第13章 カナダ市場
第14章 ドイツ市場
第15章 フランス市場
第16章 英国市場
第17章 イタリア市場
第18章 スペイン市場
第19章 日本市場
第20章 中国市場
第21章 インド市場
第22章 オーストラリア市場
第23章 韓国市場
第24章 ブラジル市場
第25章 メキシコ市場
第26章 サウジアラビア市場
第27章 南アフリカ市場
第28章 アラブ首長国連邦 (UAE) 市場
第29章 競合情勢
- 市場参入企業とその提供製品/サービスの一覧
- 主要企業の競合ベンチマーク
- 主要企業の製品ベンチマーク
- 最近の戦略展開状況
第30章 企業プロファイル
- Qualcomm Technologies Inc.
- Harman International
- NXP Semiconductors
- Autotalks Ltd.
- Robert Bosch GmbH
- STMicroelectronics
- Continental AG
- Infineon Technologies AG
- Savari Inc.
- Denso Corporation
第31章 付録
The automotive V2X market generated revenue of USD 633.8 million in 2023, which is expected to witness a CAGR of 49.9% during 2024-2030, to reach USD 10,225.5 million by 2030. This can be credited to the growing demand for enhanced technology with respect to car safety, rising ecological concerns, and long-term price advantages.
Additionally, the demand is increasing for automatic vehicles, which compels manufacturers to incorporate advanced V2X systems in the vehicles.
Further, government regulations are also being incorporated for road infrastructure and vehicle safety which act as a potent growth driver of the market.
Market Drivers
In the past few years, road accidents and deaths associated with them have increased pressure on countries worldwide to implement advanced technologies to solve and eliminate road safety issues.
According to the WHO, approximately 1.19 million people die globally and 20-50 million people suffer from non-fatal injuries every year.
V2X technology has emerged as a revolutionary solution that has the potential to significantly improve road safety.
Real-time communication among automobiles, surrounding infrastructure, pedestrians, and other road users, becomes simpler through V2X.
Incorporation of 5G and AI Technology in Cellular-V2X (C-V2X) Technology
5G and AI are pivotal for the automotive industry's future, especially in enhancing prediction capabilities crucial for personalized driving experiences.
The integration of 5G and AI assists V2X (vehicle-to-everything) communications more efficiently, leading to essential communications that enhance security and safety while driving.
Cellular-V2X technology plays a critical role in advancing vehicle automation by facilitating communication among roadside equipment, vehicles, and pedestrians.
Software Category Is Growing at a High CAGR
The software category is forecasted to experience a 55% compound annual growth rate (CAGR) from 2024 to 2030 in the market.
This growth can be attributed to the integration of 5G technology and the continuous enhancement of features in vehicles.
The widespread adoption of V2X (vehicle-to-everything) technology is contributing significantly to the increased demand for V2X software solutions.
Vehicle-To-Vehicle (V2V) Category Holds the Largest Market Share
In 2023, on the basis of communication, vehicle-to-vehicle category had the largest industry share, of around 90%. Vehicle-to-vehicle aid in providing other vehicle info to drivers such as location, direction, and speed, and signals them of any possible intimidations such as intersections, heavy traffic, terrain issues and blind spots.
Vehicle-To-Infrastructure Category Is Growing with Fastest Pace
Vehicle-to-infrastructure communication category is showing strong growth, manifested in its CAGR of 53% since 2024 till 2030.
This boost is due to the use of V2I (vehicle-to-infrastructure) technology for enhancing driver assistance systems like smart parking and autonomous driving, providing better traffic lane and parking planning optimally for smoother traffic movement now and into the future.
Commercial Vehicles Category to Experience the Fastest Development
On the basis of vehicle type, the commercial Vehicles category is estimated to experience the highest CAGR, of 54%, over the projection period in the industry. Commercial vehicles cover both heavy and light commercial vehicles like large trucks, buses, and vans. Because of their better capacity than passenger cars, such vehicles are utilized for the transportation of goods or fare-paying passengers.
APAC Is the Market Leader
In 2023, the APAC region dominated the industry, with a revenue share of 60%. APAC has been a developing region for the making of cars in the recent years.
The demand for V2X technology in this region has increased as a result of the population's growing purchasing power and growing concerns regarding the environment.
Outstandingly, South Korea and Japan are ahead in the worldwide electronics industry and are situated to plan V2X arrangements with an upgraded performance at a competitive cost.
Table of Contents
Chapter 1. Research Scope
- 1.1. Research Objectives
- 1.2. Market Definition
- 1.3. Analysis Period
- 1.4. Market Size Breakdown by Segments
- 1.4.1. Market size breakdown, by offering
- 1.4.2. Market size breakdown, by communication
- 1.4.3. Market size breakdown, by connectivity
- 1.4.4. Market size breakdown, by vehicle type
- 1.4.5. Market size breakdown, by technology
- 1.4.6. Market size breakdown, by unit
- 1.4.7. Market size breakdown, by region
- 1.4.8. Market size breakdown, by country
- 1.5. Market Data Reporting Unit
- 1.5.1. Value
- 1.6. Key Stakeholders
Chapter 2. Research Methodology
- 2.1. Secondary Research
- 2.1.1. Paid
- 2.1.2. Unpaid
- 2.1.3. P&S Intelligence database
- 2.2. Primary Research
- 2.3. Market Size Estimation
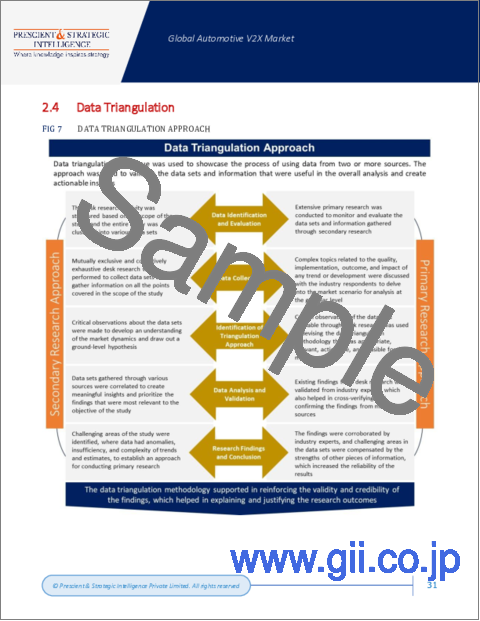
- 2.4. Data Triangulation
- 2.5. Currency Conversion Rates
- 2.6. Assumptions for the Study
- 2.7. Notes and Caveats
Chapter 3. Executive Summary
Chapter 4. Market Indicators
Chapter 5. Industry Outlook
- 5.1. Market Dynamics
- 5.1.1. Trends
- 5.1.2. Drivers
- 5.1.3. Restraints/challenges
- 5.1.4. Impact analysis of drivers/restraints
- 5.2. Impact of COVID-19
- 5.3. Porter's Five Forces Analysis
- 5.3.1. Bargaining power of buyers
- 5.3.2. Bargaining power of suppliers
- 5.3.3. Threat of new entrants
- 5.3.4. Intensity of rivalry
- 5.3.5. Threat of substitutes
Chapter 6. Global Market
- 6.1. Overview
- 6.2. Market Revenue, by Offering (2017-2030)
- 6.3. Market Revenue, by Communication (2017-2030)
- 6.4. Market Revenue, by Connectivity (2017-2030)
- 6.5. Market Revenue, by Vehicle Type (2017-2030)
- 6.6. Market Revenue, by Technology (2017-2030)
- 6.7. Market Revenue, by Unit (2017-2030)
- 6.8. Market Revenue, by Region (2017-2030)
Chapter 7. North America Market
- 7.1. Overview
- 7.2. Market Revenue, by Offering (2017-2030)
- 7.3. Market Revenue, by Communication (2017-2030)
- 7.4. Market Revenue, by Connectivity (2017-2030)
- 7.5. Market Revenue, by Vehicle Type (2017-2030)
- 7.6. Market Revenue, by Technology (2017-2030)
- 7.7. Market Revenue, by Unit (2017-2030)
- 7.8. Market Revenue, by Country (2017-2030)
Chapter 8. Europe Market
- 8.1. Overview
- 8.2. Market Revenue, by Offering (2017-2030)
- 8.3. Market Revenue, by Communication (2017-2030)
- 8.4. Market Revenue, by Connectivity (2017-2030)
- 8.5. Market Revenue, by Vehicle Type (2017-2030)
- 8.6. Market Revenue, by Technology (2017-2030)
- 8.7. Market Revenue, by Unit (2017-2030)
- 8.8. Market Revenue, by Country (2017-2030)
Chapter 9. APAC Market
- 9.1. Overview
- 9.2. Market Revenue, by Offering (2017-2030)
- 9.3. Market Revenue, by Communication (2017-2030)
- 9.4. Market Revenue, by Connectivity (2017-2030)
- 9.5. Market Revenue, by Vehicle Type (2017-2030)
- 9.6. Market Revenue, by Technology (2017-2030)
- 9.7. Market Revenue, by Unit (2017-2030)
- 9.8. Market Revenue, by Country (2017-2030)
Chapter 10. LATAM Market
- 10.1. Overview
- 10.2. Market Revenue, by Offering (2017-2030)
- 10.3. Market Revenue, by Communication (2017-2030)
- 10.4. Market Revenue, by Connectivity (2017-2030)
- 10.5. Market Revenue, by Vehicle Type (2017-2030)
- 10.6. Market Revenue, by Technology (2017-2030)
- 10.7. Market Revenue, by Unit (2017-2030)
- 10.8. Market Revenue, by Country (2017-2030)
Chapter 11. MEA Market
- 11.1. Overview
- 11.2. Market Revenue, by Offering (2017-2030)
- 11.3. Market Revenue, by Communication (2017-2030)
- 11.4. Market Revenue, by Connectivity (2017-2030)
- 11.5. Market Revenue, by Vehicle Type (2017-2030)
- 11.6. Market Revenue, by Technology (2017-2030)
- 11.7. Market Revenue, by Unit (2017-2030)
- 11.8. Market Revenue, by Country (2017-2030)
Chapter 12. U.S. Market
- 12.1. Overview
- 12.2. Market Revenue, by Offering (2017-2030)
- 12.3. Market Revenue, by Communication (2017-2030)
- 12.4. Market Revenue, by Connectivity (2017-2030)
- 12.5. Market Revenue, by Vehicle Type (2017-2030)
- 12.6. Market Revenue, by Technology (2017-2030)
- 12.7. Market Revenue, by Unit (2017-2030)
Chapter 13. Canada Market
- 13.1. Overview
- 13.2. Market Revenue, by Offering (2017-2030)
- 13.3. Market Revenue, by Communication (2017-2030)
- 13.4. Market Revenue, by Connectivity (2017-2030)
- 13.5. Market Revenue, by Vehicle Type (2017-2030)
- 13.6. Market Revenue, by Technology (2017-2030)
- 13.7. Market Revenue, by Unit (2017-2030)
Chapter 14. Germany Market
- 14.1. Overview
- 14.2. Market Revenue, by Offering (2017-2030)
- 14.3. Market Revenue, by Communication (2017-2030)
- 14.4. Market Revenue, by Connectivity (2017-2030)
- 14.5. Market Revenue, by Vehicle Type (2017-2030)
- 14.6. Market Revenue, by Technology (2017-2030)
- 14.7. Market Revenue, by Unit (2017-2030)
Chapter 15. France Market
- 15.1. Overview
- 15.2. Market Revenue, by Offering (2017-2030)
- 15.3. Market Revenue, by Communication (2017-2030)
- 15.4. Market Revenue, by Connectivity (2017-2030)
- 15.5. Market Revenue, by Vehicle Type (2017-2030)
- 15.6. Market Revenue, by Technology (2017-2030)
- 15.7. Market Revenue, by Unit (2017-2030)
Chapter 16. U.K. Market
- 16.1. Overview
- 16.2. Market Revenue, by Offering (2017-2030)
- 16.3. Market Revenue, by Communication (2017-2030)
- 16.4. Market Revenue, by Connectivity (2017-2030)
- 16.5. Market Revenue, by Vehicle Type (2017-2030)
- 16.6. Market Revenue, by Technology (2017-2030)
- 16.7. Market Revenue, by Unit (2017-2030)
Chapter 17. Italy Market
- 17.1. Overview
- 17.2. Market Revenue, by Offering (2017-2030)
- 17.3. Market Revenue, by Communication (2017-2030)
- 17.4. Market Revenue, by Connectivity (2017-2030)
- 17.5. Market Revenue, by Vehicle Type (2017-2030)
- 17.6. Market Revenue, by Technology (2017-2030)
- 17.7. Market Revenue, by Unit (2017-2030)
Chapter 18. Spain Market
- 18.1. Overview
- 18.2. Market Revenue, by Offering (2017-2030)
- 18.3. Market Revenue, by Communication (2017-2030)
- 18.4. Market Revenue, by Connectivity (2017-2030)
- 18.5. Market Revenue, by Vehicle Type (2017-2030)
- 18.6. Market Revenue, by Technology (2017-2030)
- 18.7. Market Revenue, by Unit (2017-2030)
Chapter 19. Japan Market
- 19.1. Overview
- 19.2. Market Revenue, by Offering (2017-2030)
- 19.3. Market Revenue, by Communication (2017-2030)
- 19.4. Market Revenue, by Connectivity (2017-2030)
- 19.5. Market Revenue, by Vehicle Type (2017-2030)
- 19.6. Market Revenue, by Technology (2017-2030)
- 19.7. Market Revenue, by Unit (2017-2030)
Chapter 20. China Market
- 20.1. Overview
- 20.2. Market Revenue, by Offering (2017-2030)
- 20.3. Market Revenue, by Communication (2017-2030)
- 20.4. Market Revenue, by Connectivity (2017-2030)
- 20.5. Market Revenue, by Vehicle Type (2017-2030)
- 20.6. Market Revenue, by Technology (2017-2030)
- 20.7. Market Revenue, by Unit (2017-2030)
Chapter 21. India Market
- 21.1. Overview
- 21.2. Market Revenue, by Offering (2017-2030)
- 21.3. Market Revenue, by Communication (2017-2030)
- 21.4. Market Revenue, by Connectivity (2017-2030)
- 21.5. Market Revenue, by Vehicle Type (2017-2030)
- 21.6. Market Revenue, by Technology (2017-2030)
- 21.7. Market Revenue, by Unit (2017-2030)
Chapter 22. Australia Market
- 22.1. Overview
- 22.2. Market Revenue, by Offering (2017-2030)
- 22.3. Market Revenue, by Communication (2017-2030)
- 22.4. Market Revenue, by Connectivity (2017-2030)
- 22.5. Market Revenue, by Vehicle Type (2017-2030)
- 22.6. Market Revenue, by Technology (2017-2030)
- 22.7. Market Revenue, by Unit (2017-2030)
Chapter 23. South Korea Market
- 23.1. Overview
- 23.2. Market Revenue, by Offering (2017-2030)
- 23.3. Market Revenue, by Communication (2017-2030)
- 23.4. Market Revenue, by Connectivity (2017-2030)
- 23.5. Market Revenue, by Vehicle Type (2017-2030)
- 23.6. Market Revenue, by Technology (2017-2030)
- 23.7. Market Revenue, by Unit (2017-2030)
Chapter 24. Brazil Market
- 24.1. Overview
- 24.2. Market Revenue, by Offering (2017-2030)
- 24.3. Market Revenue, by Communication (2017-2030)
- 24.4. Market Revenue, by Connectivity (2017-2030)
- 24.5. Market Revenue, by Vehicle Type (2017-2030)
- 24.6. Market Revenue, by Technology (2017-2030)
- 24.7. Market Revenue, by Unit (2017-2030)
Chapter 25. Mexico Market
- 25.1. Overview
- 25.2. Market Revenue, by Offering (2017-2030)
- 25.3. Market Revenue, by Communication (2017-2030)
- 25.4. Market Revenue, by Connectivity (2017-2030)
- 25.5. Market Revenue, by Vehicle Type (2017-2030)
- 25.6. Market Revenue, by Technology (2017-2030)
- 25.7. Market Revenue, by Unit (2017-2030)
Chapter 26. Saudi Arabia Market
- 26.1. Overview
- 26.2. Market Revenue, by Offering (2017-2030)
- 26.3. Market Revenue, by Communication (2017-2030)
- 26.4. Market Revenue, by Connectivity (2017-2030)
- 26.5. Market Revenue, by Vehicle Type (2017-2030)
- 26.6. Market Revenue, by Technology (2017-2030)
- 26.7. Market Revenue, by Unit (2017-2030)
Chapter 27. South Africa Market
- 27.1. Overview
- 27.2. Market Revenue, by Offering (2017-2030)
- 27.3. Market Revenue, by Communication (2017-2030)
- 27.4. Market Revenue, by Connectivity (2017-2030)
- 27.5. Market Revenue, by Vehicle Type (2017-2030)
- 27.6. Market Revenue, by Technology (2017-2030)
- 27.7. Market Revenue, by Unit (2017-2030)
Chapter 28. U.A.E. Market
- 28.1. Overview
- 28.2. Market Revenue, by Offering (2017-2030)
- 28.3. Market Revenue, by Communication (2017-2030)
- 28.4. Market Revenue, by Connectivity (2017-2030)
- 28.5. Market Revenue, by Vehicle Type (2017-2030)
- 28.6. Market Revenue, by Technology (2017-2030)
- 28.7. Market Revenue, by Unit (2017-2030)
Chapter 29. Competitive Landscape
- 29.1. List of Market Players and their Offerings
- 29.2. Competitive Benchmarking of Key Players
- 29.3. Product Benchmarking of Key Players
- 29.4. Recent Strategic Developments
Chapter 30. Company Profiles
- 30.1. Qualcomm Technologies Inc.
- 30.1.1. Business overview
- 30.1.2. Product and service offerings
- 30.1.3. Key financial summary
- 30.2. Harman International
- 30.2.1. Business overview
- 30.2.2. Product and service offerings
- 30.2.3. Key financial summary
- 30.3. NXP Semiconductors
- 30.3.1. Business overview
- 30.3.2. Product and service offerings
- 30.3.3. Key financial summary
- 30.4. Autotalks Ltd.
- 30.4.1. Business overview
- 30.4.2. Product and service offerings
- 30.4.3. Key financial summary
- 30.5. Robert Bosch GmbH
- 30.5.1. Business overview
- 30.5.2. Product and service offerings
- 30.5.3. Key financial summary
- 30.6. STMicroelectronics
- 30.6.1. Business overview
- 30.6.2. Product and service offerings
- 30.6.3. Key financial summary
- 30.7. Continental AG
- 30.7.1. Business overview
- 30.7.2. Product and service offerings
- 30.7.3. Key financial summary
- 30.8. Infineon Technologies AG
- 30.8.1. Business overview
- 30.8.2. Product and service offerings
- 30.8.3. Key financial summary
- 30.9. Savari Inc.
- 30.9.1. Business overview
- 30.9.2. Product and service offerings
- 30.9.3. Key financial summary
- 30.10. Denso Corporation
- 30.10.1. Business overview
- 30.10.2. Product and service offerings
- 30.10.3. Key financial summary
Chapter 31. Appendix
- 31.1. Abbreviations
- 31.2. Sources and References
- 31.3. Related Reports

