|
|
市場調査レポート
商品コード
1525999
光線力学療法(PDT)市場:世界の産業分析、規模、シェア、成長、動向、予測、2024年~2031年Photodynamic Therapy Market: Global Industry Analysis, Size, Share, Growth, Trends, and Forecast, 2024 - 2031 |
||||||

|
|||||||
カスタマイズ可能
|
|||||||

| 光線力学療法(PDT)市場:世界の産業分析、規模、シェア、成長、動向、予測、2024年~2031年 |
|
出版日: 2024年07月26日
発行: Persistence Market Research
ページ情報: 英文 170 Pages
納期: 2~5営業日
|

全表示
- 概要
- 目次
Persistence Market Research社はこのほど、光線力学療法(PDT)の世界市場に関する包括的なレポートを発表しました。当レポートでは、市場促進要因・動向・機会・課題など、本質的な市場ダイナミクスを詳細に評価し、市場構造に関する詳細な洞察を提供しています。
主な洞察
- 光線力学療法の市場規模(2024年):35億米ドル
- 予測市場規模(2031年):74億米ドル
- 世界市場成長率(CAGR 2024-2031):7.1%
光線力学療法市場- レポート範囲:
光線力学療法は、特定のがん、加齢黄斑変性(AMD)、前がん病変を含む様々な病状の治療において重要な役割を果たしています。PDTは、光感受性薬剤と特定の波長の光を利用して標的細胞を破壊します。光線力学療法市場は、病院、腫瘍センター、眼科クリニックにサービスを提供しており、光増感剤、光源、送達システムなど、さまざまな治療製品や技術を提供しています。市場成長の原動力は、がんや慢性疾患の罹患率の増加、ヘルスケア投資の増加、治療効果と患者の転帰を改善するPDT技術の進歩です。
市場成長の促進要因:
世界の光線力学療法市場は、効果的な治療オプションを必要とするがんやその他の慢性疾患の有病率の増加など、いくつかの重要な要因によって牽引されています。非侵襲的で標的を絞った治療に対する需要の高まりと、光増感剤化合物や光送達システムの進歩が市場拡大を促進しています。AMD治療のために眼科でPDTが採用されつつあることや、有効性が改善され副作用が軽減された新規PDT薬剤の開発も市場拡大に寄与しています。さらに、ヘルスケアインフラの拡大やPDTの研究活動の活発化も、市場参入者に新たな機会をもたらしています。
市場抑制要因:
有望な成長が見込まれるもの、光線力学療法市場は、高額な治療費、限られた償還範囲、潜在的な副作用に関する課題に直面しています。PDT装置や光増感剤のコストは、特に医療予算に制約のある新興市場では、一部のヘルスケアシステムや患者にとって高額になる可能性があります。さらに、PDT治療に対する償還が限られていることや、皮膚の過敏性や損傷などの潜在的な副作用に対する懸念が、市場浸透の課題となっています。このような障壁に対処するには、PDTソリューションへのアクセスと手頃な価格を改善するために、業界利害関係者、医療提供者、政策立案者が協力する必要があります。
市場機会:
光線力学療法市場は、技術革新、人口動向、治療パラダイムの進化によって大きな成長機会がもたらされます。特異性が強化され、全身毒性が低減された先進的な光増感剤の開発は、新たな治療の可能性を提供します。さらに、PDTと化学療法や免疫療法などの他の治療法との統合により、その応用範囲が拡大しています。個別化医療の台頭と疾患の早期発見・早期治療への関心の高まりは、PDTに新たな道を開いています。研究開発への戦略的投資、戦略的提携、費用対効果の高いPDTソリューションのイントロダクションは、新たな機会を活用し、市場でのリーダーシップを維持するために極めて重要です。
本レポートで扱う主な質問
- 世界の光線力学療法市場の成長を促す主な要因は何か?
- さまざまな医療分野で採用をリードしているPDT用途と技術は何か?
- 技術進歩やイノベーションはPDT市場の競合情勢をどのように変えているのか?
- 光線力学療法市場に貢献している主要企業は誰で、市場でのプレゼンスを維持するためにどのような戦略を採用しているのか?
- 世界の光線力学療法市場の新たな動向と将来展望は?
目次
第1章 エグゼクティブサマリー
第2章 市場概要
- 市場範囲/ 分類
- 市場の定義/ 範囲/ 制限
第3章 主要な市場動向
- 疾病疫学(2019)
- 患者の治療の過程
- 光線療法の治療パターン
- 美容治療の施術件数
第4章 重要成功要因
- 最近の製品リリース
- 規制シナリオ
- 日光角化症および基底細胞がんの疾病疫学(2019)
- メーカーによる戦略的プロモーション戦略
第5章 世界の光線力学療法市場- 価格分析
- 製品タイプ別の地域別価格分析
- 世界平均価格分析ベンチマーク
第6章 世界の光線力学療法市場の需要
- 過去の市場金額(10億米ドル)分析、2019年~2023年
- 現在および将来の市場金額(10億米ドル)予測、2024年-2031年
- 前年比成長動向分析
- 絶対的収益機会
第7章 市場背景
- マクロ経済要因
- 予測要因- 関連性と影響
- 市場力学
第8章 世界の光線力学療法市場分析:製品タイプ別
- イントロダクション/主な調査結果
- 過去の市場規模(10億米ドル)分析、製品タイプ別、2019~2023年
- 現在および将来の市場規模(10億米ドル)の分析と予測、製品タイプ別、2024年-2031年
- 光感受性薬
- ヘマトポルフィリン誘導体(HpD)
- アミノレブリン酸(ALA)
- ベンゾポルフィリン誘導体(BPD)
- テキサフィリン
- クロリン
- 染料
- 装置
- 使い捨て光ファイバー光伝送装置
- ダイオードレーザー
- 光感受性薬
- 市場の魅力分析:製品タイプ別
第9章 世界の光線力学療法市場分析:用途別
- イントロダクション/主な調査結果
- 過去の市場規模(10億米ドル)分析、用途別、2019~2023年
- 現在および将来の市場規模(10億米ドル)の分析と予測、用途別、2024年-2031年
- 基底細胞がん
- 日光角化症
- その他
- 乾癬
- ニキビ
- 酒さ様皮膚炎
- 非小細胞肺がん
- 食道がん
- 眼科
- 市場の魅力分析:用途別
第10章 世界の光線力学療法市場分析:エンドユーザー別
- イントロダクション/主な調査結果
- 過去の市場規模(10億米ドル)分析、エンドユーザー別、2019~2023年
- 現在および将来の市場規模(10億米ドル)の分析と予測、エンドユーザー別、2024年-2031年
- 病院
- 民間皮膚科クリニック
- レーザー治療センター
- がん治療センター
- スパと若返りセンター
- 市場の魅力分析:エンドユーザー別
第11章 北米の光線力学療法市場分析
第12章 ラテンアメリカの光線力学療法市場分析
第13章 欧州の光線力学療法市場分析
第14章 南アジアの光線力学療法市場分析
第15章 東アジアの光線力学療法市場分析
第16章 オセアニア光線力学療法市場分析
第17章 中東およびアフリカの光線力学療法市場分析
第18章 新興国の光線力学療法市場分析
- イントロダクション
- 主要国別の市場金額割合分析
- 世界と国別の成長比較
- 中国光線力学療法市場分析
- イントロダクション
- 市場分類による市場金額割合分析
- 市場分類別の市場金額(10億米ドル)分析と予測
- 製品タイプ
- エンドユーザー別
- 用途別
- 韓国の光線力学療法市場分析
- イントロダクション
- 市場分類による市場金額割合分析
- 市場分類別の市場金額(10億米ドル)分析と予測
- 製品タイプ
- エンドユーザー別
- 用途別
- ロシアの光線力学療法市場分析
- イントロダクション
- 価格分析
- PEST分析
- 市場分類による市場金額割合分析
- 市場分類別の市場金額(10億米ドル)分析と予測
- 製品タイプ
- エンドユーザー別
- 用途別
- 韓国の光線力学療法市場-競合情勢
第19章 競合分析
- 競合ダッシュボード
- 競合ベンチマーク
- 競合の深掘り(光感受性薬製造業者)
- Galderma SA
- Sun Pharmaceutical Industries Ltd.
- Biofrontera
- Novartis AG
- Allergan Plc
- 競合の深掘り(PDTデバイス製造業者)
- Valeant Pharmaceuticals International, Inc
- 概要
- 製品ポートフォリオ
- 市場セグメント別収益性(製品/チャネル/地域)
- 販売拠点
- 戦略概要
- マーケティング戦略
- 製品戦略
- チャネル戦略
- Quest Pharmatech, Inc.
- 概要
- 製品ポートフォリオ
- 市場セグメント別収益性(製品/チャネル/地域)
- 販売拠点
- 戦略概要
- マーケティング戦略
- 製品戦略
- チャネル戦略
- Hologic, Inc. (Cynosure Inc.)
- 概要
- 製品ポートフォリオ
- 市場セグメント別収益性(製品/チャネル/地域)
- 販売拠点
- 戦略概要
- マーケティング戦略
- 製品戦略
- チャネル戦略
- Valeant Pharmaceuticals International, Inc
第20章 使用される仮定と頭字語
第21章 調査手法
Persistence Market Research has recently released a comprehensive report on the worldwide market for photodynamic therapy (PDT). This report provides an in-depth assessment of essential market dynamics, including drivers, trends, opportunities, and challenges, offering detailed insights into the market structure.
Key Insights:
- Photodynamic Therapy Market Size (2024): USD 3.5 Bn
- Projected Market Value (2031): USD 7.4 Bn
- Global Market Growth Rate (CAGR 2024- 2031): 7.1%
Photodynamic Therapy Market - Report Scope:
Photodynamic therapy plays a crucial role in the treatment of various medical conditions, including certain cancers, age-related macular degeneration (AMD), and precancerous lesions. PDT utilizes light-sensitive drugs and specific wavelengths of light to destroy targeted cells. The photodynamic therapy market serves hospitals, oncology centers, and ophthalmology clinics, offering various therapeutic products and technologies, including photosensitizers, light sources, and delivery systems. Market growth is driven by increasing incidence of cancer and chronic diseases, rising healthcare investments, and advancements in PDT technology, which improve treatment effectiveness and patient outcomes.
Market Growth Drivers:
The global photodynamic therapy market is driven by several key factors, including the growing prevalence of cancer and other chronic conditions requiring effective treatment options. The rising demand for non-invasive and targeted therapies, along with advancements in photosensitizer compounds and light delivery systems, is fostering market expansion. The increasing adoption of PDT in ophthalmology for AMD treatment and the development of novel PDT agents with improved efficacy and reduced side effects are also contributing to market growth. Additionally, expanding healthcare infrastructure and increased research activities in PDT are creating new opportunities for market players.
Market Restraints:
Despite promising growth prospects, the photodynamic therapy market faces challenges related to high treatment costs, limited reimbursement coverage, and potential side effects. The cost of PDT equipment and photosensitizers can be prohibitive for some healthcare systems and patients, particularly in emerging markets with constrained healthcare budgets. Additionally, the limited availability of reimbursement for PDT procedures and concerns about potential adverse effects, such as skin sensitivity and damage, pose challenges for market penetration. Addressing these barriers requires collaboration between industry stakeholders, healthcare providers, and policymakers to improve access and affordability of PDT solutions.
Market Opportunities:
The photodynamic therapy market presents significant growth opportunities driven by technological innovations, demographic trends, and evolving treatment paradigms. The development of advanced photosensitizers with enhanced specificity and reduced systemic toxicity offers new therapeutic possibilities. Moreover, the integration of PDT with other treatment modalities, such as chemotherapy and immunotherapy, is expanding its application scope. The rise of personalized medicine and the increasing focus on early disease detection and treatment are creating new avenues for PDT. Strategic investments in R&D, strategic partnerships, and the introduction of cost-effective PDT solutions are crucial for capitalizing on emerging opportunities and maintaining market leadership.
Key Questions Answered in the Report:
- What are the primary factors driving the growth of the photodynamic therapy market globally?
- Which PDT applications and technologies are leading the adoption across different medical fields?
- How are technological advancements and innovations reshaping the competitive landscape of the PDT market?
- Who are the key players contributing to the photodynamic therapy market, and what strategies are they employing to sustain their market presence?
- What are the emerging trends and future prospects in the global photodynamic therapy market?
Competitive Intelligence and Business Strategy:
Leading players in the global photodynamic therapy market, including Pfizer Inc., Theralase Technologies Inc., and Galderma S.A., focus on innovation, product differentiation, and strategic partnerships to gain a competitive edge. These companies invest in R&D to develop advanced PDT products and technologies, including novel photosensitizers, next-generation light delivery systems, and combination therapies. Collaborations with research institutions, healthcare providers, and regulatory bodies facilitate market access and technology adoption. Emphasis on clinical trials, evidence-based practices, and patient education is also crucial for driving market growth and enhancing treatment outcomes in the evolving PDT landscape.
Key Companies Profiled:
- Givaudan
- International Flavors & Fragrances Inc
- MANE
- Firmenich SA
- BASF SE
- Avon Products, Inc.
- Shiseido Company
- Limited, Chanel S.A
- Clarins Fragrance Group
- COTY INC., LVMH, L'Oreal Group
- VIORYL S.A.
- Zanos Ltd.
- Artiste
- INDESSO AROMA
- Aroma Chemical Services International Gmbh
Photodynamic Therapy Market Segmentation
By Product Type
- Photosensitizer Drugs
- Photodynamic Therapy Devices
By Application
- Cancer
- Skin Conditions
By Region
- North America
- Europe
- Latin America
- Western Europe
- Eastern Europe
- South Asia and Pacific
- East Asia
- The Middle East and Africa
Table of Contents
1. Executive Summary
- 1.1. Global Market Outlook
- 1.2. Demand Side Trends
- 1.3. Supply Side Trends
- 1.4. Analysis and Recommendations
2. Market Overview
- 2.1. Market Coverage / Taxonomy
- 2.2. Market Definition / Scope / Limitations
3. Key Market Trends
- 3.1. Disease Epidemiology (2019)
- 3.2. Patient Treatment Journey
- 3.3. Phototherapy Treatment Patterns
- 3.4. Procedure Volume of Cosmetic Therapies
4. Key Success Factors
- 4.1. Recent Product Launches
- 4.2. Regulatory Scenario
- 4.3. Disease Epidemiology For Actinic Keratosis & Basal Cell Carcinoma (2019)
- 4.4. Strategic Promotional Strategies, By Manufacturers
5. Global Photodynamic Therapy Market - Pricing Analysis
- 5.1. Regional Pricing Analysis By Product Type
- 5.2. Global Average Pricing Analysis Benchmark
6. Global Photodynamic Therapy Market Demand (in Value or Size in US$ Bn ) Analysis 2019-2023 and Forecast, 2024 - 2031
- 6.1. Historical Market Value (US$ Bn ) Analysis, 2019-2023
- 6.2. Current and Future Market Value (US$ Bn ) Projections, 2024 - 2031
- 6.2.1. Y-o-Y Growth Trend Analysis
- 6.2.2. Absolute $ Opportunity Analysis
7. Market Background
- 7.1. Macro-Economic Factors
- 7.1.1. Global GDP Growth Outlook
- 7.1.2. Global Healthcare Industry Outlook
- 7.2. Forecast Factors - Relevance & Impact
- 7.2.1. Recent Product Launches
- 7.2.2. Prevalence of Skin Disorders and Cancer
- 7.2.3. Adoption of Photodynamic Therapy For Skin and Cancer Treatment
- 7.2.4. Top Companies Historical Growth
- 7.2.5. Per Capita Healthcare Expenditure In Different Economies
- 7.3. Market Dynamics
- 7.3.1. Drivers
- 7.3.2. Restraints
- 7.3.3. Opportunity Analysis
8. Global Photodynamic Therapy Market Analysis 2019-2023 and Forecast 2024 - 2031, by Product Type
- 8.1. Introduction / Key Findings
- 8.2. Historical Market Size (US$ Bn ) Analysis By Product Type, 2019-2023
- 8.3. Current and Future Market Size (US$ Bn ) Analysis and Forecast By Product Type, 2024 - 2031
- 8.3.1. Photosensitizer Drugs
- 8.3.1.1. Hematoporphyrin derivative (HpD)
- 8.3.1.2. Aminolevulinic acid (ALA)
- 8.3.1.3. Benzoporphyrin derivative (BPD)
- 8.3.1.4. Texaphyrins
- 8.3.1.5. Chlorins
- 8.3.1.6. Dyes
- 8.3.2. Devices
- 8.3.2.1. Disposable Fiberoptic Light Delivery Devices
- 8.3.2.2. Diode Laser
- 8.3.1. Photosensitizer Drugs
- 8.4. Market Attractiveness Analysis By Product Type
9. Global Photodynamic Therapy Market Analysis 2019-2023 and Forecast 2024 - 2031, by Application
- 9.1. Introduction / Key Findings
- 9.2. Historical Market Size (US$ Bn ) Analysis By Application, 2019-2023
- 9.3. Current and Future Market Size (US$ Bn ) Analysis and Forecast By Application, 2024 - 2031
- 9.3.1. Basal Cell Carcinoma
- 9.3.2. Actinic Keratosis
- 9.3.3. Others
- 9.3.3.1. Psoriasis
- 9.3.3.2. Acne
- 9.3.3.3. Rosacea
- 9.3.3.4. Non-Small Cell Lung Cancer
- 9.3.3.5. Esophageal Cancer
- 9.3.3.6. Ophthalmology
- 9.4. Market Attractiveness Analysis By Application
10. Global Photodynamic Therapy Market Analysis 2019-2023 and Forecast 2024 - 2031, by End User
- 10.1. Introduction / Key Findings
- 10.2. Historical Market Size (US$ Bn ) Analysis By End User, 2019-2023
- 10.3. Current and Future Market Size (US$ Bn ) Analysis and Forecast By End User, 2024 - 2031
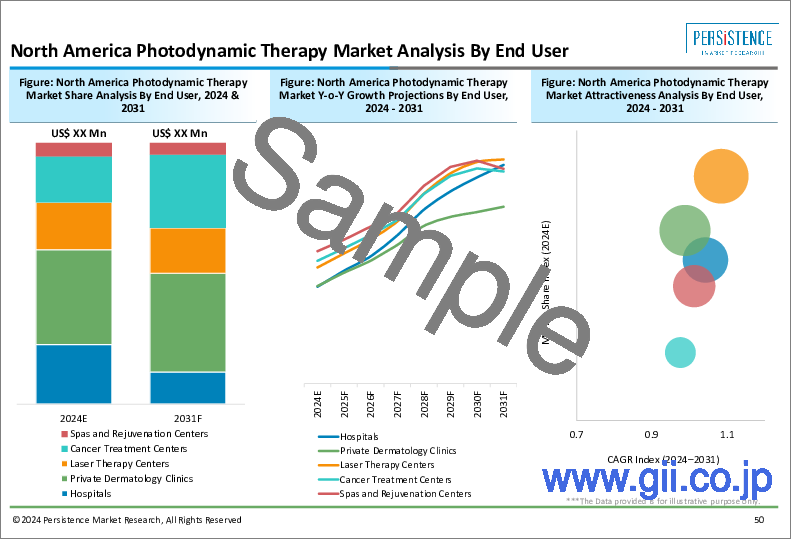
- 10.3.1. Hospitals
- 10.3.2. Private Dermatology Clinics
- 10.3.3. Laser Therapy Centers
- 10.3.4. Cancer Treatment Centers
- 10.3.5. Spas and Rejuvenation Centers
- 10.4. Market Attractiveness Analysis By End User
11. North America Photodynamic Therapy Market Analysis 2019-2023 and Forecast 2024 - 2031
- 11.1. Introduction
- 11.2. Pricing Analysis
- 11.3. Historical Market Size (US$ Bn ) Trend Analysis By Market Taxonomy, 2019-2023
- 11.4. Market Size (US$ Bn ) Forecast By Market Taxonomy, 2024 - 2031
- 11.4.1. By Country
- 11.4.1.1. U.S.
- 11.4.1.2. Canada
- 11.4.2. By Product Type
- 11.4.3. By Application
- 11.4.4. By End User
- 11.4.1. By Country
- 11.5. Market Attractiveness Analysis
- 11.5.1. By Country
- 11.5.2. By Product Type
- 11.5.3. By Application
- 11.5.4. By End User
- 11.6. Market Trends
12. Latin America Photodynamic Therapy Market Analysis 2019-2023 and Forecast 2024 - 2031
- 12.1. Introduction
- 12.2. Pricing Analysis
- 12.3. Historical Market Size (US$ Bn ) Trend Analysis By Market Taxonomy, 2019-2023
- 12.4. Market Size (US$ Bn ) Forecast By Market Taxonomy, 2024 - 2031
- 12.4.1. By Country
- 12.4.1.1. Brazil
- 12.4.1.2. Mexico
- 12.4.1.3. Rest of Latin America
- 12.4.2. By Product Type
- 12.4.3. By Application
- 12.4.4. By End User
- 12.4.1. By Country
- 12.5. Market Attractiveness Analysis
- 12.5.1. By Country
- 12.5.2. By Product Type
- 12.5.3. By Application
- 12.5.4. By End User
- 12.6. Market Trends
13. Europe Photodynamic Therapy Market Analysis 2019-2023 and Forecast 2024 - 2031
- 13.1. Introduction
- 13.2. Pricing Analysis
- 13.3. Historical Market Size (US$ Bn ) Trend Analysis By Market Taxonomy, 2019-2023
- 13.4. Market Size (US$ Bn ) Forecast By Market Taxonomy, 2024 - 2031
- 13.4.1. By Country
- 13.4.1.1. Germany
- 13.4.1.2. Italy
- 13.4.1.3. France
- 13.4.1.4. U.K.
- 13.4.1.5. Spain
- 13.4.1.6. Russia
- 13.4.1.7. Poland
- 13.4.1.8. Rest of Europe
- 13.4.2. By Product Type
- 13.4.3. By Application
- 13.4.4. By End User
- 13.4.1. By Country
- 13.5. Market Attractiveness Analysis
- 13.5.1. By Country
- 13.5.2. By Product Type
- 13.5.3. By Application
- 13.5.4. By End User
- 13.6. Market Trends
14. South Asia Photodynamic Therapy Market Analysis 2019-2023 and Forecast 2024 - 2031
- 14.1. Introduction
- 14.2. Pricing Analysis
- 14.3. Historical Market Size (US$ Bn ) Trend Analysis By Market Taxonomy, 2019-2023
- 14.4. Market Size (US$ Bn ) Forecast By Market Taxonomy, 2024 - 2031
- 14.4.1. By Country
- 14.4.1.1. India
- 14.4.1.2. Thailand
- 14.4.1.3. Indonesia
- 14.4.1.4. Malaysia
- 14.4.1.5. Rest of South Asia
- 14.4.2. By Product Type
- 14.4.3. By Application
- 14.4.4. By End User
- 14.4.1. By Country
- 14.5. Market Attractiveness Analysis
- 14.5.1. By Country
- 14.5.2. By Product Type
- 14.5.3. By Application
- 14.5.4. By End User
- 14.6. Market Trends
15. East Asia Photodynamic Therapy Market Analysis 2019-2023 and Forecast 2024 - 2031
- 15.1. Introduction
- 15.2. Pricing Analysis
- 15.3. Historical Market Size (US$ Bn ) Trend Analysis By Market Taxonomy, 2019-2023
- 15.4. Market Size (US$ Bn ) Forecast By Market Taxonomy, 2024 - 2031
- 15.4.1. By Country
- 15.4.1.1. China
- 15.4.1.2. Japan
- 15.4.1.3. South Korea
- 15.4.2. By Product Type
- 15.4.3. By Application
- 15.4.4. By End User
- 15.4.1. By Country
- 15.5. Market Attractiveness Analysis
- 15.5.1. By Country
- 15.5.2. By Product Type
- 15.5.3. By Application
- 15.5.4. By End User
- 15.6. Market Trends
16. Oceania Photodynamic Therapy Market Analysis 2019-2023 and Forecast 2024 - 2031
- 16.1. Introduction
- 16.2. Pricing Analysis
- 16.3. Historical Market Size (US$ Bn ) Trend Analysis By Market Taxonomy, 2019-2023
- 16.4. Market Size (US$ Bn ) Forecast By Market Taxonomy, 2024 - 2031
- 16.4.1. By Country
- 16.4.1.1. Australia
- 16.4.1.2. New Zealand
- 16.4.2. By Product Type
- 16.4.3. By Application
- 16.4.4. By End User
- 16.4.1. By Country
- 16.5. Market Attractiveness Analysis
- 16.5.1. By Country
- 16.5.2. By Product Type
- 16.5.3. By Application
- 16.5.4. By End User
- 16.6. Market Trends
17. Middle East and Africa Photodynamic Therapy Market Analysis 2019-2023 and Forecast 2024 - 2031
- 17.1. Introduction
- 17.2. Pricing Analysis
- 17.3. Historical Market Size (US$ Bn ) Trend Analysis By Market Taxonomy, 2019-2023
- 17.4. Market Size (US$ Bn ) Forecast By Market Taxonomy, 2024 - 2031
- 17.4.1. By Country
- 17.4.1.1. GCC Countries
- 17.4.1.2. South Africa
- 17.4.1.3. Rest of Middle East and Africa
- 17.4.2. By Product Type
- 17.4.3. By Application
- 17.4.4. By End User
- 17.4.1. By Country
- 17.5. Market Attractiveness Analysis
- 17.5.1. By Country
- 17.5.2. By Product Type
- 17.5.3. By Application
- 17.5.4. By End User
- 17.6. Market Trends
- 17.7. Key Market Participants - Intensity Mapping
- 17.8. Drivers and Restraints - Impact Analysis
18. Emerging Countries Photodynamic Therapy Market Analysis 2019-2023 and Forecast 2024 - 2031
- 18.1. Introduction
- 18.1.1. Market Value Proportion Analysis, By Key Countries
- 18.1.2. Global Vs. Country Growth Comparison
- 18.2. China Photodynamic Therapy Market Analysis
- 18.2.1. Introduction
- 18.2.2. Market Value Proportion Analysis by Market Taxonomy
- 18.2.3. Market Value (US$ Bn ) Analysis and Forecast by Market Taxonomy
- 18.2.3.1. By Product Type
- 18.2.3.2. By End User
- 18.2.3.3. By Application
- 18.3. South Korea Photodynamic Therapy Market Analysis
- 18.3.1. Introduction
- 18.3.2. Market Value Proportion Analysis by Market Taxonomy
- 18.3.3. Market Value (US$ Bn ) Analysis and Forecast by Market Taxonomy
- 18.3.3.1. By Product Type
- 18.3.3.2. By End User
- 18.3.3.3. By Application
- 18.4. Russia Photodynamic Therapy Market Analysis
- 18.4.1. Introduction
- 18.4.2. Pricing Analysis
- 18.4.3. PEST Analysis
- 18.4.4. Market Value Proportion Analysis by Market Taxonomy
- 18.4.5. Market Value (US$ Bn ) Analysis and Forecast by Market Taxonomy
- 18.4.5.1. By Product Type
- 18.4.5.2. By End User
- 18.4.5.3. By Application
- 18.4.6. South Korea Photodynamic Therapy Market - Competition Landscape
19. Competition Analysis
- 19.1. Competition Dashboard
- 19.2. Competition Benchmarking
- 19.3. Competition Deep Dive (Photosensitizer Drug Manufactures)
- 19.3.1. Galderma S.A.
- 19.3.1.1. Overview
- 19.3.1.2. Product Portfolio
- 19.3.1.3. Profitability by Market Segments (Product/Channel/Region)
- 19.3.1.4. Sales Footprint
- 19.3.1.5. Strategy Overview
- 19.3.1.5.1. Marketing Strategy
- 19.3.1.5.2. Product Strategy
- 19.3.1.5.3. Channel Strategy
- 19.3.2. Sun Pharmaceutical Industries Ltd.
- 19.3.2.1. Overview
- 19.3.2.2. Product Portfolio
- 19.3.2.3. Profitability by Market Segments (Product/Channel/Region)
- 19.3.2.4. Sales Footprint
- 19.3.2.5. Strategy Overview
- 19.3.2.5.1. Marketing Strategy
- 19.3.2.5.2. Product Strategy
- 19.3.2.5.3. Channel Strategy
- 19.3.3. Biofrontera
- 19.3.3.1. Overview
- 19.3.3.2. Product Portfolio
- 19.3.3.3. Profitability by Market Segments (Product/Channel/Region)
- 19.3.3.4. Sales Footprint
- 19.3.3.5. Strategy Overview
- 19.3.3.5.1. Marketing Strategy
- 19.3.3.5.2. Product Strategy
- 19.3.3.5.3. Channel Strategy
- 19.3.4. Novartis AG
- 19.3.4.1. Overview
- 19.3.4.2. Product Portfolio
- 19.3.4.3. Profitability by Market Segments (Product/Channel/Region)
- 19.3.4.4. Sales Footprint
- 19.3.4.5. Strategy Overview
- 19.3.4.5.1. Marketing Strategy
- 19.3.4.5.2. Product Strategy
- 19.3.4.5.3. Channel Strategy
- 19.3.5. Allergan Plc
- 19.3.5.1. Overview
- 19.3.5.2. Product Portfolio
- 19.3.5.3. Profitability by Market Segments (Product/Channel/Region)
- 19.3.5.4. Sales Footprint
- 19.3.5.5. Strategy Overview
- 19.3.5.5.1. Marketing Strategy
- 19.3.5.5.2. Product Strategy
- 19.3.5.5.3. Channel Strategy
- 19.3.1. Galderma S.A.
- 19.4. Competition Deep Dive (PDT Device Manufactures)
- 19.4.1. Valeant Pharmaceuticals International, Inc.
- 19.4.1.1. Overview
- 19.4.1.2. Product Portfolio
- 19.4.1.3. Profitability by Market Segments (Product/Channel/Region)
- 19.4.1.4. Sales Footprint
- 19.4.1.5. Strategy Overview
- 19.4.1.5.1. Marketing Strategy
- 19.4.1.5.2. Product Strategy
- 19.4.1.5.3. Channel Strategy
- 19.4.2. Quest Pharmatech, Inc.
- 19.4.2.1. Overview
- 19.4.2.2. Product Portfolio
- 19.4.2.3. Profitability by Market Segments (Product/Channel/Region)
- 19.4.2.4. Sales Footprint
- 19.4.2.5. Strategy Overview
- 19.4.2.5.1. Marketing Strategy
- 19.4.2.5.2. Product Strategy
- 19.4.2.5.3. Channel Strategy
- 19.4.3. Hologic, Inc. (Cynosure Inc.)
- 19.4.3.1. Overview
- 19.4.3.2. Product Portfolio
- 19.4.3.3. Profitability by Market Segments (Product/Channel/Region)
- 19.4.3.4. Sales Footprint
- 19.4.3.5. Strategy Overview
- 19.4.3.5.1. Marketing Strategy
- 19.4.3.5.2. Product Strategy
- 19.4.3.5.3. Channel Strategy
- 19.4.1. Valeant Pharmaceuticals International, Inc.
