|
|
市場調査レポート
商品コード
1463117
光線力学的療法用デバイス市場、シェア、規模、動向、産業分析レポート:製品別、用途別、最終用途別、地域別、セグメント予測、2024-2032年Photodynamic Therapy Devices Market Share, Size, Trends, Industry Analysis Report, By Product (Diode Laser and Disposable Fiber Optic Light Delivery Devices); By Application; By End Use; By Region; Segment Forecast, 2024- 2032 |
||||||
|
|||||||
カスタマイズ可能
|
|||||||

| 光線力学的療法用デバイス市場、シェア、規模、動向、産業分析レポート:製品別、用途別、最終用途別、地域別、セグメント予測、2024-2032年 |
|
出版日: 2024年03月24日
発行: Polaris Market Research
ページ情報: 英文 117 Pages
納期: 即日から翌営業日
|

全表示
- 概要
- 図表
- 目次
Polaris Market Researchの最新調査によると、世界の光線力学的療法用デバイス市場規模は2032年までに123億3,000万米ドルに達する見込みです。同レポートでは、現在の市場力学を詳細に洞察し、将来の市場成長に関する分析を提供しています。
光線力学的療法(PDT)デバイスは、光線力学的療法に使用される医療機器です。この治療法では、光増感剤と呼ばれる光に反応する薬剤を特定の波長の光と組み合わせて使用し、様々な病状を治療します。光増感剤は患者に投与され、特定の波長の光によって活性化されると、酸素を発生させ、標的となる異常細胞や疾患細胞を含む近くの細胞を破壊するのに役立ちます。
ある種のがん、皮膚疾患、眼科疾患などの発症率の上昇が、光線力学的療法を含む革新的で効果的な治療法に対する需要の一因となっています。光増感剤、光源、PDT装置の開発における継続的な技術進歩により、光線力学的療法の有効性と安全性が向上し、より高度な装置への需要が高まっています。
さらに、非侵襲性や低侵襲性、選択的ターゲティングの可能性など、PDTの利点に対する医療従事者や患者の意識の高まりが、より大きな受容と需要につながっています。
米国食品医薬品局による製品認可の急増、光線力学的療法による光線力学的角化症の治療とケアの採用増加、光線力学的療法サービスを提供する美容師の増加が、北米の光線力学的療法市場を促進しています。2021年12月、バイオフロンテラ社は、AK(光線力学的角化症)治療のための光線力学的療法(PDT)の忍容性と安全性を評価することを目的とした第1相試験において、同社のBF-RhodoLED XLランプとアメルース3本の併用による最初の被験者の登録を報告しました。このような製品承認は、この地域の市場成長を刺激するものと思われます。
2022年1月に更新された米国がん協会のデータによると、米国では新たに約1,918,030人のがん患者と609,360人のがん関連死が発生すると予測されています。より的を絞ったがん対策への介入が急務であり、早期発見・治療法の強化への投資と相まって、がん死亡率の低下を促進する可能性があります。その結果、がん罹患率の上昇が治療需要を促進し、同地域の市場成長を加速させると予測されます。
光線力学的療法用デバイス市場レポートハイライト
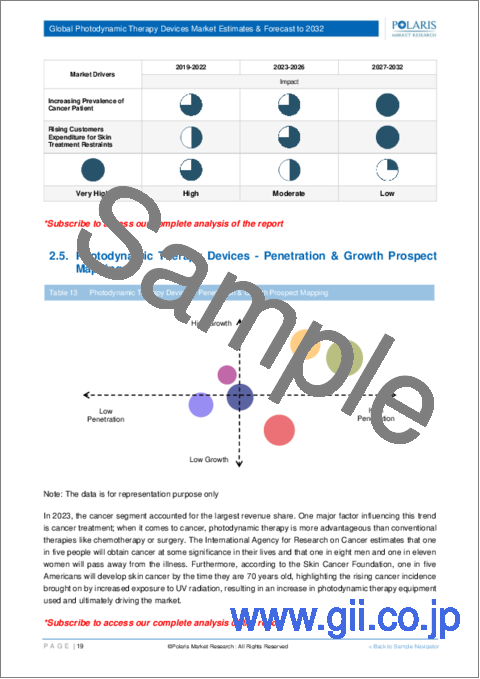
2023年、がん分野が最大の収益シェアを占める。光線力学的療法は、皮膚がん(基底細胞がんや扁平上皮がんなど)、肺がん、食道がん、ある種の頭頸部がんなど、さまざまな種類のがんの治療に有効であることが証明されています。腫瘍学におけるその多様な用途により、さまざまな形態の疾患を治療するための貴重なツールとなっています。
包括的なインフラと専門的な医療スタッフにより、病院はPDTの実施に理想的な環境となっています。
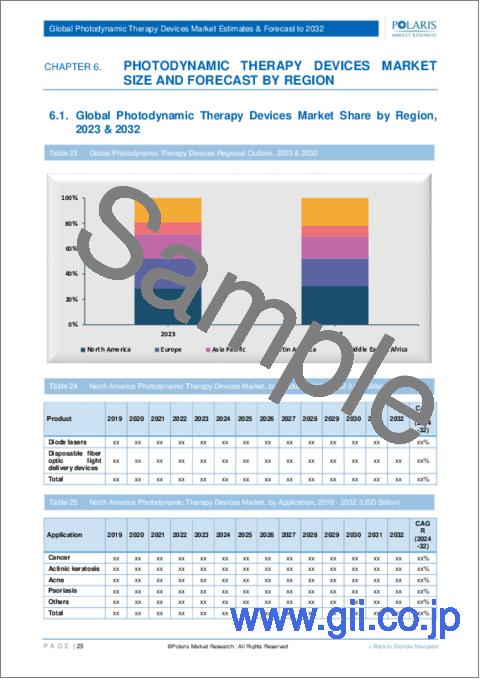
2023年には、北米が最大の市場シェアを占めたが、これは高いヘルスケア支出、高度なヘルスケアインフラ、強力な医療研究開発拠点、米国食品医薬品局(FDA)などの北米の規制機関が厳格な評価プロセスで知られているためです。
目次
第1章 イントロダクション
第2章 エグゼクティブサマリー
第3章 調査手法
第4章 世界の光線力学的療法用デバイス市場の洞察
- 光線力学的療法用デバイス市場- 最終用途スナップショット
- 光線力学的療法用デバイス市場力学
- 促進要因と機会
- がん患者の罹患率の増加
- スキンケア制限に対する顧客の支出増加
- 抑制要因と課題
- 治療期間の延長
- 促進要因と機会
- PESTEL分析
- 光線力学的療法用デバイス市場の最終用途の動向
- バリューチェーン分析
- COVID-19の影響分析
第5章 世界の光線力学的療法用デバイス市場、製品別
- 主な調査結果
- イントロダクション
- ダイオードレーザー
- 使い捨て光ファイバー光伝送装置
第6章 世界の光線力学的療法用デバイス市場、用途別
- 主な調査結果
- イントロダクション
- がん
- 日光角化症
- ニキビ
- 乾癬
- その他
第7章 世界の光線力学的療法用デバイス市場、最終用途別
- 主な調査結果
- イントロダクション
- 病院
- クリニックおよび皮膚科センター
- その他
第8章 世界の光線力学的療法用デバイス市場、地域別
- 主な調査結果
- イントロダクション
- 光線力学的療法用デバイス市場評価、地域別、2019-2032年
- 光線力学的療法用デバイス市場-北米
- 北米:光線力学的療法用デバイス市場、製品別、2019年~2032年
- 北米:光線力学的療法用デバイス市場、最終用途別、2019年~2032年
- 北米:光線力学的療法用デバイス市場、用途別、2019年~2032年
- 光線力学的療法用デバイス市場-米国
- 光線力学的療法用デバイス市場- カナダ
- 光線力学的療法用デバイス市場- 欧州
- 欧州:光線力学的療法用デバイス市場、製品別、2019-2032年
- 欧州:光線力学的療法用デバイス市場、最終用途別、2019-2032年
- 欧州:光線力学的療法用デバイス市場、用途別、2019-2032年
- 光線力学的療法用デバイス市場- 英国
- 光線力学的療法用デバイス市場- フランス
- 光線力学的療法用デバイス市場- ドイツ
- 光線力学的療法用デバイス市場- イタリア
- 光線力学的療法用デバイス市場- スペイン
- 光線力学的療法用デバイス市場- オランダ
- 光線力学的療法用デバイス市場- ロシア
- 光線力学的療法用デバイス市場- アジア太平洋地域
- アジア太平洋地域:光線力学的療法用デバイス市場、製品別、2019-2032年
- アジア太平洋地域:光線力学的療法用デバイス市場、最終用途別、2019-2032年
- アジア太平洋地域:光線力学的療法用デバイス市場、用途別、2019-2032年
- 光線力学的療法用デバイス市場- 中国
- 光線力学的療法用デバイス市場- インド
- 光線力学的療法用デバイス市場- マレーシア
- 光線力学的療法用デバイス市場- 日本
- 光線力学的療法用デバイス市場- インドネシア
- 光線力学的療法用デバイス市場- 韓国
- 光線力学的療法用デバイス市場-中東およびアフリカ
- 中東およびアフリカ:光線力学的療法用デバイス市場、製品別、2019-2032年
- 中東およびアフリカ:光線力学的療法用デバイス市場、最終用途別、2019-2032年
- 中東およびアフリカ:光線力学的療法用デバイス市場、用途別、2019-2032年
- 光線力学的療法用デバイス市場- サウジアラビア
- 光線力学的療法用デバイス市場-UAE
- 光線力学的療法用デバイス市場- イスラエル
- 光線力学的療法用デバイス市場- 南アフリカ
- 光線力学的療法用デバイス市場-ラテンアメリカ
- ラテンアメリカ:光線力学的療法用デバイス市場、製品別、2019年~2032年
- ラテンアメリカ:光線力学的療法用デバイス市場、最終用途別、2019-2032年
- ラテンアメリカ:光線力学的療法用デバイス市場、用途別、2019年~2032年
- 光線力学的療法用デバイス市場- メキシコ
- 光線力学的療法用デバイス市場- ブラジル
- 光線力学的療法用デバイス市場- アルゼンチン
第9章 競合情勢
- 拡大と買収の分析
- 拡大
- 買収
- パートナーシップ/コラボレーション/契約/公開
第10章 企業プロファイル
- Biolitec AG
- Boston Scientific Corporation
- Candela Corporation
- Coherent Corp.
- Cutera Inc.
- Excel Lasers
- IRIDEX Corporation
- Lumibird Medical
- Modulight USA Inc.
- ShangHai Apolo Medical Technology Co.,Ltd
List of Tables
- Table 1 Global Photodynamic Therapy Devices Market, by Product, 2019-2032 (USD Billion)
- Table 2 Global Photodynamic Therapy Devices Market, by Application, 2019-2032 (USD Billion)
- Table 3 Global Photodynamic Therapy Devices Market, by End Use, 2019-2032 (USD Billion)
- Table 4 Photodynamic Therapy Devices Market Assessment, By Geography, 2019-2032 (USD Billion)
- Table 5 North America: Photodynamic Therapy Devices Market, by Product, 2019-2032 (USD Billion)
- Table 6 North America: Photodynamic Therapy Devices Market, by Application, 2019-2032 (USD Billion)
- Table 7 North America: Photodynamic Therapy Devices Market, by End Use, 2019-2032 (USD Billion)
- Table 8 U.S.: Photodynamic Therapy Devices Market, by Product, 2019-2032 (USD Billion)
- Table 9 U.S.: Photodynamic Therapy Devices Market, by Application, 2019-2032 (USD Billion)
- Table 10 U.S.: Photodynamic Therapy Devices Market, by End Use, 2019-2032 (USD Billion)
- Table 11 Canada: Photodynamic Therapy Devices Market, by Product, 2019-2032 (USD Billion)
- Table 12 Canada: Photodynamic Therapy Devices Market, by Application, 2019-2032 (USD Billion)
- Table 13 Canada: Photodynamic Therapy Devices Market, by End Use, 2019-2032 (USD Billion)
- Table 14 Europe: Photodynamic Therapy Devices Market, by Product, 2019-2032 (USD Billion)
- Table 15 Europe: Photodynamic Therapy Devices Market, by Application, 2019-2032 (USD Billion)
- Table 16 Europe: Photodynamic Therapy Devices Market, by End Use, 2019-2032 (USD Billion)
- Table 17 UK: Photodynamic Therapy Devices Market, by Product, 2019-2032 (USD Billion)
- Table 18 UK: Photodynamic Therapy Devices Market, by Application, 2019-2032 (USD Billion)
- Table 19 UK: Photodynamic Therapy Devices Market, by End Use, 2019-2032 (USD Billion)
- Table 20 France: Photodynamic Therapy Devices Market, by Product, 2019-2032 (USD Billion)
- Table 21 France: Photodynamic Therapy Devices Market, by Application, 2019-2032 (USD Billion)
- Table 22 France: Photodynamic Therapy Devices Market, by End Use, 2019-2032 (USD Billion)
- Table 23 Germany: Photodynamic Therapy Devices Market, by Product, 2019-2032 (USD Billion)
- Table 24 Germany: Photodynamic Therapy Devices Market, by Application, 2019-2032 (USD Billion)
- Table 25 Germany: Photodynamic Therapy Devices Market, by End Use, 2019-2032 (USD Billion)
- Table 26 Italy: Photodynamic Therapy Devices Market, by Product, 2019-2032 (USD Billion)
- Table 27 Italy: Photodynamic Therapy Devices Market, by Application, 2019-2032 (USD Billion)
- Table 28 Italy: Photodynamic Therapy Devices Market, by End Use, 2019-2032 (USD Billion)
- Table 29 Spain: Photodynamic Therapy Devices Market, by Product, 2019-2032 (USD Billion)
- Table 30 Spain: Photodynamic Therapy Devices Market, by Application, 2019-2032 (USD Billion)
- Table 31 Spain: Photodynamic Therapy Devices Market, by End Use, 2019-2032 (USD Billion)
- Table 32 Netherlands: Photodynamic Therapy Devices Market, by Product, 2019-2032 (USD Billion)
- Table 33 Netherlands: Photodynamic Therapy Devices Market, by Application, 2019-2032 (USD Billion)
- Table 34 Netherlands: Photodynamic Therapy Devices Market, by End Use, 2019-2032 (USD Billion)
- Table 35 Russia: Photodynamic Therapy Devices Market, by Product, 2019-2032 (USD Billion)
- Table 36 Russia: Photodynamic Therapy Devices Market, by Application, 2019-2032 (USD Billion)
- Table 37 Russia: Photodynamic Therapy Devices Market, by End Use, 2019-2032 (USD Billion)
- Table 38 Asia Pacific: Photodynamic Therapy Devices Market, by Product, 2019-2032 (USD Billion)
- Table 39 Asia Pacific: Photodynamic Therapy Devices Market, by Application, 2019-2032 (USD Billion)
- Table 40 Asia Pacific: Photodynamic Therapy Devices Market, by End Use, 2019-2032 (USD Billion)
- Table 41 China: Photodynamic Therapy Devices Market, by Product, 2019-2032 (USD Billion)
- Table 42 China: Photodynamic Therapy Devices Market, by Application, 2019-2032 (USD Billion)
- Table 43 China: Photodynamic Therapy Devices Market, by End Use, 2019-2032 (USD Billion)
- Table 44 India: Photodynamic Therapy Devices Market, by Product, 2019-2032 (USD Billion)
- Table 45 India: Photodynamic Therapy Devices Market, by Application, 2019-2032 (USD Billion)
- Table 46 India: Photodynamic Therapy Devices Market, by End Use, 2019-2032 (USD Billion)
- Table 47 Malaysia: Photodynamic Therapy Devices Market, by Product, 2019-2032 (USD Billion)
- Table 48 Malaysia: Photodynamic Therapy Devices Market, by Application, 2019-2032 (USD Billion)
- Table 49 Malaysia: Photodynamic Therapy Devices Market, by End Use, 2019-2032 (USD Billion)
- Table 50 Japan: Photodynamic Therapy Devices Market, by Product, 2019-2032 (USD Billion)
- Table 51 Japan: Photodynamic Therapy Devices Market, by Application, 2019-2032 (USD Billion)
- Table 52 Japan: Photodynamic Therapy Devices Market, by End Use, 2019-2032 (USD Billion)
- Table 53 Indonesia: Photodynamic Therapy Devices Market, by Product, 2019-2032 (USD Billion)
- Table 54 Indonesia: Photodynamic Therapy Devices Market, by Application, 2019-2032 (USD Billion)
- Table 55 Indonesia: Photodynamic Therapy Devices Market, by End Use, 2019-2032 (USD Billion)
- Table 56 South Korea: Photodynamic Therapy Devices Market, by Product, 2019-2032 (USD Billion)
- Table 57 South Korea: Photodynamic Therapy Devices Market, by Application, 2019-2032 (USD Billion)
- Table 58 South Korea: Photodynamic Therapy Devices Market, by End Use, 2019-2032 (USD Billion)
- Table 59 Middle East & Africa: Photodynamic Therapy Devices Market, by Product, 2019-2032 (USD Billion)
- Table 60 Middle East & Africa: Photodynamic Therapy Devices Market, by Application, 2019-2032 (USD Billion)
- Table 61 Middle East & Africa: Photodynamic Therapy Devices Market, by End Use, 2019-2032 (USD Billion)
- Table 62 Saudi Arabia: Photodynamic Therapy Devices Market, by Product, 2019-2032 (USD Billion)
- Table 63 Saudi Arabia: Photodynamic Therapy Devices Market, by Application, 2019-2032 (USD Billion)
- Table 64 Saudi Arabia: Photodynamic Therapy Devices Market, by End Use, 2019-2032 (USD Billion)
- Table 65 UAE: Photodynamic Therapy Devices Market, by Product, 2019-2032 (USD Billion)
- Table 66 UAE: Photodynamic Therapy Devices Market, by Application, 2019-2032 (USD Billion)
- Table 67 UAE: Photodynamic Therapy Devices Market, by End Use, 2019-2032 (USD Billion)
- Table 68 Israel: Photodynamic Therapy Devices Market, by Product, 2019-2032 (USD Billion)
- Table 69 Israel: Photodynamic Therapy Devices Market, by Application, 2019-2032 (USD Billion)
- Table 70 Israel: Photodynamic Therapy Devices Market, by End Use, 2019-2032 (USD Billion)
- Table 71 South Africa: Photodynamic Therapy Devices Market, by Product, 2019-2032 (USD Billion)
- Table 72 South Africa: Photodynamic Therapy Devices Market, by Application, 2019-2032 (USD Billion)
- Table 73 South Africa: Photodynamic Therapy Devices Market, by End Use, 2019-2032 (USD Billion)
- Table 74 Latin America: Photodynamic Therapy Devices Market, by Product, 2019-2032 (USD Billion)
- Table 75 Latin America: Photodynamic Therapy Devices Market, by Application, 2019-2032 (USD Billion)
- Table 76 Latin America: Photodynamic Therapy Devices Market, by End Use, 2019-2032 (USD Billion)
- Table 77 Mexico: Photodynamic Therapy Devices Market, by Product, 2019-2032 (USD Billion)
- Table 78 Mexico: Photodynamic Therapy Devices Market, by Application, 2019-2032 (USD Billion)
- Table 79 Mexico: Photodynamic Therapy Devices Market, by End Use, 2019-2032 (USD Billion)
- Table 80 Brazil: Photodynamic Therapy Devices Market, by Product, 2019-2032 (USD Billion)
- Table 81 Brazil: Photodynamic Therapy Devices Market, by Application, 2019-2032 (USD Billion)
- Table 82 Brazil: Photodynamic Therapy Devices Market, by End Use, 2019-2032 (USD Billion)
- Table 83 Argentina: Photodynamic Therapy Devices Market, by Product, 2019-2032 (USD Billion)
- Table 84 Argentina: Photodynamic Therapy Devices Market, by Application, 2019-2032 (USD Billion)
- Table 85 Argentina: Photodynamic Therapy Devices Market, by End Use, 2019-2032 (USD Billion)
List of Figures
- Figure 1. Global Photodynamic Therapy Devices Market, 2019-2032 (USD Billion)
- Figure 2. Integrated Ecosystem
- Figure 3. Research Methodology: Top-Down & Bottom-Up Approach
- Figure 4. Market by Geography
- Figure 5. Porter's Five Forces
- Figure 6. Market by Application
- Figure 7. Global Photodynamic Therapy Devices Market, by Application, 2022 & 2032 (USD Billion)
- Figure 8. Market by Product
- Figure 9. Global Photodynamic Therapy Devices Market, by Product, 2022 & 2032 (USD Billion)
- Figure 10. Market by End Use
- Figure 11. Global Photodynamic Therapy Devices Market, by End Use, 2022 & 2032 (USD Billion)
- Figure 12. Photodynamic Therapy Devices Market Assessment, By Geography, 2019-2032 (USD Billion)
- Figure 13. Strategic Analysis - Photodynamic Therapy Devices Market
The global photodynamic therapy devices market size is expected to reach USD 12.33 billion by 2032, according to a new study by Polaris Market Research. The report "Photodynamic Therapy Devices Market Share, Size, Trends, Industry Analysis Report, By Product (Diode Laser and Disposable Fiber Optic Light Delivery Devices); By Application; By End Use; By Region; Segment Forecast, 2024 - 2032" gives a detailed insight into current market dynamics and provides analysis on future market growth.
Photodynamic therapy (PDT) devices are medical instruments used in photodynamic therapy. This treatment approach involves the use of light-sensitive drugs, known as photosensitizers, in combination with specific wavelengths of light to treat various medical conditions. The photosensitizer is administered to the patient, and when activated by light of a specific wavelength, it produces a form of oxygen that helps destroy nearby cells, including targeted abnormal or diseased cells.
The rise in the incidence of conditions such as certain types of cancer, skin disorders, and ophthalmic conditions has contributed to the demand for innovative and effective treatment modalities, including photodynamic therapy. Ongoing technological advancements in the development of photosensitizers, light sources, and PDT devices have improved the efficacy and safety of photodynamic therapy, driving demand for more sophisticated devices.
Furthermore, increased awareness among healthcare professionals and patients about the benefits of PDT, including its non-invasive or minimally invasive nature and its potential for selective targeting, has led to greater acceptance and demand.
A surge in product approvals granted by the United States Food and Drug Administration, increased adoption of photodynamic therapy for the treatment and care of actinic keratosis, and a growing number of cosmetologists offering photodynamic therapy services are propelling the photodynamic therapy market in North America. In December 2021, Biofrontera Inc. reported the enrollment of the first subject in a Phase 1 study aimed at assessing the tolerability and safety of photodynamic therapy (PDT) for treating AK (actinic keratosis), utilizing three tubes of Ameluz in conjunction with the company's BF-RhodoLED XL lamp. Anticipated product approvals like these are poised to stimulate market growth in the region.
According to the American Cancer Society's data updated in January 2022, approximately 1,918,030 new cancer cases and 609,360 cancer-related deaths are projected to occur in the United States. The imperative for more targeted cancer control interventions, coupled with investments in enhanced early detection and treatment methods, could facilitate reductions in cancer mortality rates. Consequently, the rising incidence of cancer cases is expected to drive the demand for treatment, thereby accelerating market growth in the region.
Photodynamic Therapy Devices Market Report Highlights
In 2023, the cancer segment accounted for the largest revenue share. Photodynamic therapy has proven effective in the treatment of various types of cancer, including skin cancers (such as basal cell carcinoma and squamous cell carcinoma), lung cancer, esophageal cancer, and certain types of head and neck cancers. Its diverse applications in oncology make it a valuable tool for treating different forms of the disease.
The hospital segment is expected to witness the highest market share during the forecast period due to comprehensive infrastructure and specialized medical staff, which makes hospitals the ideal setting for conducting PDT procedures.
In 2023, North America accounted for the largest market share due to high healthcare expenditure, advanced healthcare infrastructure, strong medical research and development hub, and regulatory bodies in North America, such as the U.S. Food and Drug Administration (FDA), are known for their rigorous evaluation processes.
The global key market players include Biolitec AG, Boston Scientific Corporation, Candela Corporation, Coherent Corp., Cutera Inc., Excel Lasers, IRIDEX Corporation, and more.
Polaris Market Research has segmented the photodynamic therapy devices market report based on product, metal, biomaterial, end-use, and region:
Photodynamic Therapy Devices, Product Outlook (Revenue - USD Billion, 2019 - 2032)
- Diode lasers
- Disposable fiber optic light delivery devices
Photodynamic Therapy Devices, Application Outlook (Revenue - USD Billion, 2019 - 2032)
- Cancer
- Actinic keratosis
- Acne
- Psoriasis
- Others
Photodynamic Therapy Devices, End Use Outlook (Revenue - USD Billion, 2019 - 2032)
- Hospitals
- Clinics and dermatology centers
- Others
Photodynamic Therapy Devices, Regional Outlook (Revenue - USD Billion, 2019 - 2032)
- North America
- U.S.
- Canada
- Europe
- Germany
- UK
- France
- Italy
- Spain
- Russia
- Netherlands
- Rest of Europe
- Asia Pacific
- China
- India
- Japan
- South Korea
- Indonesia
- Malaysia
- Australia
- Rest of APAC
- Latin America
- Argentina
- Brazil
- Mexico
- Rest of Latin America
- Middle East & Africa
- UAE
- Saudi Arabia
- Israel
- South Africa
- Rest of MEA
Table of Contents
1. Introduction
- 1.1. Report Description
- 1.1.1. Objectives of the Study
- 1.1.2. Market Scope
- 1.1.3. Assumptions
- 1.2. Stakeholders
2. Executive Summary
- 2.1. Market Highlights
3. Research Methodology
- 3.1. Overview
- 3.1.1. Data Mining
- 3.2. Data Sources
- 3.2.1. Primary Sources
- 3.2.2. Secondary Sources
4. Global Photodynamic Therapy Devices Market Insights
- 4.1. Photodynamic Therapy Devices Market - End Use Snapshot
- 4.2. Photodynamic Therapy Devices Market Dynamics
- 4.2.1. Drivers and Opportunities
- 4.2.1.1. Increasing Prevalence of Cancer Patient
- 4.2.1.2. Rising Customers Expenditure for Skin Treatment Restraints
- 4.2.2. Restraints and Challenges
- 4.2.2.1. Extended duration of therapy
- 4.2.1. Drivers and Opportunities
- 4.3. Porter's Five Forces Analysis
- 4.3.1. Bargaining Power of Suppliers (Moderate)
- 4.3.2. Threats of New Entrants: (Low)
- 4.3.3. Bargaining Power of Buyers (Moderate)
- 4.3.4. Threat of Substitute (Moderate)
- 4.3.5. Rivalry among existing firms (High)
- 4.4. PESTEL Analysis
- 4.5. Photodynamic Therapy Devices Market End Use Trends
- 4.6. Value Chain Analysis
- 4.7. COVID-19 Impact Analysis
5. Global Photodynamic Therapy Devices Market, by Product
- 5.1. Key Findings
- 5.2. Introduction
- 5.2.1. Global Photodynamic Therapy Devices Market, by Product, 2019-2032 (USD Billion)
- 5.3. Diode lasers
- 5.3.1. Global Photodynamic Therapy Devices Market, by Diode lasers, by Region, 2019-2032 (USD Billion)
- 5.4. Disposable fiber optic light delivery devices
- 5.4.1. Global Photodynamic Therapy Devices Market, by Disposable fiber optic light delivery devices, by Region, 2019-2032 (USD Billion)
6. Global Photodynamic Therapy Devices Market, by Application
- 6.1. Key Findings
- 6.2. Introduction
- 6.2.1. Global Photodynamic Therapy Devices Market, by Application, 2019-2032 (USD Billion)
- 6.3. Cancer
- 6.3.1. Global Photodynamic Therapy Devices Market, by Cancer, by Region, 2019-2032 (USD Billion)
- 6.4. Actinic keratosis
- 6.4.1. Global Photodynamic Therapy Devices Market, by Actinic keratosis, by Region, 2019-2032 (USD Billion)
- 6.5. Acne
- 6.5.1. Global Photodynamic Therapy Devices Market, by Acne, by Region, 2019-2032 (USD Billion)
- 6.6. Psoriasis
- 6.6.1. Global Photodynamic Therapy Devices Market, by Psoriasis, by Region, 2019-2032 (USD Billion)
- 6.7. Others
- 6.7.1. Global Photodynamic Therapy Devices Market, by Others, by Region, 2019-2032 (USD Billion)
7. Global Photodynamic Therapy Devices Market, by End Use
- 7.1. Key Findings
- 7.2. Introduction
- 7.2.1. Global Photodynamic Therapy Devices Market, by End Use, 2019-2032 (USD Billion)
- 7.3. Hospitals
- 7.3.1. Global Photodynamic Therapy Devices Market, by Hospitals, By Region, 2019-2032 (USD Billion)
- 7.4. Clinics and dermatology centers
- 7.4.1. Global Photodynamic Therapy Devices Market, by Clinics and dermatology centers, By Region, 2019-2032 (USD Billion)
- 7.5. Others
- 7.5.1. Global Photodynamic Therapy Devices Market, by Others, By Region, 2019-2032 (USD Billion)
8. Global Photodynamic Therapy Devices Market, by Geography
- 8.1. Key findings
- 8.2. Introduction
- 8.2.1. Photodynamic Therapy Devices Market Assessment, By Geography, 2019-2032 (USD Billion)
- 8.3. Photodynamic Therapy Devices Market - North America
- 8.3.1. North America: Photodynamic Therapy Devices Market, by Product, 2019-2032 (USD Billion)
- 8.3.2. North America: Photodynamic Therapy Devices Market, by End Use, 2019-2032 (USD Billion)
- 8.3.3. North America: Photodynamic Therapy Devices Market, by Application, 2019-2032 (USD Billion)
- 8.3.4. Photodynamic Therapy Devices Market - U.S.
- 8.3.4.1. U.S.: Photodynamic Therapy Devices Market, by Product, 2019-2032 (USD Billion)
- 8.3.4.2. U.S.: Photodynamic Therapy Devices Market, by End Use, 2019-2032 (USD Billion)
- 8.3.4.3. U.S.: Photodynamic Therapy Devices Market, by Application, 2019-2032 (USD Billion)
- 8.3.5. Photodynamic Therapy Devices Market - Canada
- 8.3.5.1. Canada: Photodynamic Therapy Devices Market, by Product, 2019-2032 (USD Billion)
- 8.3.5.2. Canada.: Photodynamic Therapy Devices Market, by End Use, 2019-2032 (USD Billion)
- 8.3.5.3. Canada: Photodynamic Therapy Devices Market, by Application, 2019-2032 (USD Billion)
- 8.4. Photodynamic Therapy Devices Market - Europe
- 8.4.1. Europe: Photodynamic Therapy Devices Market, by Product, 2019-2032 (USD Billion)
- 8.4.2. Europe.: Photodynamic Therapy Devices Market, by End Use, 2019-2032 (USD Billion)
- 8.4.3. Europe: Photodynamic Therapy Devices Market, by Application, 2019-2032 (USD Billion)
- 8.4.4. Photodynamic Therapy Devices Market - UK
- 8.4.4.1. UK: Photodynamic Therapy Devices Market, by Product, 2019-2032 (USD Billion)
- 8.4.4.2. UK.: Photodynamic Therapy Devices Market, by End Use, 2019-2032 (USD Billion)
- 8.4.4.3. UK: Photodynamic Therapy Devices Market, by Application, 2019-2032 (USD Billion)
- 8.4.5. Photodynamic Therapy Devices Market - France
- 8.4.5.1. France: Photodynamic Therapy Devices Market, by Product, 2019-2032 (USD Billion)
- 8.4.5.2. France.: Photodynamic Therapy Devices Market, by End Use, 2019-2032 (USD Billion)
- 8.4.5.3. France: Photodynamic Therapy Devices Market, by Application, 2019-2032 (USD Billion)
- 8.4.6. Photodynamic Therapy Devices Market - Germany
- 8.4.6.1. Germany: Photodynamic Therapy Devices Market, by Product, 2019-2032 (USD Billion)
- 8.4.6.2. Germany.: Photodynamic Therapy Devices Market, by End Use, 2019-2032 (USD Billion)
- 8.4.6.3. Germany: Photodynamic Therapy Devices Market, by Application, 2019-2032 (USD Billion)
- 8.4.7. Photodynamic Therapy Devices Market - Italy
- 8.4.7.1. Italy: Photodynamic Therapy Devices Market, by Product, 2019-2032 (USD Billion)
- 8.4.7.2. Italy.: Photodynamic Therapy Devices Market, by End Use, 2019-2032 (USD Billion)
- 8.4.7.3. Italy: Photodynamic Therapy Devices Market, by Application, 2019-2032 (USD Billion)
- 8.4.8. Photodynamic Therapy Devices Market - Spain
- 8.4.8.1. Spain: Photodynamic Therapy Devices Market, by Product, 2019-2032 (USD Billion)
- 8.4.8.2. Spain.: Photodynamic Therapy Devices Market, by End Use, 2019-2032 (USD Billion)
- 8.4.8.3. Spain: Photodynamic Therapy Devices Market, by Application, 2019-2032 (USD Billion)
- 8.4.9. Photodynamic Therapy Devices Market - Netherlands
- 8.4.9.1. Netherlands: Photodynamic Therapy Devices Market, by Product, 2019-2032 (USD Billion)
- 8.4.9.2. Netherlands.: Photodynamic Therapy Devices Market, by End Use, 2019-2032 (USD Billion)
- 8.4.9.3. Netherlands: Photodynamic Therapy Devices Market, by Application, 2019-2032 (USD Billion)
- 8.4.10. Photodynamic Therapy Devices Market - Russia
- 8.4.10.1. Russia: Photodynamic Therapy Devices Market, by Product, 2019-2032 (USD Billion)
- 8.4.10.2. Russia.: Photodynamic Therapy Devices Market, by End Use, 2019-2032 (USD Billion)
- 8.4.10.3. Russia: Photodynamic Therapy Devices Market, by Application, 2019-2032 (USD Billion)
- 8.5. Photodynamic Therapy Devices Market - Asia Pacific
- 8.5.1. Asia Pacific: Photodynamic Therapy Devices Market, by Product, 2019-2032 (USD Billion)
- 8.5.2. Asia Pacific.: Photodynamic Therapy Devices Market, by End Use, 2019-2032 (USD Billion)
- 8.5.3. Asia Pacific: Photodynamic Therapy Devices Market, by Application, 2019-2032 (USD Billion)
- 8.5.4. Photodynamic Therapy Devices Market - China
- 8.5.4.1. China: Photodynamic Therapy Devices Market, by Product, 2019-2032 (USD Billion)
- 8.5.4.2. China.: Photodynamic Therapy Devices Market, by End Use, 2019-2032 (USD Billion)
- 8.5.4.3. China: Photodynamic Therapy Devices Market, by Application, 2019-2032 (USD Billion)
- 8.5.5. Photodynamic Therapy Devices Market - India
- 8.5.5.1. India: Photodynamic Therapy Devices Market, by Product, 2019-2032 (USD Billion)
- 8.5.5.2. India.: Photodynamic Therapy Devices Market, by End Use, 2019-2032 (USD Billion)
- 8.5.5.3. India: Photodynamic Therapy Devices Market, by Application, 2019-2032 (USD Billion)
- 8.5.6. Photodynamic Therapy Devices Market - Malaysia
- 8.5.6.1. Malaysia: Photodynamic Therapy Devices Market, by Product, 2019-2032 (USD Billion)
- 8.5.6.2. Malaysia.: Photodynamic Therapy Devices Market, by End Use, 2019-2032 (USD Billion)
- 8.5.6.3. Malaysia: Photodynamic Therapy Devices Market, by Application, 2019-2032 (USD Billion)
- 8.5.7. Photodynamic Therapy Devices Market - Japan
- 8.5.7.1. Japan: Photodynamic Therapy Devices Market, by Product, 2019-2032 (USD Billion)
- 8.5.7.2. Japan.: Photodynamic Therapy Devices Market, by End Use, 2019-2032 (USD Billion)
- 8.5.7.3. Japan: Photodynamic Therapy Devices Market, by Application, 2019-2032 (USD Billion)
- 8.5.8. Photodynamic Therapy Devices Market - Indonesia
- 8.5.8.1. Indonesia: Photodynamic Therapy Devices Market, by Product, 2019-2032 (USD Billion)
- 8.5.8.2. Indonesia.: Photodynamic Therapy Devices Market, by End Use, 2019-2032 (USD Billion)
- 8.5.8.3. Indonesia: Photodynamic Therapy Devices Market, by Application, 2019-2032 (USD Billion)
- 8.5.9. Photodynamic Therapy Devices Market - South Korea
- 8.5.9.1. South Korea: Photodynamic Therapy Devices Market, by Product, 2019-2032 (USD Billion)
- 8.5.9.2. South Korea.: Photodynamic Therapy Devices Market, by End Use, 2019-2032 (USD Billion)
- 8.5.9.3. South Korea: Photodynamic Therapy Devices Market, by Application, 2019-2032 (USD Billion)
- 8.6. Photodynamic Therapy Devices Market - Middle East & Africa
- 8.6.1. Middle East & Africa: Photodynamic Therapy Devices Market, by Product, 2019-2032 (USD Billion)
- 8.6.2. Middle East & Africa.: Photodynamic Therapy Devices Market, by End Use, 2019-2032 (USD Billion)
- 8.6.3. Middle East & Africa: Photodynamic Therapy Devices Market, by Application, 2019-2032 (USD Billion)
- 8.6.4. Photodynamic Therapy Devices Market - Saudi Arabia
- 8.6.4.1. Saudi Arabia: Photodynamic Therapy Devices Market, by Product, 2019-2032 (USD Billion)
- 8.6.4.2. Saudi Arabia.: Photodynamic Therapy Devices Market, by End Use, 2019-2032 (USD Billion)
- 8.6.4.3. Saudi Arabia: Photodynamic Therapy Devices Market, by Application, 2019-2032 (USD Billion)
- 8.6.5. Photodynamic Therapy Devices Market - UAE
- 8.6.5.1. UAE: Photodynamic Therapy Devices Market, by Product, 2019-2032 (USD Billion)
- 8.6.5.2. UAE.: Photodynamic Therapy Devices Market, by End Use, 2019-2032 (USD Billion)
- 8.6.5.3. UAE: Photodynamic Therapy Devices Market, by Application, 2019-2032 (USD Billion)
- 8.6.6. Photodynamic Therapy Devices Market - Israel
- 8.6.6.1. Israel: Photodynamic Therapy Devices Market, by Product, 2019-2032 (USD Billion)
- 8.6.6.2. Israel.: Photodynamic Therapy Devices Market, by End Use, 2019-2032 (USD Billion)
- 8.6.6.3. Israel: Photodynamic Therapy Devices Market, by Application, 2019-2032 (USD Billion)
- 8.6.7. Photodynamic Therapy Devices Market - South Africa
- 8.6.7.1. South Africa: Photodynamic Therapy Devices Market, by Product, 2019-2032 (USD Billion)
- 8.6.7.2. South Africa.: Photodynamic Therapy Devices Market, by End Use, 2019-2032 (USD Billion)
- 8.6.7.3. South Africa: Photodynamic Therapy Devices Market, by Application, 2019-2032 (USD Billion)
- 8.7. Photodynamic Therapy Devices Market - Latin America
- 8.7.1. Latin America: Photodynamic Therapy Devices Market, by Product, 2019-2032 (USD Billion)
- 8.7.2. Latin America.: Photodynamic Therapy Devices Market, by End Use, 2019-2032 (USD Billion)
- 8.7.3. Latin America: Photodynamic Therapy Devices Market, by Application, 2019-2032 (USD Billion)
- 8.7.4. Photodynamic Therapy Devices Market - Mexico
- 8.7.4.1. Mexico: Photodynamic Therapy Devices Market, by Product, 2019-2032 (USD Billion)
- 8.7.4.2. Mexico.: Photodynamic Therapy Devices Market, by End Use, 2019-2032 (USD Billion)
- 8.7.4.3. Mexico: Photodynamic Therapy Devices Market, by Application, 2019-2032 (USD Billion)
- 8.7.5. Photodynamic Therapy Devices Market - Brazil
- 8.7.5.1. Brazil: Photodynamic Therapy Devices Market, by Product, 2019-2032 (USD Billion)
- 8.7.5.2. Brazil.: Photodynamic Therapy Devices Market, by End Use, 2019-2032 (USD Billion)
- 8.7.5.3. Brazil: Photodynamic Therapy Devices Market, by Application, 2019-2032 (USD Billion)
- 8.7.6. Photodynamic Therapy Devices Market - Argentina
- 8.7.6.1. Argentina: Photodynamic Therapy Devices Market, by Product, 2019-2032 (USD Billion)
- 8.7.6.2. Argentina.: Photodynamic Therapy Devices Market, by End Use, 2019-2032 (USD Billion)
- 8.7.6.3. Argentina: Photodynamic Therapy Devices Market, by Application, 2019-2032 (USD Billion)
9. Competitive Landscape
- 9.1. Expansion and Acquisition Analysis
- 9.1.1. Expansion
- 9.1.2. Acquisitions
- 9.2. Partnerships/Collaborations/Agreements/Exhibitions
10. Company Profiles
- 10.1. Biolitec AG
- 10.1.1. Company Overview
- 10.1.2. Financial Performance
- 10.1.3. Product Benchmarking
- 10.1.4. Recent Development
- 10.2. Boston Scientific Corporation
- 10.2.1. Company Overview
- 10.2.2. Financial Performance
- 10.2.3. Product Benchmarking
- 10.2.4. Recent Development
- 10.3. Candela Corporation
- 10.3.1. Company Overview
- 10.3.2. Financial Performance
- 10.3.3. Product Benchmarking
- 10.3.4. Recent Development
- 10.4. Coherent Corp.
- 10.4.1. Company Overview
- 10.4.2. Financial Performance
- 10.4.3. Product Benchmarking
- 10.4.4. Recent Development
- 10.5. Cutera Inc.
- 10.5.1. Company Overview
- 10.5.2. Financial Performance
- 10.5.3. Product Benchmarking
- 10.5.4. Recent Development
- 10.6. Excel Lasers
- 10.6.1. Company Overview
- 10.6.2. Financial Performance
- 10.6.3. Product Benchmarking
- 10.6.4. Recent Development
- 10.7. IRIDEX Corporation
- 10.7.1. Company Overview
- 10.7.2. Financial Performance
- 10.7.3. Product Benchmarking
- 10.7.4. Recent Development
- 10.8. Lumibird Medical
- 10.8.1. Company Overview
- 10.8.2. Financial Performance
- 10.8.3. Product Benchmarking
- 10.8.4. Recent Development
- 10.9. Modulight USA Inc.
- 10.9.1. Company Overview
- 10.9.2. Financial Performance
- 10.9.3. Product Benchmarking
- 10.9.4. Recent Development
- 10.10. ShangHai Apolo Medical Technology Co.,Ltd
- 10.10.1. Company Overview
- 10.10.2. Financial Performance
- 10.10.3. Product Benchmarking
- 10.10.4. Recent Development

