|
|
市場調査レポート
商品コード
1495345
PACS(医療用画像管理システム)の世界市場:産業分析、規模、シェア、成長、動向、予測、2024~2033年Picture Archiving and Communication System Market: Global Industry Analysis, Size, Share, Growth, Trends, and Forecast, 2024-2033 |
||||||

|
|||||||
カスタマイズ可能
|
|||||||

| PACS(医療用画像管理システム)の世界市場:産業分析、規模、シェア、成長、動向、予測、2024~2033年 |
|
出版日: 2024年06月07日
発行: Persistence Market Research
ページ情報: 英文 250 Pages
納期: 2~5営業日
|

全表示
- 概要
- 目次
当レポートは、世界のPACS(医療用画像管理システム)市場のダイナミクスを深く掘り下げた包括的な分析を提供します。極めて重要な市場勢力、成長触媒、障害、急成長するトレンドに焦点を当て、貴重な洞察を提供します。2024~2033年までのPACS市場の軌跡を綿密に描き、豊富なデータと統計データを提示し、利害関係者に戦略的意思決定と情報に基づいた市場ナビゲーションのための強固な基盤を提供します。
主な洞察
- PACS市場規模(2024年推定):31億5,526万米ドル
- 予測市場規模(2033年予測):58億870万米ドル
- 世界市場の成長率(CAGR 2024~2033年):7.0%
PACS市場 - 調査範囲:
ヘルスケア施設におけるPACS導入の増加は、効率的な画像管理と合理化されたワークフローの必要性に起因し、市場成長の原動力となっています。PACSシステムは、医療画像の保存、検索、管理、配布、提示を可能にし、最新の診断業務に不可欠です。デジタルヘルスケアへのシフトは、政府のイニシアティブと資金援助によって支えられており、PACS市場を推進しています。画像技術の進歩は、AIや機械学習の統合と相まって、診断精度とワークフロー効率を高める。PACSの需要は、慢性疾患の有病率の上昇と人口の高齢化による画像処理手順の量の増加によってさらに促進されます。当レポートでは、コンポーネント別、画像モダリティ別、エンドユーザー別、地域別の市場内訳など、市場力学の詳細な分析を行い、利害関係者に包括的な洞察を提供しています。
市場促進要因:
ヘルスケアにおける効率的で統合された画像管理ソリューションへのニーズの高まりがPACS市場を牽引。慢性疾患の蔓延、高齢化、画像モダリティの技術進歩による画像診断手技の増加により、PACSの導入が必要となっています。従来のフィルムベースのシステムからデジタルシステムへの移行は、画像の保存、検索、共有の面で大きな利点をもたらし、臨床上の意思決定や患者のケアを強化します。政府のイニシアチブと資金援助がデジタルヘルスケアシステムの導入をサポートし、PACS市場をさらに後押ししています。PACSと電子カルテ(EHR)や病院情報システム(HIS)との統合は、ワークフローを合理化し、医療提供を改善します。AIと機械学習の進歩がPACSの機能を強化し、診断ツールの強化と業務効率の向上を実現します。膨大な量の画像データを管理する上で、費用対効果が高く効率的なソリューションが求められていることも、市場成長の原動力となっています。
市場の抑制要因
PACSの導入・保守コストが高いことが、特に中小規模のヘルスケア施設にとっては市場成長の大きな課題となっています。ハードウェア、ソフトウェア、トレーニングなど、PACSインフラに必要な初期投資は多額になる可能性があります。さらに、システムの更新、データの保存、メンテナンスに関連する継続的なコストが経済的負担を増大させる。異なるPACSシステムと他のヘルスケアITシステム間の相互運用性の問題は、シームレスなデータ統合と共有を妨げ、ワークフローの効率に影響を与える可能性があります。PACSと既存のヘルスケアシステムとの統合の複雑さは、多大な時間とリソースを必要とする場合があります。PACSシステムは機密性の高い医療情報を扱うため、データセキュリティや患者のプライバシーに関する課題もあります。データ保護とコンプライアンスに関する規制状況が、PACS導入の複雑さとコストに拍車をかけています。限られた技術的専門知識とヘルスケア専門家の変化への抵抗が、PACSの導入をさらに妨げる可能性があります。
市場機会:
画像処理とITの技術的進歩は、PACS市場に大きな機会をもたらします。人工知能と機械学習のPACSへの統合は、診断精度と業務効率を高め、画像分析と解釈のための高度なツールを提供します。クラウドベースのPACSソリューションの採用増加により、拡張性があり、コスト効率が高く、安全なストレージオプションが提供され、ヘルスケア専門家間のリモートアクセスとコラボレーションが容易になります。遠隔医療や遠隔診断の台頭がPACSの需要をさらに押し上げ、地域を超えた効率的な画像共有やコンサルテーションを可能にしています。新興市場におけるヘルスケアインフラの拡大は、PACSプロバイダーに成長機会を提供します。PACSプロバイダーとヘルスケア機関の間の戦略的パートナーシップやコラボレーションは、イノベーションを促進し、市場へのリーチを向上させることができます。さらに、モバイルPACSソリューションの開発は、モバイルヘルスの拡大傾向をサポートし、ヘルスケア専門家が外出先から画像データにアクセスできるようにします。
本レポートで扱う主な質問
- PACS市場の予測CAGRは?
- 2024年末時点の世界のPACS市場の売上規模は?
- 2024年に最大の市場シェアを占めた国はどこか?
- 世界のPACS市場の主要プレイヤーは?
- 画像モダリティ別で最も急成長している市場セグメンテーションは?
目次
第1章 エグゼクティブサマリー
第2章 市場概要
- 市場範囲/分類
- 市場の定義/範囲/制限
第3章 主要な市場動向
- 市場に影響を与える主な動向
- 製品イノベーション/開発動向
第4章 価格分析
- サブスクリプション価格モデル
- 永久ライセンシング
第5章 世界のPACS(医療用画像管理システム)市場の需要(100万米ドル)分析
- 過去の市場金額(100万米ドル)分析、2019~2023年
- 現在および将来の市場金額(100万米ドル)予測、2024~2033年
- 前年比成長動向分析
- 絶対的な$機会分析
第6章 市場背景
- マクロ経済要因
- 予測要因 - 関連性と影響
- バリューチェーン
- COVID-19危機 - 影響評価
- 市場力学
第7章 世界のPACS(医療用画像管理システム)市場分析:展開タイプ別
- イントロダクション/主な調査結果
- 市場規模(100万米ドル)の実績分析:展開タイプ別、2019~2023年
- 現在および将来の市場規模(100万米ドル)分析と予測、展開タイプ別、2024~2033年
- ウェブベースPACS
- クラウドベースPACS
- オンプレミス
- 市場魅力分析:展開タイプ別
第8章 世界のPACS(医療用画像管理システム)市場分析:コンポーネント別
- イントロダクション/主な調査結果
- 市場規模(100万米ドル)の実績分析:コンポーネント別、2019~2023年
- 現在および将来の市場規模(100万米ドル)分析と予測、コンポーネント別、2024~2033年
- 画像モダリティ
- 安全ネットワーク
- ワークステーション・アーカイブ
- 市場魅力分析:コンポーネント別
第9章 世界のPACS(医療用画像管理システム)市場分析:ビジネスモデル別
- イントロダクション/主な調査結果
- 市場規模(100万米ドル)の実績分析:ビジネスモデル別、2019~2023年
- 現在および将来の市場規模(100万米ドル)分析と予測、ビジネスモデル別、2024~2033年
- 企業
- 部門別
- 市場魅力分析:ビジネスモデル別
第10章 世界のPACS(医療用画像管理システム)市場分析:エンドユーザー別
- イントロダクション/主な調査結果
- 市場規模(100万米ドル)の実績分析:エンドユーザー別、2019~2023年
- 現在および将来の市場規模(100万米ドル)分析と予測、エンドユーザー別、2024~2033年
- 病院
- クリニックイメージング
- 歯科医院
- 画像センター
- 診断センター
- 調査・学術機関
- 外来手術センター
- その他
- 市場魅力分析:エンドユーザー別
第11章 世界のPACS(医療用画像管理システム)市場分析
- イントロダクション/主な調査結果
- 市場規模(100万米ドル)の実績分析:地域別、2019~2023年
- 現在および将来の市場規模(100万米ドル)分析と予測、地域別、2024~2033年
- 北米
- ラテンアメリカ
- 欧州
- 東アジア
- 南アジア・太平洋
- 中東・アフリカ
- 市場魅力分析:地域別
第12章 北米のPACS(医療用画像管理システム)市場分析
第13章 ラテンアメリカのPACS(医療用画像管理システム)市場分析析
第14章 欧州のPACS(医療用画像管理システム)市場分析
第15章 南アジア・太平洋のPACS(医療用画像管理システム)市場分析
第16章 東アジアのPACS(医療用画像管理システム)市場分析
第17章 中東・アフリカのPACS(医療用画像管理システム)市場分析
第18章 PACS(医療用画像管理システム):主要国別分析
- 米国
- カナダ
- メキシコ
- ブラジル
- ドイツ
- イタリア
- フランス
- 英国
- スペイン
- ベネルクス
- ロシア
- その他の欧州
- 中国
- 日本
- 韓国
- インド
- マレーシア
- インドネシア
- シンガポール
- オーストラリア・ニュージーランド
- GCC諸国
- トルコ
- 南アフリカ
- その他の中東・アフリカ
第19章 市場構造分析
- 企業階層別市場分析
- 主要企業の市場シェア分析
- 市場プレゼンス分析
第20章 競合分析
- 競合ダッシュボード
- 競合ベンチマーク
- 競合の詳細
- GE Healthcare
- Siemens Healthineers
- Agfa-Gevaert Group
- Carestream Health
- Koninklijke Philips NV-(Philips Healthcare)
- FUJIFILM Medical Systems
- INFINITT Healthcare Co. Ltd.
- Merge Healthcare Solutions Inc.(an IBM company)
- Mckesson Corp
- Sectra AB
- Others
第21章 使用される仮定と頭字語
第22章 調査手法
Persistence Market Research has unveiled a comprehensive analysis delving deep into the dynamics of the global Picture Archiving and Communication System (PACS) Market. With a keen focus on pivotal market forces, growth catalysts, hurdles, and burgeoning trends, this report furnishes invaluable insights. It presents a wealth of data and statistics, meticulously charting the trajectory of the PACS Market from 2024 through 2033, offering stakeholders a robust foundation for strategic decision-making and informed market navigation.
Key Insights:
- PACS Market Size (2024 Estimate): US$ 3155.26 million
- Projected Market Value (2033 Forecast): US$ 5808.7 million
- Global Market Growth Rate (CAGR 2024 to 2033): 7.0%
PACS Market - Report Scope:
The increasing adoption of PACS in healthcare facilities drives market growth, attributed to the need for efficient image management and streamlined workflow. PACS systems enable storage, retrieval, management, distribution, and presentation of medical images, essential for modern diagnostic practices. The shift towards digital healthcare, supported by government initiatives and funding, propels the PACS market. Advances in imaging technology, coupled with the integration of AI and machine learning, enhance diagnostic accuracy and workflow efficiency. The demand for PACS is further fueled by the growing volume of imaging procedures due to the rising prevalence of chronic diseases and an aging population. The report provides a detailed analysis of the market dynamics, including market segmentation by component, imaging modality, end-user, and region, offering comprehensive insights for stakeholders.
Market Growth Drivers:
The growing need for efficient and integrated image management solutions in healthcare drives the PACS market. Increasing volumes of diagnostic imaging procedures due to the rising prevalence of chronic diseases, aging populations, and technological advancements in imaging modalities necessitate the adoption of PACS. The shift from traditional film-based systems to digital systems offers significant advantages in terms of storage, retrieval, and sharing of images, enhancing clinical decision-making and patient care. Government initiatives and funding support the adoption of digital healthcare systems, further propelling the PACS market. The integration of PACS with electronic health records (EHRs) and hospital information systems (HIS) streamlines workflows and improves healthcare delivery. Advances in AI and machine learning augment PACS capabilities, providing enhanced diagnostic tools and improving operational efficiency. The need for cost-effective and efficient solutions in managing vast amounts of imaging data also drives market growth.
Market Restraints:
High implementation and maintenance costs of PACS pose a significant challenge to market growth, particularly for small and medium-sized healthcare facilities. The initial investment required for PACS infrastructure, including hardware, software, and training, can be substantial. Additionally, ongoing costs associated with system updates, data storage, and maintenance add to the financial burden. Interoperability issues between different PACS systems and other healthcare IT systems can hinder seamless data integration and sharing, impacting workflow efficiency. The complexity of integrating PACS with existing healthcare systems may require significant time and resources. Concerns regarding data security and patient privacy also pose challenges, as PACS systems handle sensitive medical information. The regulatory landscape for data protection and compliance adds to the complexity and cost of implementing PACS. Limited technical expertise and resistance to change among healthcare professionals can further impede the adoption of PACS.
Market Opportunities:
Technological advancements in imaging and IT present significant opportunities for the PACS market. The integration of artificial intelligence and machine learning into PACS enhances diagnostic accuracy and operational efficiency, offering advanced tools for image analysis and interpretation. The increasing adoption of cloud-based PACS solutions provides scalable, cost-effective, and secure storage options, facilitating remote access and collaboration among healthcare professionals. The rise of telemedicine and remote diagnostics further drives the demand for PACS, enabling efficient image sharing and consultation across geographies. Expanding healthcare infrastructure in emerging markets offers growth opportunities for PACS providers, as these regions invest in modernizing their healthcare systems. Strategic partnerships and collaborations between PACS providers and healthcare institutions can drive innovation and improve market reach. Additionally, the development of mobile PACS solutions supports the growing trend of mobile health, providing healthcare professionals with access to imaging data on-the-go.
Key Questions Addressed in the Report:
- What is the Expected Value CAGR of the PACS Market?
- What is the Revenue Size of the Global PACS Market as of 2024-end?
- Which Country Held the Largest Market Share in 2024?
- Who are the Key Players in the Global PACS Market?
- Which is the Fastest-growing Segment of the Market by Imaging Modality?
Competitive Landscape and Business Strategies:
Prominent organizations like GE Healthcare, Siemens Healthineers, and Philips Healthcare lead the PACS market. GE Healthcare focuses on innovative PACS solutions, investing heavily in R&D to deliver advanced imaging and data management systems. Expanding its product portfolio and enhancing integration capabilities, GE Healthcare caters to diverse healthcare needs, fueling its market growth. Similarly, Siemens Healthineers emphasizes digital healthcare solutions, enhancing its market presence with robust PACS offerings. With strong partnerships and strategic alliances, Siemens ensures seamless integration and efficient workflows. Philips Healthcare leverages advanced technology to develop innovative PACS solutions, offering comprehensive support for diagnostic imaging. These companies prioritize technological innovation, seamless integration, and customer support, positioning themselves as leaders in the PACS market.
Key Companies Profiled:
- GE Healthcare
- Siemens Healthineers
- Philips Healthcare
- Agfa HealthCare
- Fujifilm Medical Systems
- Carestream Health
- Sectra AB
- Intelerad Medical Systems
- Merge Healthcare Solutions
- McKesson Corporation
- RamSoft Inc.
- INFINITT Healthcare
- Others
PACS Market Segmentation:
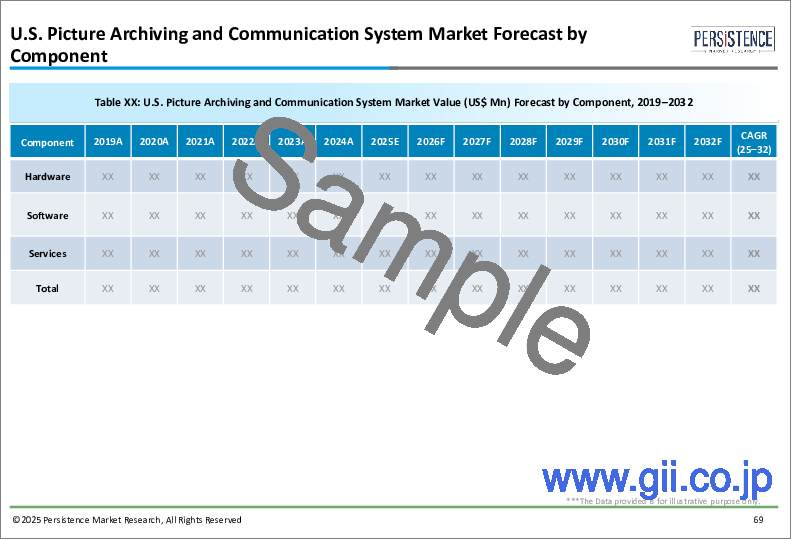
By Component:
- Hardware
- Software
- Services
By Imaging Modality:
- X-ray
- Computed Tomography (CT)
- Magnetic Resonance Imaging (MRI)
- Ultrasound
- Others
By End-User:
- Hospitals
- Diagnostic Centers
- Ambulatory Surgical Centers
- Clinics
By Region:
- North America
- Europe
- East Asia
- South Asia & Oceania
- Latin America
- Middle East & Africa
Table of Contents
1. Executive Summary
- 1.1. Global Market Outlook
- 1.2. Demand Side Trends
- 1.3. Supply Side Trends
- 1.4. Analysis and Recommendations
2. Market Overview
- 2.1. Market Coverage / Taxonomy
- 2.2. Market Definition / Scope / Limitations
3. Key Market Trends
- 3.1. Key Trends Impacting the Market
- 3.2. Product Innovation / Development Trends
4. Pricing Analysis
- 4.1. Subscription Pricing Model
- 4.2. Perpetual Licensing
5. Global Picture Archiving and Communication System Market Demand (in Value in US$ Mn) Analysis 2019-2023 and Forecast, 2024-2033
- 5.1. Historical Market Value (US$ Mn) Analysis, 2019-2023
- 5.2. Current and Future Market Value (US$ Mn) Projections, 2024-2033
- 5.2.1. Y-o-Y Growth Trend Analysis
- 5.2.2. Absolute $ Opportunity Analysis
6. Market Background
- 6.1. Macro-Economic Factors
- 6.2. Forecast Factors - Relevance & Impact
- 6.3. Value Chain
- 6.4. COVID-19 Crisis - Impact Assessment
- 6.4.1. Current Statistics
- 6.4.2. Short-Mid-Long term Outlook
- 6.4.3. Likely Rebound
- 6.5. Market Dynamics
- 6.5.1. Drivers
- 6.5.2. Restraints
- 6.5.3. Opportunities
7. Global Picture Archiving and Communication System Market Analysis 2019-2023 and Forecast 2024-2033, By Deployment Type
- 7.1. Introduction / Key Findings
- 7.2. Historical Market Size (US$ Mn) Analysis By Deployment, 2019-2023
- 7.3. Current and Future Market Size (US$ Mn) Analysis and Forecast By Deployment, 2024-2033
- 7.3.1. Web-Based PACS
- 7.3.2. Cloud-Based PACS
- 7.3.3. On-premise
- 7.4. Market Attractiveness Analysis By Deployment Type
8. Global Picture Archiving and Communication System Market Analysis 2019-2023 and Forecast 2024-2033, By Component
- 8.1. Introduction / Key Findings
- 8.2. Historical Market Size (US$ Mn) Analysis By Component, 2019-2023
- 8.3. Current and Future Market Size (US$ Mn) Analysis and Forecast By Component, 2024-2033
- 8.3.1. Imaging Modalities
- 8.3.2. Secured Network
- 8.3.3. Workstation and Archives
- 8.4. Market Attractiveness Analysis By Component
9. Global Picture Archiving and Communication System Market Analysis 2019-2023 and Forecast 2024-2033, By Business Mode
- 9.1. Introduction / Key Findings
- 9.2. Historical Market Size (US$ Mn) Analysis By Business Mode, 2019-2023
- 9.3. Current and Future Market Size (US$ Mn) Analysis and Forecast By Business Mode, 2024-2033
- 9.3.1. Enterprise
- 9.3.2. Departmental
- 9.4. Market Attractiveness Analysis By Business Mode
10. Global Picture Archiving and Communication System Market Analysis 2019-2023 and Forecast 2024-2033, By End-Users
- 10.1. Introduction / Key Findings
- 10.2. Historical Market Size (US$ Mn) Analysis By End-Users, 2019-2023
- 10.3. Current and Future Market Size (US$ Mn) Analysis and Forecast By End-Users, 2024-2033
- 10.3.1. Hospitals
- 10.3.2. Clinic Imaging
- 10.3.3. Dental Practices
- 10.3.4. Imaging Centers
- 10.3.5. Diagnostic Centers
- 10.3.6. Research and Academic Institutes
- 10.3.7. Ambulatory Surgical Centers
- 10.3.8. Others
- 10.4. Market Attractiveness Analysis By End-Users
11. Global Picture Archiving and Communication System Market Analysis 2019-2023 and Forecast 2024-2033, By
- 11.1. Introduction / Key Findings
- 11.2. Historical Market Size (US$ Mn) Analysis By Region, 2019-2023
- 11.3. Current and Future Market Size (US$ Mn) Analysis and Forecast By Region, 2024-2033
- 11.3.1. North America
- 11.3.2. Latin America
- 11.3.3. Europe
- 11.3.4. East Asia
- 11.3.5. South Asia & Pacific
- 11.3.6. Middle East & Africa
- 11.4. Market Attractiveness Analysis By Region
12. North America Picture Archiving and Communication System Market Analysis 2019-2023 and Forecast 2024-2033
- 12.1. Introduction
- 12.2. Historical Market Size (US$ Mn) Trend Analysis By Market Taxonomy, 2019-2023
- 12.3. Current and Future Market Size (US$ Mn) Forecast By Market Taxonomy, 2024-2033
- 12.3.1. By Deployment Type
- 12.3.2. By Component
- 12.3.3. By Business Mode
- 12.3.4. By End-Users
- 12.3.5. By Country
- 12.3.5.1. U.S.
- 12.3.5.2. Canada
- 12.4. Market Attractiveness Analysis
- 12.4.1. By Deployment Type
- 12.4.2. By Component
- 12.4.3. By Business Mode
- 12.4.4. By End-Users
- 12.4.5. By Country
13. Latin America Picture Archiving and Communication System Market Analysis 2019-2023 and Forecast 2024-2033
- 13.1. Introduction
- 13.2. Historical Market Size (US$ Mn) Trend Analysis By Market Taxonomy, 2019-2023
- 13.3. Current and Future Market Size (US$ Mn) Forecast By Market Taxonomy, 2024-2033
- 13.3.1. By Deployment Type
- 13.3.2. By Component
- 13.3.3. By Business Mode
- 13.3.4. By End-Users
- 13.3.5. By Country
- 13.3.5.1. Brazil
- 13.3.5.2. Mexico
- 13.3.5.3. Rest of Latin America
- 13.4. Market Attractiveness Analysis
- 13.4.1. By Deployment Type
- 13.4.2. By Component
- 13.4.3. By Business Mode
- 13.4.4. By End-Users
- 13.4.5. By Country
14. Europe Picture Archiving and Communication System Market Analysis 2019-2023 and Forecast 2024-2033
- 14.1. Introduction
- 14.2. Historical Market Size (US$ Mn) Trend Analysis By Market Taxonomy, 2019-2023
- 14.3. Current and Future Market Size (US$ Mn) Forecast By Market Taxonomy, 2024-2033
- 14.3.1. By Deployment Type
- 14.3.2. By Component
- 14.3.3. By Business Mode
- 14.3.4. By End-Users
- 14.3.5. By Country
- 14.3.5.1. Germany
- 14.3.5.2. Italy
- 14.3.5.3. France
- 14.3.5.4. U.K.
- 14.3.5.5. Spain
- 14.3.5.6. BENELUX
- 14.3.5.7. Russia
- 14.3.5.8. Rest of Europe
- 14.4. Market Attractiveness Analysis
- 14.4.1. By Deployment Type
- 14.4.2. By Component
- 14.4.3. By Business Mode
- 14.4.4. By End-Users
- 14.4.5. By Country
15. South Asia & Pacific Picture Archiving and Communication System Market Analysis 2019-2023 and Forecast 2024-2033
- 15.1. Introduction
- 15.2. Historical Market Size (US$ Mn) Trend Analysis By Market Taxonomy, 2019-2023
- 15.3. Current and Future Market Size (US$ Mn) Forecast By Market Taxonomy, 2024-2033
- 15.3.1. By Deployment Type
- 15.3.2. By Component
- 15.3.3. By Business Mode
- 15.3.4. By End-Users
- 15.3.5. By Country
- 15.3.5.1. India
- 15.3.5.2. Indonesia
- 15.3.5.3. Malaysia
- 15.3.5.4. Singapore
- 15.3.5.5. Australia & New Zealand
- 15.3.5.6. Rest of South Asia and Pacific
- 15.4. Market Attractiveness Analysis
- 15.4.1. By Deployment Type
- 15.4.2. By Component
- 15.4.3. By Business Mode
- 15.4.4. By End-Users
- 15.4.5. By Country
16. East Asia Picture Archiving and Communication System Market Analysis 2019-2023 and Forecast 2024-2033
- 16.1. Introduction
- 16.2. Historical Market Size (US$ Mn) Trend Analysis By Market Taxonomy, 2019-2023
- 16.3. Current and Future Market Size (US$ Mn) Forecast By Market Taxonomy, 2024-2033
- 16.3.1. By Deployment Type
- 16.3.2. By Component
- 16.3.3. By Business Mode
- 16.3.4. By End-Users
- 16.3.5. By Country
- 16.3.5.1. China
- 16.3.5.2. Japan
- 16.3.5.3. South Korea
- 16.4. Market Attractiveness Analysis
- 16.4.1. By Deployment Type
- 16.4.2. By Component
- 16.4.3. By Business Mode
- 16.4.4. By End-Users
- 16.4.5. By Country
17. Middle East and Africa Picture Archiving and Communication System Market Analysis 2019-2023 and Forecast 2024-2033
- 17.1. Introduction
- 17.2. Historical Market Size (US$ Mn) Trend Analysis By Market Taxonomy, 2019-2023
- 17.3. Current and Future Market Size (US$ Mn) Forecast By Market Taxonomy, 2024-2033
- 17.3.1. By Deployment Type
- 17.3.2. By Component
- 17.3.3. By Business Mode
- 17.3.4. By End-Users
- 17.3.5. By Country
- 17.3.5.1. GCC Countries
- 17.3.5.2. Turkey
- 17.3.5.3. South Africa
- 17.3.5.4. Rest of Middle East and Africa
- 17.4. Market Attractiveness Analysis
- 17.4.1. By Deployment Type
- 17.4.2. By Component
- 17.4.3. By Business Mode
- 17.4.4. By End-Users
- 17.4.5. By Country
18. Key Countries Analysis - Picture Archiving and Communication System Market
- 18.1. U.S. Picture Archiving and Communication System Market Analysis
- 18.1.1. By Deployment Type
- 18.1.2. By Component
- 18.1.3. By Business Mode
- 18.1.4. By End-Users
- 18.2. Canada Picture Archiving and Communication System Market Analysis
- 18.2.1. By Deployment Type
- 18.2.2. By Component
- 18.2.3. By Business Mode
- 18.2.4. By End-Users
- 18.3. Mexico Picture Archiving and Communication System Market Analysis
- 18.3.1. By Deployment Type
- 18.3.2. By Component
- 18.3.3. By Business Mode
- 18.3.4. By End-Users
- 18.4. Brazil Picture Archiving and Communication System Market Analysis
- 18.4.1. By Deployment Type
- 18.4.2. By Component
- 18.4.3. By Business Mode
- 18.4.4. By End-Users
- 18.5. Germany Picture Archiving and Communication System Market Analysis
- 18.5.1. By Deployment Type
- 18.5.2. By Component
- 18.5.3. By Business Mode
- 18.6. Italy Picture Archiving and Communication System Market Analysis
- 18.6.1. By Deployment Type
- 18.6.2. By Component
- 18.6.3. By Business Mode
- 18.6.4. By End-Users
- 18.7. France Picture Archiving and Communication System Market Analysis
- 18.7.1. By Deployment Type
- 18.7.2. By Component
- 18.7.3. By Business Mode
- 18.7.4. By End-Users
- 18.8. U.K. Picture Archiving and Communication System Market Analysis
- 18.8.1. By Deployment Type
- 18.8.2. By Component
- 18.8.3. By Business Mode
- 18.8.4. By End-Users
- 18.9. Spain Picture Archiving and Communication System Market Analysis
- 18.9.1. By Deployment Type
- 18.9.2. By Component
- 18.9.3. By Business Mode
- 18.9.4. By End-Users
- 18.10. BENELUX Picture Archiving and Communication System Market Analysis
- 18.10.1. By Deployment Type
- 18.10.2. By Component
- 18.10.3. By Business Mode
- 18.10.4. By End-Users
- 18.11. Russia Picture Archiving and Communication System Market Analysis
- 18.11.1. By Deployment Type
- 18.11.2. By Component
- 18.11.3. By Business Mode
- 18.11.4. By End-Users
- 18.12. Rest of Europe Picture Archiving and Communication System Market Analysis
- 18.12.1. By Deployment Type
- 18.12.2. By Component
- 18.12.3. By Business Mode
- 18.12.4. By End-Users
- 18.13. China Picture Archiving and Communication System Market Analysis
- 18.13.1. By Deployment Type
- 18.13.2. By Component
- 18.13.3. By Business Mode
- 18.13.4. By End-Users
- 18.14. Japan Picture Archiving and Communication System Market Analysis
- 18.14.1. By Deployment Type
- 18.14.2. By Component
- 18.14.3. By Business Mode
- 18.14.4. By End-Users
- 18.15. South Korea Picture Archiving and Communication System Market Analysis
- 18.15.1. By Deployment Type
- 18.15.2. By Component
- 18.15.3. By Business Mode
- 18.15.4. By End-Users
- 18.16. India Picture Archiving and Communication System Market Analysis
- 18.16.1. By Deployment Type
- 18.16.2. By Component
- 18.16.3. By Business Mode
- 18.16.4. By End-Users
- 18.17. Malaysia Picture Archiving and Communication System Market Analysis
- 18.17.1. By Deployment Type
- 18.17.2. By Component
- 18.17.3. By Business Mode
- 18.17.4. By End-Users
- 18.18. Indonesia Picture Archiving and Communication System Market Analysis
- 18.18.1. By Deployment Type
- 18.18.2. By Component
- 18.18.3. By Business Mode
- 18.18.4. By End-Users
- 18.19. Singapore Picture Archiving and Communication System Market Analysis
- 18.19.1. By Deployment Type
- 18.19.2. By Component
- 18.19.3. By Business Mode
- 18.19.4. By End-Users
- 18.20. Australia and New Zealand Picture Archiving and Communication System Market Analysis
- 18.20.1. By Deployment Type
- 18.20.2. By Component
- 18.20.3. By Business Mode
- 18.20.4. By End-Users
- 18.21. GCC Countries Picture Archiving and Communication System Market Analysis
- 18.21.1. By Deployment Type
- 18.21.2. By Component
- 18.21.3. By Business Mode
- 18.21.4. By End-Users
- 18.22. Turkey Picture Archiving and Communication System Market Analysis
- 18.22.1. By Deployment Type
- 18.22.2. By Component
- 18.22.3. By Business Mode
- 18.22.4. By End-Users
- 18.23. South Africa Picture Archiving and Communication System Market Analysis
- 18.23.1. By Deployment Type
- 18.23.2. By Component
- 18.23.3. By Business Mode
- 18.23.4. By End-Users
- 18.24. Rest of Middle East and Africa Picture Archiving and Communication System Market Analysis
- 18.24.1. By Deployment Type
- 18.24.2. By Component
- 18.24.3. By Business Mode
- 18.24.4. By End-Users
19. Market Structure Analysis
- 19.1. Market Analysis by Tier of Companies
- 19.2. Market Share Analysis of Top Players
- 19.3. Market Presence Analysis
20. Competition Analysis
- 20.1. Competition Dashboard
- 20.2. Competition Benchmarking
- 20.3. Competition Deep Dive
- 20.3.1. GE Healthcare
- 20.3.1.1. Business Overview
- 20.3.1.2. Product Portfolio
- 20.3.1.3. Profitability by Market Segments (Business Segments/Region)
- 20.3.1.4. Key Strategy & Developments
- 20.3.2. Siemens Healthineers
- 20.3.2.1. Business Overview
- 20.3.2.2. Product Portfolio
- 20.3.2.3. Profitability by Market Segments (Business Segments/Region)
- 20.3.2.4. Key Strategy & Developments
- 20.3.3. Agfa-Gevaert Group
- 20.3.3.1. Business Overview
- 20.3.3.2. Product Portfolio
- 20.3.3.3. Profitability by Market Segments (Business Segments/Region)
- 20.3.3.4. Key Strategy & Developments
- 20.3.4. Carestream Health
- 20.3.4.1. Business Overview
- 20.3.4.2. Product Portfolio
- 20.3.4.3. Profitability by Market Segments (Business Segments/Region)
- 20.3.4.4. Key Strategy & Developments
- 20.3.5. Koninklijke Philips N.V.-(Philips Healthcare)
- 20.3.5.1. Business Overview
- 20.3.5.2. Product Portfolio
- 20.3.5.3. Profitability by Market Segments (Business Segments/Region)
- 20.3.5.4. Key Strategy & Developments
- 20.3.6. FUJIFILM Medical Systems
- 20.3.6.1. Business Overview
- 20.3.6.2. Product Portfolio
- 20.3.6.3. Profitability by Market Segments (Business Segments/Region)
- 20.3.6.4. Key Strategy & Developments
- 20.3.7. INFINITT Healthcare Co. Ltd.
- 20.3.7.1. Business Overview
- 20.3.7.2. Product Portfolio
- 20.3.7.3. Profitability by Market Segments (Business Segments/Region)
- 20.3.7.4. Key Strategy & Developments
- 20.3.8. Merge Healthcare Solutions Inc. (an IBM company)
- 20.3.8.1. Business Overview
- 20.3.8.2. Product Portfolio
- 20.3.8.3. Profitability by Market Segments (Business Segments/Region)
- 20.3.8.4. Key Strategy & Developments
- 20.3.9. Mckesson Corp
- 20.3.9.1. Business Overview
- 20.3.9.2. Product Portfolio
- 20.3.9.3. Profitability by Market Segments (Business Segments/Region)
- 20.3.9.4. Key Strategy & Developments
- 20.3.10. Sectra AB
- 20.3.10.1. Business Overview
- 20.3.10.2. Product Portfolio
- 20.3.10.3. Profitability by Market Segments (Business Segments/Region)
- 20.3.10.4. Key Strategy & Developments
- 20.3.11. Others
- 20.3.11.1. Business Overview
- 20.3.11.2. Product Portfolio
- 20.3.11.3. Profitability by Market Segments (Business Segments/Region)
- 20.3.11.4. Key Strategy & Developments
- 20.3.1. GE Healthcare
