|
|
市場調査レポート
商品コード
1233468
植物性ミルクの世界市場:乳糖不使用ミルクの消費拡大が、消費者の植物性ミルクへの関心を高めているGlobal Market Study on Plant-based Milk: Growing Consumption of Lactose-free Milk is inclining the Consumer towards Plant-Based Milk |
||||||
|
|
|||||||
|
● お客様のご希望に応じて、既存データの加工や未掲載情報(例:国別セグメント)の追加などの対応が可能です。 詳細はお問い合わせください。 |
|||||||


| 植物性ミルクの世界市場:乳糖不使用ミルクの消費拡大が、消費者の植物性ミルクへの関心を高めている |
|
出版日: 2023年01月17日
発行: Persistence Market Research
ページ情報: 英文 339 Pages
納期: 2~5営業日
|
- 全表示
- 概要
- 図表
- 目次
当レポートでは、世界の植物性ミルク市場について調査し、市場動向、需要分析・予測、最終用途・流通チャネル・タイプ・地域別の市場分析・予測、国別の市場分析、競合分析等に関する情報を提供しています。
目次
第1章 エグゼクティブサマリー
第2章 市場概要
- 市場範囲/分類法
- 市場の定義/範囲/制限
第3章 主要な市場動向
- 市場に影響を与える主要な動向
- 製品革新・開発動向
第4章 主要な成功要因
- 製品採用・利用分析
- 製品のUSP/機能
- 戦略的プロモーション戦略
第5章 世界の植物性ミルク市場の需要分析・予測
- 市場実績分析
- 現在および将来の市場予測
- 前年比成長動向分析
第6章 世界の植物性ミルク市場 - 価格分析
- 地域別価格動向分析
- 世界の平均価格分析ベンチマーク
第7章 世界の植物性ミルク市場の需要(金額・規模(100万米ドル))分析・予測
- 市場実績分析
- 現在および将来の市場予測
- 前年比成長動向分析
第8章 市場の背景
- マクロ経済要因
- 世界のGDP成長の展望
- 世界の食品・飲料産業の概要
- 世界のGDPとインフラ投資
- 国際貿易
- 世界産業の展望
- 予測要因 - 関連性と影響
- 上位企業の成長実績
- GDPの成長予測
- 製造産業の予測
- 世界の都市化の成長展望
- ビジネス環境
- 世界の食品・飲料産業の概要
- 食品・飲料産業の主要指標
- サプライチェーン・バリューチェーン分析
- 原材料サプライヤー
- 製品メーカー
- 流通チャネル産業
- 地域別植物性ミルクの協会・組織
- 政策展開・規制シナリオ
- The United States Food and Drug Administration (FDA)
- Canadian Food Inspection Agency
- European Food Safety Authority (EFSA)
- The Food Safety and Standards Authority of India (FSSAI)
- Ministry of Health, Labor and Welfare. (MHLW), Japan
- National Health Commission (NHC), China
- Food Standards Australia New Zealand (FSANZ)
- 市場力学
- 促進要因
- 抑制要因
- 機会分析
- 世界の需給分析
第9章 世界の植物性ミルク市場の分析・予測:最終用途別
- イントロダクション/主要な調査結果
- 市場実績と数量分析:最終用途別
- 現在および将来の市場と数量分析・予測:最終用途別
- 食品・飲料産業
- 小売/家庭
- 食品サービス産業
- 市場魅力度分析:最終用途別
第10章 世界の植物性ミルク市場の分析・予測:流通チャネル別
- イントロダクション/主要な調査結果
- 市場実績と数量分析:流通チャネル別
- 現在および将来の市場と数量分析・予測:流通チャネル別
- B2B
- B2C
- 市場魅力度分析:流通チャネル別
第11章 世界の植物性ミルク市場の分析・予測:タイプ別
- イントロダクション
- 市場実績と数量分析:タイプ別
- 現在の市場と数量分析・予測:タイプ別
- 大豆
- アーモンド
- ココナッツ
- 米
- オーツ
- その他
- 市場魅力度分析:タイプ別
第12章 世界の植物性ミルク市場の分析・予測:地域別
- イントロダクション
- 市場実績と数量分析:地域別
- 現在の市場と数量分析・予測:地域別
- 北米
- ラテンアメリカ
- 欧州
- 南アジア・太平洋
- 東アジア
- 中東・アフリカ
- 市場魅力度分析:地域別
第13章 北米の植物性ミルク市場の分析・予測
- イントロダクション
- 価格分析
- 市場実績と数量動向分析:市場分類別
- 市場と数量の予測:市場分類別
- 国別
- 最終用途別
- 流通チャネル別
- タイプ別
- 市場魅力度分析
- 国別
- 最終用途別
- 流通チャネル別
- タイプ別
- 市場動向
- 主要な市場参入企業 - 強度マッピング
- 促進要因と抑制要因 - 影響分析
第14章 ラテンアメリカの植物性ミルク市場の分析・予測
- イントロダクション
- 価格分析
- 市場実績と数量動向分析:市場分類別
- 市場と数量の予測:市場分類別
- 国別
- 最終用途別
- 流通チャネル別
- タイプ別
- 市場魅力度分析
- 国別
- 最終用途別
- 流通チャネル別
- タイプ別
- 市場動向
- 主要な市場参入企業 - 強度マッピング
- 促進要因と抑制要因 - 影響分析
第15章 欧州の植物性ミルク市場の分析・予測
- イントロダクション
- 価格分析
- 市場実績と数量動向分析:市場分類別
- 市場と数量の予測:市場分類別
- 国別
- 最終用途別
- 流通チャネル別
- タイプ別
- 市場魅力度分析
- 国別
- 最終用途別
- 流通チャネル別
- タイプ別
- 市場動向
- 主要な市場参入企業 - 強度マッピング
- 促進要因と抑制要因 - 影響分析
第16章 南アジア・太平洋の植物性ミルク市場の分析・予測
- イントロダクション
- 価格分析
- 市場実績と数量動向分析:市場分類別
- 市場と数量の予測:市場分類別
- 国別
- 最終用途別
- 流通チャネル別
- タイプ別
- 市場魅力度分析
- 国別
- 最終用途別
- 流通チャネル別
- タイプ別
- 市場動向
- 主要な市場参入企業 - 強度マッピング
- 促進要因と抑制要因 - 影響分析
第17章 東アジアの植物性ミルク市場の分析・予測
- イントロダクション
- 価格分析
- 市場実績と数量動向分析:市場分類別
- 市場と数量の予測:市場分類別
- 国別
- 最終用途別
- 流通チャネル別
- タイプ別
- 市場魅力度分析
- 国別
- 最終用途別
- 流通チャネル別
- タイプ別
- 市場動向
- 主要な市場参入企業 - 強度マッピング
- 促進要因と抑制要因 - 影響分析
第18章 中東・アフリカの植物性ミルク市場の分析・予測
- イントロダクション
- 価格分析
- 市場実績と数量動向分析:市場分類別
- 市場と数量の予測:市場分類別
- 国別
- 最終用途別
- 流通チャネル別
- タイプ別
- 市場魅力度分析
- 国別
- 最終用途別
- 流通チャネル別
- タイプ別
- 市場動向
- 主要な市場参入企業 - 強度マッピング
- 促進要因と抑制要因 - 影響分析
第19章 植物性ミルクの市場分析:国別、2022年
- イントロダクション
- 市場価値比率分析:主要国別
- 世界vs.国の成長比較
- 米国
- 最終用途別
- 流通チャネル別
- タイプ別
- カナダ
- 最終用途別
- 流通チャネル別
- タイプ別
- 東アジア
- 最終用途別
- 流通チャネル別
- タイプ別
- ブラジル
- 最終用途別
- 流通チャネル別
- タイプ別
- アルゼンチン
- 最終用途別
- 流通チャネル別
- タイプ別
- ドイツ
- 最終用途別
- 流通チャネル別
- タイプ別
- イタリア
- 最終用途別
- 流通チャネル別
- タイプ別
- フランス
- 最終用途別
- 流通チャネル別
- タイプ別
- 英国
- 最終用途別
- 流通チャネル別
- タイプ別
- スペイン
- 最終用途別
- 流通チャネル別
- タイプ別
- ポーランド
- 最終用途別
- 流通チャネル別
- タイプ別
- ロシア
- 最終用途別
- 流通チャネル別
- タイプ別
- 中国
- 最終用途別
- 流通チャネル別
- タイプ別
- 日本
- 最終用途別
- 流通チャネル別
- タイプ別
- 韓国
- 最終用途別
- 流通チャネル別
- タイプ別
- インド
- 最終用途別
- 流通チャネル別
- タイプ別
- オセアニア(オーストラリア・ニュージーランド)
- 最終用途別
- 流通チャネル別
- タイプ別
- トルコ
- 最終用途別
- 流通チャネル別
- タイプ別
- 南アフリカ
- 最終用途別
- 流通チャネル別
- タイプ別
第20章 市場構造分析
- 市場分析:企業階層別(植物性ミルク)
- 上位企業の市場シェア分析
- 市場プレゼンス分析
第21章 競合分析
- 競合ダッシュボード
- 競合のベンチマーク
- 競合の深掘り
- McCormick & Co.
- Sunopta Inc
- Goya Foods
- Blue Diamond Growers, Inc.
- Califia Farms
- Ripple Foods
- Oatly
- Sanitarium
- Ecomil
- Hiland Dairy
- Natura Foods
- Earth's Own Food Company Inc
- Edward & Sons
- Chef's Choice Food Manufacturer Company Limited
- Liwayway Holdings Company Limited
- その他
第22章 前提条件と使用される頭字語
第23章 調査手法
List of Tables
- Table 01: Global Plant-based Milk Market Value (US$ Mn) Analysis and Forecast by End Use, 2017-2033
- Table 02: Global Plant-based Milk Market Volume (Tons) Analysis and Forecast by End Use, 2017-2033
- Table 03: Global Plant-based Milk Market Value (US$ Mn) Analysis and Forecast By Distribution Channel, 2017-2033
- Table 04: Global Plant-based Milk Market Volume (Tons) Analysis and Forecast By Distribution Channel, 2017-2033
- Table 05: Global Plant-based Milk Market Value (US$ Mn) Analysis and Forecast by Type, 2017-2033
- Table 06: Global Plant-based Milk Market Volume (Tons) Analysis and Forecast by Type, 2017-2033
- Table 07: Global Plant-based Milk Market Value (US$ Mn) Analysis and Forecast by Business to Consumer, 2017-2033
- Table 08: Global Plant-based Milk Market Volume (Tons) Analysis and Forecast by Business to Consumer, 2017-2033
- Table 09: Global Plant-based Milk Market Value (US$ Mn) Analysis and Forecast by Region, 2017-2033
- Table 10: Global Plant-based Milk Market Volume (Tons) Analysis and Forecast by Region, 2017-2033
- Table 11: North America Plant-based Milk Market Value (US$ Mn) Analysis and Forecast by End Use, 2017-2033
- Table 12: North America Plant-based Milk Market Volume (Tons) Analysis and Forecast by End Use, 2017-2033
- Table 13: North America Plant-based Milk Market Value (US$ Mn) Analysis and Forecast By Distribution Channel, 2017-2033
- Table 14: North America Plant-based Milk Market Volume (Tons) Analysis and Forecast By Distribution Channel, 2017-2033
- Table 15: North America Plant-based Milk Market Value (US$ Mn) Analysis and Forecast by Type, 2017-2033
- Table 16: North America Plant-based Milk Market Volume (Tons) Analysis and Forecast by Type, 2017-2033
- Table 17: North America Plant-based Milk Market Value (US$ Mn) Analysis and Forecast by Business to Consumer, 2017-2033
- Table 18: North America Plant-based Milk Market Volume (Tons) Analysis and Forecast by Business to Consumer, 2017-2033
- Table 19: North America Plant-based Milk Market Value (US$ Mn) Analysis and Forecast by Country, 2017-2033
- Table 20: North America Plant-based Milk Market Volume (Tons) Analysis and Forecast by Country, 2017-2033
- Table 21: Latin America Plant-based Milk Market Value (US$ Mn) Analysis and Forecast by End Use, 2017-2033
- Table 22: Latin America Plant-based Milk Market Volume (Tons) Analysis and Forecast by End Use, 2017-2033
- Table 23: Latin America Plant-based Milk Market Value (US$ Mn) Analysis and Forecast By Distribution Channel, 2017-2033
- Table 24: Latin America Plant-based Milk Market Volume (Tons) Analysis and Forecast By Distribution Channel, 2017-2033
- Table 25: Latin America Plant-based Milk Market Value (US$ Mn) Analysis and Forecast by Type, 2017-2033
- Table 26: Latin America Plant-based Milk Market Volume (Tons) Analysis and Forecast by Type, 2017-2033
- Table 27: Latin America Plant-based Milk Market Value (US$ Mn) Analysis and Forecast by Business to Consumer, 2017-2033
- Table 28: Latin America Plant-based Milk Market Volume (Tons) Analysis and Forecast by Business to Consumer, 2017-2033
- Table 29: Latin America Plant-based Milk Market Value (US$ Mn) Analysis and Forecast by Country, 2017-2033
- Table 30: Latin America Plant-based Milk Market Volume (Tons) Analysis and Forecast by Country, 2017-2033
- Table 31: Europe Plant-based Milk Market Value (US$ Mn) Analysis and Forecast by End Use, 2017-2033
- Table 32: Europe Plant-based Milk Market Volume (Tons) Analysis and Forecast by End Use, 2017-2033
- Table 33: Europe Plant-based Milk Market Value (US$ Mn) Analysis and Forecast By Distribution Channel, 2017-2033
- Table 34: Europe Plant-based Milk Market Volume (Tons) Analysis and Forecast By Distribution Channel, 2017-2033
- Table 35: Europe Plant-based Milk Market Value (US$ Mn) Analysis and Forecast by Type, 2017-2033
- Table 36: Europe Plant-based Milk Market Volume (Tons) Analysis and Forecast by Type, 2017-2033
- Table 37: Europe Plant-based Milk Market Value (US$ Mn) Analysis and Forecast by Business to Consumer, 2017-2033
- Table 38: Europe Plant-based Milk Market Volume (Tons) Analysis and Forecast by Business to Consumer, 2017-2033
- Table 39: Europe Plant-based Milk Market Value (US$ Mn) Analysis and Forecast by Country, 2017-2032
- Table 40: Europe Plant-based Milk Market Volume (Tons) Analysis and Forecast by Country, 2017-2032
- Table 41: South Asia & Pacific Plant-based Milk Market Value (US$ Mn) Analysis and Forecast by End Use, 2017-2033
- Table 42: South Asia & Pacific Plant-based Milk Market Volume (Tons) Analysis and Forecast by End Use, 2017-2033
- Table 43: South Asia & Pacific Plant-based Milk Market Value (US$ Mn) Analysis and Forecast By Distribution Channel, 2017-2033
- Table 44: South Asia & Pacific Plant-based Milk Market Volume (Tons) Analysis and Forecast By Distribution Channel, 2017-2033
- Table 45: South Asia & Pacific Plant-based Milk Market Value (US$ Mn) Analysis and Forecast by Type, 2017-2033
- Table 46: South Asia & Pacific Plant-based Milk Market Volume (Tons) Analysis and Forecast by Type, 2017-2033
- Table 47: South Asia & Pacific Plant-based Milk Market Value (US$ Mn) Analysis and Forecast by Business to Consumer, 2017-2033
- Table 48: South Asia & Pacific Plant-based Milk Market Volume (Tons) Analysis and Forecast by Business to Consumer, 2017-2033
- Table 49: South Asia & Pacific Plant-based Milk Market Value (US$ Mn) Analysis and Forecast by Country, 2017-2032
- Table 50: South Asia & Pacific Plant-based Milk Market Volume (Tons) Analysis and Forecast by Country, 2017-2032
- Table 51: East Asia Plant-based Milk Market Value (US$ Mn) Analysis and Forecast by End Use, 2017-2033
- Table 52: East Asia Plant-based Milk Market Volume (Tons) Analysis and Forecast by End Use, 2017-2033
- Table 53: East Asia Plant-based Milk Market Value (US$ Mn) Analysis and Forecast By Distribution Channel, 2017-2033
- Table 54: East Asia Plant-based Milk Market Volume (Tons) Analysis and Forecast By Distribution Channel, 2017-2033
- Table 55: East Asia Plant-based Milk Market Value (US$ Mn) Analysis and Forecast by Type, 2017-2033
- Table 56: East Asia Plant-based Milk Market Volume (Tons) Analysis and Forecast by Type, 2017-2033
- Table 57: East Asia Plant-based Milk Market Value (US$ Mn) Analysis and Forecast by Business to Consumer, 2017-2033
- Table 58: East Asia Plant-based Milk Market Volume (Tons) Analysis and Forecast by Business to Consumer, 2017-2033
- Table 59: East Asia Plant-based Milk Market Value (US$ Mn) Analysis and Forecast by Country, 2017-2032
- Table 60: East Asia Plant-based Milk Market Volume (Tons) Analysis and Forecast by Country, 2017-2032
- Table 61: Middle East & Africa Plant-based Milk Market Value (US$ Mn) Analysis and Forecast by End Use, 2017-2033
- Table 62: Middle East & Africa Plant-based Milk Market Volume (Tons) Analysis and Forecast by End Use, 2017-2033
- Table 63: Middle East & Africa Plant-based Milk Market Value (US$ Mn) Analysis and Forecast By Distribution Channel, 2017-2033
- Table 64: Middle East & Africa Plant-based Milk Market Volume (Tons) Analysis and Forecast By Distribution Channel, 2017-2033
- Table 65: Middle East & Africa Plant-based Milk Market Value (US$ Mn) Analysis and Forecast by Type, 2017-2033
- Table 66: Middle East & Africa Plant-based Milk Market Volume (Tons) Analysis and Forecast by Type, 2017-2033
- Table 67: Middle East & Africa Plant-based Milk Market Value (US$ Mn) Analysis and Forecast by Business to Consumer, 2017-2033
- Table 68: Middle East & Africa Plant-based Milk Market Volume (Tons) Analysis and Forecast by Business to Consumer, 2017-2033
- Table 69: Middle East & Africa Plant-based Milk Market Value (US$ Mn) Analysis and Forecast by Country, 2017-2032
- Table 70: Middle East & Africa Plant-based Milk Market Volume (Tons) Analysis and Forecast by Country, 2017-2032
- Table 71: U.S. Plant-based Milk Market Value (US$ Mn) & Volume (Tons) Analysis by End Use, 2022
- Table 72: U.S. Plant-based Milk Market Value (US$ Mn) & Volume (Tons) Analysis by Distribution Channel, 2022
- Table 73: U.S. Plant-based Milk Market Value (US$ Mn) & Volume (Tons) Analysis by Type, 2022
- Table 74: Canada Plant-based Milk Market Value (US$ Mn) & Volume (Tons) Analysis by End Use, 2022
- Table 75: Canada Plant-based Milk Market Value (US$ Mn) & Volume (Tons) Analysis by Distribution Channel, 2022
- Table 76: Canada Plant-based Milk Market Value (US$ Mn) & Volume (Tons) Analysis by Type, 2022
- Table 77: Mexico Plant-based Milk Market Value (US$ Mn) & Volume (Tons) Analysis by End Use, 2022
- Table 78: Mexico Plant-based Milk Market Value (US$ Mn) & Volume (Tons) Analysis by Distribution Channel, 2022
- Table 79: Mexico Plant-based Milk Market Value (US$ Mn) & Volume (Tons) Analysis by Type, 2022
- Table 80: Brazil Plant-based Milk Market Value (US$ Mn) & Volume (Tons) Analysis by End Use, 2022
- Table 81: Brazil Plant-based Milk Market Value (US$ Mn) & Volume (Tons) Analysis by Distribution Channel, 2022
- Table 82: Brazil Plant-based Milk Market Value (US$ Mn) & Volume (Tons) Analysis by Type, 2022
- Table 83: Argentina Plant-based Milk Market Value (US$ Mn) & Volume (Tons) Analysis by End Use, 2022
- Table 84: Argentina Plant-based Milk Market Value (US$ Mn) & Volume (Tons) Analysis by Distribution Channel, 2022
- Table 85: Argentina Plant-based Milk Market Value (US$ Mn) & Volume (Tons) Analysis by Type, 2022
- Table 86: Germany Plant-based Milk Market Value (US$ Mn) & Volume (Tons) Analysis by End Use, 2022
- Table 87: Germany Plant-based Milk Market Value (US$ Mn) & Volume (Tons) Analysis by Distribution Channel, 2022
- Table 88: Germany Plant-based Milk Market Value (US$ Mn) & Volume (Tons) Analysis by Type, 2022
- Table 89: Italy Plant-based Milk Market Value (US$ Mn) & Volume (Tons) Analysis by End Use, 2022
- Table 90: Italy Plant-based Milk Market Value (US$ Mn) & Volume (Tons) Analysis by Distribution Channel, 2022
- Table 91: Italy Plant-based Milk Market Value (US$ Mn) & Volume (Tons) Analysis by Type, 2022
- Table 92: France Plant-based Milk Market Value (US$ Mn) & Volume (Tons) Analysis by End Use, 2022
- Table 93: France Plant-based Milk Market Value (US$ Mn) & Volume (Tons) Analysis by Distribution Channel, 2022
- Table 94: France Plant-based Milk Market Value (US$ Mn) & Volume (Tons) Analysis by Type, 2022
- Table 95: U.K. Plant-based Milk Market Value (US$ Mn) & Volume (Tons) Analysis by End Use, 2022
- Table 96: U.K. Plant-based Milk Market Value (US$ Mn) & Volume (Tons) Analysis by Distribution Channel, 2022
- Table 97: U.K. Plant-based Milk Market Value (US$ Mn) & Volume (Tons) Analysis by Type, 2022
- Table 98: Spain Plant-based Milk Market Value (US$ Mn) & Volume (Tons) Analysis by End Use, 2022
- Table 99: Spain Plant-based Milk Market Value (US$ Mn) & Volume (Tons) Analysis by Distribution Channel, 2022
- Table 100: Spain Plant-based Milk Market Value (US$ Mn) & Volume (Tons) Analysis by Type, 2022
- Table 101: Russia Plant-based Milk Market Value (US$ Mn) & Volume (Tons) Analysis by End Use, 2022
- Table 102: Russia Plant-based Milk Market Value (US$ Mn) & Volume (Tons) Analysis by Distribution Channel, 2022
- Table 103: Russia Plant-based Milk Market Value (US$ Mn) & Volume (Tons) Analysis by Type, 2022
- Table 104: Poland Plant-based Milk Market Value (US$ Mn) & Volume (Tons) Analysis by End Use, 2022
- Table 105: Poland Plant-based Milk Market Value (US$ Mn) & Volume (Tons) Analysis by Distribution Channel, 2022
- Table 106: Poland Plant-based Milk Market Value (US$ Mn) & Volume (Tons) Analysis by Type, 2022
- Table 107: China Plant-based Milk Market Value (US$ Mn) & Volume (Tons) Analysis by End Use, 2022
- Table 108: China Plant-based Milk Market Value (US$ Mn) & Volume (Tons) Analysis by Distribution Channel, 2022
- Table 109: China Plant-based Milk Market Value (US$ Mn) & Volume (Tons) Analysis by Type, 2022
- Table 110: Japan Plant-based Milk Market Value (US$ Mn) & Volume (Tons) Analysis by End Use, 2022
- Table 111: Japan Plant-based Milk Market Value (US$ Mn) & Volume (Tons) Analysis by Distribution Channel, 2022
- Table 112: Japan Plant-based Milk Market Value (US$ Mn) & Volume (Tons) Analysis by Type, 2022
- Table 113: South Korea Plant-based Milk Market Value (US$ Mn) & Volume (Tons) Analysis by End Use, 2022
- Table 114: South Korea Plant-based Milk Market Value (US$ Mn) & Volume (Tons) Analysis by Distribution Channel, 2022
- Table 115: South Korea Plant-based Milk Market Value (US$ Mn) & Volume (Tons) Analysis by Type, 2022
- Table 116: India Plant-based Milk Market Value (US$ Mn) & Volume (Tons) Analysis by End Use, 2022
- Table 117: India Plant-based Milk Market Value (US$ Mn) & Volume (Tons) Analysis by Distribution Channel, 2022
- Table 118: India Plant-based Milk Market Value (US$ Mn) & Volume (Tons) Analysis by Type, 2022
- Table 119: Turkey Plant-based Milk Market Value (US$ Mn) & Volume (Tons) Analysis by End Use, 2022
- Table 120: Turkey Plant-based Milk Market Value (US$ Mn) & Volume (Tons) Analysis by Distribution Channel, 2022
- Table 121: Turkey Plant-based Milk Market Value (US$ Mn) & Volume (Tons) Analysis by Type, 2022
- Table 122: South Africa Plant-based Milk Market Value (US$ Mn) & Volume (Tons) Analysis by End Use, 2022
- Table 123: South Africa Plant-based Milk Market Value (US$ Mn) & Volume (Tons) Analysis by Distribution Channel, 2022
- Table 124: South Africa Plant-based Milk Market Value (US$ Mn) & Volume (Tons) Analysis by Type, 2022
- Table 125: Chile Plant-based Milk Market Value (US$ Mn) & Volume (Tons) Analysis by End Use, 2022
- Table 126: Chile Plant-based Milk Market Value (US$ Mn) & Volume (Tons) Analysis by Distribution Channel, 2022
- Table 127: Chile Plant-based Milk Market Value (US$ Mn) & Volume (Tons) Analysis by Type, 2022
List of Figures
- Figure 01: Global Plant-based Milk Market Value (US$ Mn) Forecast, 2023 -2033
- Figure 02: Global Plant-based Milk Market Volume (Tons) Forecast 2023 -2033
- Figure 03: Global Plant-based Milk Market Value Share Analysis by End Use, 2023 E
- Figure 04: Global Plant-based Milk Market Y-o-Y Growth Rate by End Use, 2023 -2033
- Figure 05: Global Plant-based Milk Market Value (US$ Mn) Analysis & Forecast by End Use, 2023 -2033
- Figure 06: Global Plant-based Milk Market Volume (Tons) Analysis & Forecast by End Use, 2023 -2033
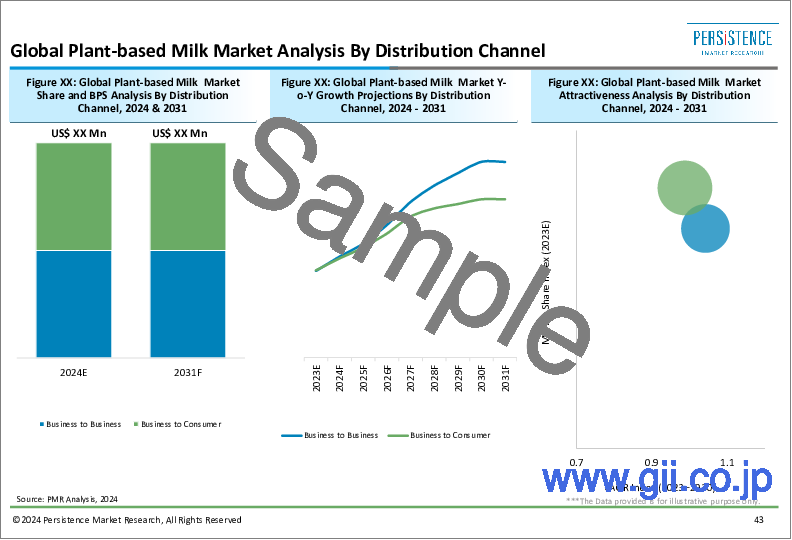
- Figure 07: Global Plant-based Milk Market Value Share Analysis By Distribution Channel, 2023 E
- Figure 08: Global Plant-based Milk Market Y-o-Y Growth Rate by Distribution Channel, 2023 -2033
- Figure 09: Global Plant-based Milk Market Value (US$ Mn) Analysis & Forecast By Distribution Channel, 2023 -2033
- Figure 10: Global Plant-based Milk Market Volume (Tons) Analysis & Forecast By Distribution Channel, 2023 -2033
- Figure 11: Global Plant-based Milk Market Value Share Analysis by Type, 2023 E
- Figure 12: Global Plant-based Milk Market Y-o-Y Growth Rate by Type, 2023-2033
- Figure 13: Global Plant-based Milk Market Value (US$ Mn) Analysis & Forecast by Type, 2023 -2033
- Figure 14: Global Plant-based Milk Market Volume (Tons) Analysis & Forecast by Type, 2023 -2033
- Figure 15: Global Plant-based Milk Market Value Share Analysis by Region, 2023 E
- Figure 16: Global Plant-based Milk Market Y-o-Y Growth Rate by Region, 2023 -2033
- Figure 17: Global Plant-based Milk Market Value (US$ Mn) Analysis & Forecast by Region, 2023 -2033
- Figure 18: Global Plant-based Milk Market Volume (Tons) Analysis & Forecast by Region, 2023 -2033
- Figure 19: Global Plant-based Milk Market Attractiveness Analysis by Region, 2023-2033
- Figure 20: Global Plant-based Milk Market Attractiveness Analysis by End Use, 2023-2033
- Figure 21: Global Plant-based Milk Market Attractiveness Analysis by Distribution Channel, 2023-2033
- Figure 22: Global Plant-based Milk Market Attractiveness Analysis by Type, 2023-2033
- Figure 23: North America Plant-based Milk Market Value (US$ Mn) Analysis & Forecast by End Use, 2023 -2033
- Figure 24: North America Plant-based Milk Market Volume (Tons) Analysis & Forecast by End Use, 2023 -2033
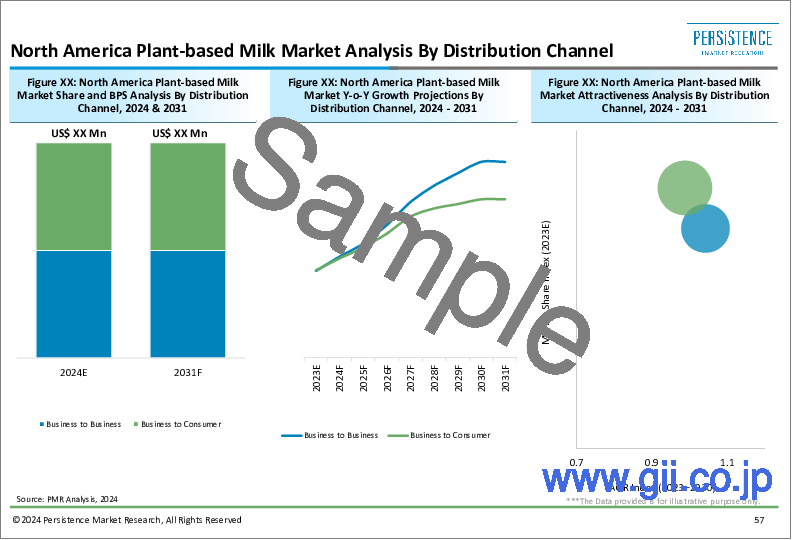
- Figure 25: North America Plant-based Milk Market Value (US$ Mn) Analysis & Forecast by Distribution Channel, 2023 -2033
- Figure 26: North America Plant-based Milk Market Volume (Tons) Analysis & Forecast by Distribution Channel, 2023 -2033
- Figure 27: North America Plant-based Milk Market Value (US$ Mn) Analysis & Forecast by Type, 2023 -2033
- Figure 28: North America Plant-based Milk Market Volume (Tons) Analysis & Forecast by Type, 2023 -2033
- Figure 29: North America Plant-based Milk Market Value (US$ Mn) Analysis & Forecast by Country, 2023 -2033
- Figure 30: North America Plant-based Milk Market Volume (Tons) Analysis & Forecast by Country, 2023 -2033
- Figure 31: North America Plant-based Milk Market Attractiveness Analysis by Country, 2023-2033
- Figure 32: North America Plant-based Milk Market Attractiveness Analysis by End Use, 2023-2033
- Figure 33: North America Plant-based Milk Market Attractiveness Analysis by Distribution Channel, 2023-2033
- Figure 34: North America Plant-based Milk Market Attractiveness Analysis by Type, 2023-2033
- Figure 35: Latin America Plant-based Milk Market Value (US$ Mn) Analysis & Forecast by End Use, 2023 -2033
- Figure 36: Latin America Plant-based Milk Market Volume (Tons) Analysis & Forecast by End Use, 2023 -2033
- Figure 37: Latin America Plant-based Milk Market Value (US$ Mn) Analysis & Forecast by Distribution Channel, 2023 -2033
- Figure 38: Latin America Plant-based Milk Market Volume (Tons) Analysis & Forecast by Distribution Channel, 2023 -2033
- Figure 39: Latin America Plant-based Milk Market Value (US$ Mn) Analysis & Forecast by Type, 2023 -2033
- Figure 40: Latin America Plant-based Milk Market Volume (Tons) Analysis & Forecast by Type, 2023 -2033
- Figure 41: Latin America Plant-based Milk Market Value (US$ Mn) Analysis & Forecast by Country, 2023 -2033
- Figure 42: Latin America Plant-based Milk Market Volume (Tons) Analysis & Forecast by Country, 2023 -2033
- Figure 43: Latin America Plant-based Milk Market Attractiveness Analysis by Country, 2023-2033
- Figure 44: Latin America Plant-based Milk Market Attractiveness Analysis by End Use, 2023-2033
- Figure 46: Latin America Plant-based Milk Market Attractiveness Analysis by Distribution Channel, 2023-2033
- Figure 47: Latin America Plant-based Milk Market Attractiveness Analysis by Type, 2023-2033
- Figure 48: Europe Plant-based Milk Market Value (US$ Mn) Analysis & Forecast by End Use, 2023 -2033
- Figure 49: Europe Plant-based Milk Market Volume (Tons) Analysis & Forecast by End Use, 2023 -2033
- Figure 50: Europe Plant-based Milk Market Value (US$ Mn) Analysis & Forecast by Distribution Channel, 2023 -2033
- Figure 51: Europe Plant-based Milk Market Volume (Tons) Analysis & Forecast by Distribution Channel, 2023 -2033
- Figure 52: Europe Plant-based Milk Market Value (US$ Mn) Analysis & Forecast by Type, 2023 -2033
- Figure 53: Europe Plant-based Milk Market Volume (Tons) Analysis & Forecast by Type, 2023 -2033
- Figure 54: Europe Plant-based Milk Market Value (US$ Mn) Analysis & Forecast by Country, 2023 -2033
- Figure 55: Europe Plant-based Milk Market Volume (Tons) Analysis & Forecast by Country, 2023 -2033
- Figure 56: Europe Plant-based Milk Market Attractiveness Analysis by Country, 2023-2033
- Figure 57: Europe Plant-based Milk Market Attractiveness Analysis by End Use, 2023-2033
- Figure 58: Europe Plant-based Milk Market Attractiveness Analysis by Distribution Channel, 2023-2033
- Figure 59: Europe Plant-based Milk Market Attractiveness Analysis by Type, 2023-2033
- Figure 60: South Asia & Pacific Plant-based Milk Market Value (US$ Mn) Analysis & Forecast by End Use, 2023 -2033
- Figure 61: South Asia & Pacific Plant-based Milk Market Volume (Tons) Analysis & Forecast by End Use, 2023 -2033
- Figure 62: South Asia & Pacific Plant-based Milk Market Value (US$ Mn) Analysis & Forecast by Distribution Channel, 2023 -2033
- Figure 63: South Asia & Pacific Plant-based Milk Market Volume (Tons) Analysis & Forecast by Distribution Channel, 2023 -2033
- Figure 64: South Asia & Pacific Plant-based Milk Market Value (US$ Mn) Analysis & Forecast by Type, 2023 -2033
- Figure 65: South Asia & Pacific Plant-based Milk Market Volume (Tons) Analysis & Forecast by Type, 2023 -2033
- Figure 66: South Asia & Pacific Plant-based Milk Market Value (US$ Mn) Analysis & Forecast by Country, 2023 -2033
- Figure 67: South Asia & Pacific Plant-based Milk Market Volume (Tons) Analysis & Forecast by Country, 2023 -2033
- Figure 68: South Asia & Pacific Plant-based Milk Market Attractiveness Analysis by Country, 2023-2033
- Figure 69: South Asia & Pacific Plant-based Milk Market Attractiveness Analysis by End Use, 2023-2033
- Figure 70: South Asia & Pacific Plant-based Milk Market Attractiveness Analysis by Distribution Channel, 2023-2033
- Figure 71: South Asia & Pacific Plant-based Milk Market Attractiveness Analysis by Type, 2023-2033
- Figure 72: East Asia Plant-based Milk Market Value (US$ Mn) Analysis & Forecast by End Use, 2023 -2033
- Figure 73: East Asia Plant-based Milk Market Volume (Tons) Analysis & Forecast by End Use, 2023 -2033
- Figure 74: East Asia Plant-based Milk Market Value (US$ Mn) Analysis & Forecast by Distribution Channel, 2023 -2033
- Figure 75: East Asia Plant-based Milk Market Volume (Tons) Analysis & Forecast by Distribution Channel, 2023 -2033
- Figure 76: East Asia Plant-based Milk Market Value (US$ Mn) Analysis & Forecast by Type, 2023 -2033
- Figure 77: East Asia Plant-based Milk Market Volume (Tons) Analysis & Forecast by Type, 2023 -2033
- Figure 78: East Asia Plant-based Milk Market Value (US$ Mn) Analysis & Forecast by Country, 2023 -2033
- Figure 79: East Asia Plant-based Milk Market Volume (Tons) Analysis & Forecast by Country, 2023 -2033
- Figure 80: East Asia Plant-based Milk Market Attractiveness Analysis by Country, 2023-2033
- Figure 81: East Asia Plant-based Milk Market Attractiveness Analysis by End Use, 2023-2033
- Figure 82: East Asia Plant-based Milk Market Attractiveness Analysis by Distribution Channel, 2023-2033
- Figure 83: East Asia Plant-based Milk Market Attractiveness Analysis by Type, 2023-2033
- Figure 84: Middle East & Africa Plant-based Milk Market Value (US$ Mn) Analysis & Forecast by End Use, 2023 -2033
- Figure 85: Middle East & Africa Plant-based Milk Market Volume (Tons) Analysis & Forecast by End Use, 2023 -2033
- Figure 86: Middle East & Africa Plant-based Milk Market Value (US$ Mn) Analysis & Forecast by Distribution Channel, 2023 -2033
- Figure 87: Middle East & Africa Plant-based Milk Market Volume (Tons) Analysis & Forecast by Distribution Channel, 2023 -2033
- Figure 88: Middle East & Africa Plant-based Milk Market Value (US$ Mn) Analysis & Forecast by Type, 2023 -2033
- Figure 89: Middle East & Africa Plant-based Milk Market Volume (Tons) Analysis & Forecast by Type, 2023 -2033
- Figure 90: Middle East & Africa Plant-based Milk Market Value (US$ Mn) Analysis & Forecast by Country, 2023 -2033
- Figure 91: Middle East & Africa Plant-based Milk Market Volume (Tons) Analysis & Forecast by Country, 2023 -2033
- Figure 92: Middle East & Africa Plant-based Milk Market Attractiveness Analysis by Country, 2023-2033
- Figure 93: Middle East & Africa Plant-based Milk Market Attractiveness Analysis by End Use, 2023-2033
- Figure 94: Middle East & Africa Plant-based Milk Market Attractiveness Analysis by Distribution Channel, 2023-2033
- Figure 95: Middle East & Africa Plant-based Milk Market Attractiveness Analysis by Type, 2023-2033
Plant-based Milk Market: Report Scope
A latest market report by Persistence Market Research on the global plant-based milk market evaluates the opportunities and current market scenario, providing insights and updates about corresponding segments involved in the market for the forecast period of 2023-2033. The report provides detailed assessment of key market dynamics, and comprehensive information about the structure of the market. This study contains detailed insights into how the market is anticipated to grow during the forecast period of 2023-2033.
The primary objective of the report is to provide insights regarding opportunities in the market that are supporting the transformation of global businesses associated with plant-based. It is very important to consider that, in an ever-wavering economy, we provide estimated (Y-o-Y) year-on-year growth rate in addition to compound annual growth rate (CAGR) for overall forecasts, to enable readers better understand the analysis and evaluation of the market, and to discover lucrative opportunities in this space.
This report also provides an estimate of market size and corresponding revenue forecasts carried out in terms of absolute $ opportunity. It also offers actionable insights based on the future trends in the market. Furthermore, new and emerging players in the global plant-based milk market can make use of the information presented in the study for effective business decisions, which will provide momentum to their businesses as well as the global market.
The study is relevant for manufacturers, suppliers, distributors, and investors in the plant-based milk market. All stakeholders, as well as industry experts, researchers, journalists, and business researchers can leverage the information and data represented in the report.
Key Market Segments
Persistence Market Research's report on the global plant-based milk market offers information divided into six segments -end use, distribution channel, type and region.
Nature
Food & Beverage Industry
Bakery & Confectionery
Dairy & Desserts
Infant Formula
Retail/Household
Foodservice Industry
Distribution Channel
Business to Business
Business to Consumer
Hypermarkets/Supermarkets
Convenience Stores
Specialty Stores
Online Retail
Type
Soy
Almond
Coconut
Rice
Oat
Others
Region
North America
Latin America
Europe
East Asia
South Asia & Pacific
Middle East & Africa
Key Questions Answered in Study
Which region will hold the highest market share over the forecast period?
Which region is experiencing the highest growth (CAGR)?
Which factors are impacting the global plant-based milk market?
What are the global trends impacting the market?
What strategies must emerge players adopt to capture opportunities in various regions in the market?
What is the structure of the global plant-based milk market?
Research Methodology
Persistence Market Research is committed to providing unbiased market research solutions to its clients. The company follows a robust methodology for the deduction of data included in this report. A unique research methodology is utilized to conduct extensive research on the global plant-based milk market, and reach conclusions about the future growth factors of the market. The research methodology comprises primary research methods coupled with secondary research methods, which ensures the accuracy and reliability of the conclusions in this report.
A demand-side approach is followed to estimate the sales of target products, followed by an in-depth supply-side assessment of value generated, key trends, and events over a predefined period. This methodology is based on standard market structures, methods, and definitions that are based on inputs from local sources in over six regions - North America, Latin America, Europe, East Asia, South Asia & Pacific, Middle East & Africa which Persistence Market Research considers for segmenting the global market. Statistics, characteristics, and variances are collected at a regional level, aggregated at the same level, and then synthesized at a worldwide level, to create global market measurements. Our main sources of research include:
Primary Research
Secondary Research
Trade Research
Social Media Research
Table of Contents
1. Executive Summary
- 1.1. Global Market Outlook
- 1.2. Demand Side Trends
- 1.3. Supply Side Trends
- 1.4. Technology Roadmap
- 1.5. Analysis and Recommendations
2. Market Overview
- 2.1. Market Coverage / Taxonomy
- 2.2. Market Definition / Scope / Limitations
3. Key Market Trends
- 3.1. Key Trends Impacting the Market
- 3.2. Product Innovation / Development Trends
4. Key Success Factors
- 4.1. Product Adoption / Usage Analysis
- 4.2. Product USPs / Features
- 4.3. Strategic Promotional Strategies
5. Global Plant-based Milk Market Demand Analysis 2017-2022 and Forecast, 2023-2033
- 5.1. Historical Market Volume (Tons) Analysis, 2017-2022
- 5.2. Current and Future Market Volume (Tons) Projections, 2023-2033
- 5.3. Y-o-Y Growth Trend Analysis
6. Global Plant-based Milk Market - Pricing Analysis
- 6.1. Regional Pricing Trend Analysis, 2017-2022
- 6.2. Global Average Pricing Analysis Benchmark
7. Global Plant-based Milk Market Demand (in Value or Size in US$ Mn) Analysis 2017-2022 and Forecast, 2023-2033
- 7.1. Historical Market Value (US$ Mn) Analysis, 2017-2022
- 7.2. Current and Future Market Value (US$ Mn) Projections, 2023-2033
- 7.2.1. Y-o-Y Growth Trend Analysis
- 7.2.2. Absolute $ Opportunity Analysis
8. Market Background
- 8.1. Macro-Economic Factors
- 8.1.1. Global GDP Growth Outlook
- 8.1.2. Global Food & Beverage industry Overview
- 8.1.3. Global GDP and Infrastructure Investment
- 8.1.4. International Trade
- 8.1.5. Global Industry Outlook
- 8.2. Forecast Factors - Relevance & Impact
- 8.2.1. Top Companies Historical Growth
- 8.2.2. GDP Growth forecast
- 8.2.3. Manufacturing Industry forecast
- 8.2.4. Global Urbanization Growth Outlook
- 8.2.5. Business Climate
- 8.3. Global Food and Beverage Industry Overview
- 8.3.1. Food & Beverage Industry Key Indicators
- 8.4. Supply Chain & Value-Chain Analysis
- 8.4.1. Raw Material Suppliers
- 8.4.2. Product Manufacturers
- 8.4.3. Distribution Channel Industries
- 8.5. Regional Plant-based Milk Associations and Organizations
- 8.6. Policy Developments and Regulatory Scenario
- 8.6.1. The United States Food and Drug Administration (FDA)
- 8.6.2. Canadian Food Inspection Agency
- 8.6.3. European Food Safety Authority (EFSA)
- 8.6.4. The Food Safety and Standards Authority of India (FSSAI)
- 8.6.5. Ministry of Health, Labor and Welfare. (MHLW), Japan
- 8.6.6. National Health Commission (NHC), China
- 8.6.7. Food Standards Australia New Zealand (FSANZ)
- 8.7. Market Dynamics
- 8.7.1. Drivers
- 8.7.2. Restraints
- 8.7.3. Opportunity Analysis
- 8.8. Global Supply Demand Analysis
9. Global Plant-based Milk Market Analysis 2017-2022 and Forecast 2023-2033, By End Use
- 9.1. Introduction / Key Findings
- 9.2. Historical Market Size (US$ Mn) and Volume Analysis By Nature, 2017-2022
- 9.3. Current and Future Market Size (US$ Mn) and Volume Analysis and Forecast By Nature, 2023-2033
- 9.3.1. Food & Beverage Industry
- 9.3.1.1. Bakery & Confectionery
- 9.3.1.2. Dairy & Desserts
- 9.3.1.3. Infant Distribution Channelula
- 9.3.2. Retail/Household
- 9.3.3. Foodservice Industry
- 9.3.1. Food & Beverage Industry
- 9.4. Market Attractiveness Analysis By Nature
10. Global Plant-based Milk Market Analysis 2017-2022 and Forecast 2023-2033, by Distribution Channel
- 10.1. Introduction / Key Findings
- 10.2. Historical Market Size (US$ Mn) and Volume Analysis By Distribution Channel, 2017-2022
- 10.3. Current and Future Market Size (US$ Mn) and Volume Analysis and Forecast By Distribution Channel, 2023-2033
- 10.3.1. Business to Business
- 10.3.2. Business to Consumer
- 10.3.2.1. Hypermarkets/Supermarkets
- 10.3.2.2. Convenience Stores
- 10.3.2.3. Specialty Stores
- 10.3.2.4. Online Retail
- 10.4. Market Attractiveness Analysis By Distribution Channel
11. Global Plant-based Milk Market Analysis 2017-2022 and Forecast 2023-2033, by Type
- 11.1. Introduction
- 11.2. Historical Market Size (US$ Mn) and Volume Analysis By Type, 2017-2022
- 11.3. Current Market Size (US$ Mn) and Volume Analysis and Forecast By Type, 2023-2033
- 11.3.1. Soy
- 11.3.2. Almond
- 11.3.3. Coconut
- 11.3.4. Rice
- 11.3.5. Oat
- 11.3.6. Others
- 11.4. Market Attractiveness Analysis By Type
12. Global Plant-based Milk Market Analysis 2017-2022 and Forecast 2023-2033, by Region
- 12.1. Introduction
- 12.2. Historical Market Size (US$ Mn) and Volume Analysis By Region, 2017-2022
- 12.3. Current Market Size (US$ Mn) and Volume Analysis and Forecast By Region, 2023-2033
- 12.3.1. North America
- 12.3.2. Latin America
- 12.3.3. Europe
- 12.3.4. South Asia and Pacific
- 12.3.5. East Asia
- 12.3.6. Middle East and Africa (MEA)
- 12.4. Market Attractiveness Analysis By Region
13. North America Plant-based Milk Market Analysis 2017-2022 and Forecast 2023-2033
- 13.1. Introduction
- 13.2. Pricing Analysis
- 13.3. Historical Market Size (US$ Mn) and Volume Trend Analysis By Market Taxonomy, 2017-2022
- 13.4. Market Size (US$ Mn) and Volume Forecast By Market Taxonomy, 2023-2033
- 13.4.1. By Country
- 13.4.1.1. U.S.
- 13.4.1.2. Canada
- 13.4.2. By End Use
- 13.4.3. By Distribution Channel
- 13.4.4. By Type
- 13.4.1. By Country
- 13.5. Market Attractiveness Analysis
- 13.5.1. By Country
- 13.5.2. By End Use
- 13.5.3. By Distribution Channel
- 13.5.4. By Type
- 13.6. Market Trends
- 13.7. Key Market Participants - Intensity Mapping
- 13.8. Drivers and Restraints - Impact Analysis
14. Latin America Plant-based Milk Market Analysis 2017-2022 and Forecast 2023-2033
- 14.1. Introduction
- 14.2. Pricing Analysis
- 14.3. Historical Market Size (US$ Mn) and Volume Trend Analysis By Market Taxonomy, 2017-2022
- 14.4. Market Size (US$ Mn) and Volume Forecast By Market Taxonomy, 2023-2033
- 14.4.1. By Country
- 14.4.1.1. Brazil
- 14.4.1.2. East Asia
- 14.4.1.3. Argentina
- 14.4.1.4. Rest of Latin America
- 14.4.2. By End Use
- 14.4.3. By Distribution Channel
- 14.4.4. By Type
- 14.4.1. By Country
- 14.5. Market Attractiveness Analysis
- 14.5.1. By Country
- 14.5.2. By End Use
- 14.5.3. By Distribution Channel
- 14.5.4. By Type
- 14.6. Market Trends
- 14.7. Key Market Participants - Intensity Mapping
- 14.8. Drivers and Restraints - Impact Analysis
15. Europe Plant-based Milk Market Analysis 2017-2022 and Forecast 2023-2033
- 15.1. Introduction
- 15.2. Pricing Analysis
- 15.3. Historical Market Size (US$ Mn) and Volume Trend Analysis By Market Taxonomy, 2017-2022
- 15.4. Market Size (US$ Mn) and Volume Forecast By Market Taxonomy, 2023-2033
- 15.4.1. By Country
- 15.4.1.1. Germany
- 15.4.1.2. Italy
- 15.4.1.3. France
- 15.4.1.4. U.K.
- 15.4.1.5. Spain
- 15.4.1.6. BENELUX
- 15.4.1.7. Russia
- 15.4.1.8. Poland
- 15.4.1.9. Rest of Europe
- 15.4.2. By End Use
- 15.4.3. By Distribution Channel
- 15.4.4. By Type
- 15.4.1. By Country
- 15.5. Market Attractiveness Analysis
- 15.5.1. By Country
- 15.5.2. By End Use
- 15.5.3. By Distribution Channel
- 15.5.4. By Type
- 15.6. Market Trends
- 15.7. Key Market Participants - Intensity Mapping
- 15.8. Drivers and Restraints - Impact Analysis
16. South Asia and Pacific Plant-based Milk Market Analysis 2017-2022 and Forecast 2023-2033
- 16.1. Introduction
- 16.2. Pricing Analysis
- 16.3. Historical Market Size (US$ Mn) and Volume Trend Analysis By Market Taxonomy, 2017-2022
- 16.4. Market Size (US$ Mn) and Volume Forecast By Market Taxonomy, 2023-2033
- 16.4.1. By Country
- 16.4.1.1. India
- 16.4.1.2. ASEAN
- 16.4.1.3. Oceania (Australia & New Zealand)
- 16.4.1.4. Rest of South Asia & Pacific
- 16.4.2. By End Use
- 16.4.3. By Distribution Channel
- 16.4.4. By Type
- 16.4.1. By Country
- 16.5. Market Attractiveness Analysis
- 16.5.1. By Country
- 16.5.2. By End Use
- 16.5.3. By Distribution Channel
- 16.5.4. By Type
- 16.6. Market Trends
- 16.7. Key Market Participants - Intensity Mapping
- 16.8. Drivers and Restraints - Impact Analysis
17. East Asia Plant-based Milk Market Analysis 2017-2022 and Forecast 2023-2033
- 17.1. Introduction
- 17.2. Pricing Analysis
- 17.3. Historical Market Size (US$ Mn) and Volume Trend Analysis By Market Taxonomy, 2017-2022
- 17.4. Market Size (US$ Mn) and Volume Forecast By Market Taxonomy, 2023-2033
- 17.4.1. By Country
- 17.4.1.1. China
- 17.4.1.2. Japan
- 17.4.1.3. South Korea
- 17.4.2. By End Use
- 17.4.3. By Distribution Channel
- 17.4.4. By Type
- 17.4.1. By Country
- 17.5. Market Attractiveness Analysis
- 17.5.1. By Country
- 17.5.2. By End Use
- 17.5.3. By Distribution Channel
- 17.5.4. By Type
- 17.6. Market Trends
- 17.7. Key Market Participants - Intensity Mapping
- 17.8. Drivers and Restraints - Impact Analysis
18. Middle East and Africa Plant-based Milk Market Analysis 2017-2022 and Forecast 2023-2033
- 18.1. Introduction
- 18.2. Pricing Analysis
- 18.3. Historical Market Size (US$ Mn) and Volume Trend Analysis By Market Taxonomy, 2017-2022
- 18.4. Market Size (US$ Mn) and Volume Forecast By Market Taxonomy, 2023-2033
- 18.4.1. By Country
- 18.4.1.1. GCC Countries
- 18.4.1.2. Turkey
- 18.4.1.3. Northern Africa
- 18.4.1.4. South Africa
- 18.4.1.5. Rest of Middle East and Africa
- 18.4.2. By End Use
- 18.4.3. By Distribution Channel
- 18.4.4. By Type
- 18.4.1. By Country
- 18.5. Market Attractiveness Analysis
- 18.5.1. By Country
- 18.5.2. By End Use
- 18.5.3. By Distribution Channel
- 18.5.4. By Type
- 18.6. Market Trends
- 18.7. Key Market Participants - Intensity Mapping
- 18.8. Drivers and Restraints - Impact Analysis
19. Country Wise Plant-based Milk Market Analysis, 2023
- 19.1. Introduction
- 19.1.1. Market Value Proportion Analysis, By Key Countries
- 19.1.2. Global Vs. Country Growth Comparison
- 19.2. U.S. Plant-based Milk Market Analysis
- 19.2.1. By End Use
- 19.2.2. By Distribution Channel
- 19.2.3. By Type
- 19.3. Canada Plant-based Milk Market Analysis
- 19.3.1. By End Use
- 19.3.2. By Distribution Channel
- 19.3.3. By Type
- 19.4. East Asia Plant-based Milk Market Analysis
- 19.4.1. By End Use
- 19.4.2. By Distribution Channel
- 19.4.3. By Type
- 19.5. Brazil Plant-based Milk Market Analysis
- 19.5.1. By End Use
- 19.5.2. By Distribution Channel
- 19.5.3. By Type
- 19.6. Argentina Plant-based Milk Market Analysis
- 19.6.1. By End Use
- 19.6.2. By Distribution Channel
- 19.6.3. By Type
- 19.7. Germany Plant-based Milk Market Analysis
- 19.7.1. By End Use
- 19.7.2. By Distribution Channel
- 19.7.3. By Type
- 19.8. Italy Plant-based Milk Market Analysis
- 19.8.1. By End Use
- 19.8.2. By Distribution Channel
- 19.8.3. By Type
- 19.9. France Plant-based Milk Market Analysis
- 19.9.1. By End Use
- 19.9.2. By Distribution Channel
- 19.9.3. By Type
- 19.10. U.K. Plant-based Milk Market Analysis
- 19.10.1. By End Use
- 19.10.2. By Distribution Channel
- 19.10.3. By Type
- 19.11. Spain Plant-based Milk Market Analysis
- 19.11.1. By End Use
- 19.11.2. By Distribution Channel
- 19.11.3. By Type
- 19.12. Poland Plant-based Milk Market Analysis
- 19.12.1. By End Use
- 19.12.2. By Distribution Channel
- 19.12.3. By Type
- 19.13. Russia Plant-based Milk Market Analysis
- 19.13.1. By End Use
- 19.13.2. By Distribution Channel
- 19.13.3. By Type
- 19.14. China Plant-based Milk Market Analysis
- 19.14.1. By End Use
- 19.14.2. By Distribution Channel
- 19.14.3. By Type
- 19.15. Japan Plant-based Milk Market Analysis
- 19.15.1. By End Use
- 19.15.2. By Distribution Channel
- 19.15.3. By Type
- 19.16. S. Korea Plant-based Milk Market Analysis
- 19.16.1. By End Use
- 19.16.2. By Distribution Channel
- 19.16.3. By Type
- 19.17. India Plant-based Milk Market Analysis
- 19.17.1. By End Use
- 19.17.2. By Distribution Channel
- 19.17.3. By Type
- 19.18. Oceania (Australia and New Zealand) Plant-based Milk Market Analysis
- 19.18.1. By End Use
- 19.18.2. By Distribution Channel
- 19.18.3. By Type
- 19.19. Turkey Plant-based Milk Market Analysis
- 19.19.1. By End Use
- 19.19.2. By Distribution Channel
- 19.19.3. By Type
- 19.20. South Africa Plant-based Milk Market Analysis
- 19.20.1. By End Use
- 19.20.2. By Distribution Channel
- 19.20.3. By Type
20. Market Structure Analysis
- 20.1. Market Analysis by Tier of Companies (Plant-based Milk)
- 20.2. Market Share Analysis of Top Players
- 20.3. Market Presence Analysis
21. Competition Analysis
- 21.1. Competition Dashboard
- 21.2. Competition Benchmarking
- 21.3. Competition Deep Dive
- 21.3.1. McCormick & Co.
- 21.3.1.1. Overview
- 21.3.1.2. Product Portfolio
- 21.3.1.3. Profitability by Market Segments (Product/Channel/Region)
- 21.3.1.4. Sales Footprint
- 21.3.1.5. Strategy Overview
- 21.3.2. Sunopta Inc
- 21.3.2.1. Overview
- 21.3.2.2. Product Portfolio
- 21.3.2.3. Profitability by Market Segments (Product/Channel/Region)
- 21.3.2.4. Sales Footprint
- 21.3.2.5. Strategy Overview
- 21.3.3. Goya Foods
- 21.3.3.1. Overview
- 21.3.3.2. Product Portfolio
- 21.3.3.3. Profitability by Market Segments (Product/Channel/Region)
- 21.3.3.4. Sales Footprint
- 21.3.3.5. Strategy Overview
- 21.3.4. Blue Diamond Growers, Inc.
- 21.3.4.1. Overview
- 21.3.4.2. Product Portfolio
- 21.3.4.3. Profitability by Market Segments (Product/Channel/Region)
- 21.3.4.4. Sales Footprint
- 21.3.4.5. Strategy Overview
- 21.3.5. Califia Farms
- 21.3.5.1. Overview
- 21.3.5.2. Product Portfolio
- 21.3.5.3. Profitability by Market Segments (Product/Channel/Region)
- 21.3.5.4. Sales Footprint
- 21.3.5.5. Strategy Overview
- 21.3.6. Ripple Foods
- 21.3.6.1. Overview
- 21.3.6.2. Product Portfolio
- 21.3.6.3. Profitability by Market Segments (Product/Channel/Region)
- 21.3.6.4. Sales Footprint
- 21.3.6.5. Strategy Overview
- 21.3.7. Oatly
- 21.3.7.1. Overview
- 21.3.7.2. Product Portfolio
- 21.3.7.3. Profitability by Market Segments (Product/Channel/Region)
- 21.3.7.4. Sales Footprint
- 21.3.7.5. Strategy Overview
- 21.3.8. Sanitarium
- 21.3.8.1. Overview
- 21.3.8.2. Product Portfolio
- 21.3.8.3. Profitability by Market Segments (Product/Channel/Region)
- 21.3.8.4. Sales Footprint
- 21.3.8.5. Strategy Overview
- 21.3.9. Ecomil
- 21.3.9.1. Overview
- 21.3.9.2. Product Portfolio
- 21.3.9.3. Profitability by Market Segments (Product/Channel/Region)
- 21.3.9.4. Sales Footprint
- 21.3.9.5. Strategy Overview
- 21.3.10. Hiland Dairy
- 21.3.10.1. Overview
- 21.3.10.2. Product Portfolio
- 21.3.10.3. Profitability by Market Segments (Product/Channel/Region)
- 21.3.10.4. Sales Footprint
- 21.3.10.5. Strategy Overview
- 21.3.11. Natura Foods
- 21.3.11.1. Overview
- 21.3.11.2. Product Portfolio
- 21.3.11.3. Profitability by Market Segments (Product/Channel/Region)
- 21.3.11.4. Sales Footprint
- 21.3.11.5. Strategy Overview
- 21.3.12. Earth's Own Food Company Inc
- 21.3.12.1. Overview
- 21.3.12.2. Product Portfolio
- 21.3.12.3. Profitability by Market Segments (Product/Channel/Region)
- 21.3.12.4. Sales Footprint
- 21.3.12.5. Strategy Overview
- 21.3.13. Edward & Sons
- 21.3.13.1. Overview
- 21.3.13.2. Product Portfolio
- 21.3.13.3. Profitability by Market Segments (Product/Channel/Region)
- 21.3.13.4. Sales Footprint
- 21.3.13.5. Strategy Overview
- 21.3.14. Chef's Choice Food Manufacturer Company Limited
- 21.3.14.1. Overview
- 21.3.14.2. Product Portfolio
- 21.3.14.3. Profitability by Market Segments (Product/Channel/Region)
- 21.3.14.4. Sales Footprint
- 21.3.14.5. Strategy Overview
- 21.3.15. Liwayway Holdings Company Limited
- 21.3.15.1. Overview
- 21.3.15.2. Product Portfolio
- 21.3.15.3. Profitability by Market Segments (Product/Channel/Region)
- 21.3.15.4. Sales Footprint
- 21.3.15.5. Strategy Overview
- 21.3.16. Others (on additional request)
- 21.3.16.1. Overview
- 21.3.16.2. Product Portfolio
- 21.3.16.3. Profitability by Market Segments (Product/Channel/Region)
- 21.3.16.4. Sales Footprint
- 21.3.16.5. Strategy Overview
- 21.3.1. McCormick & Co.