|
|
市場調査レポート
商品コード
1647402
垂直農法市場の評価、メカニズム別、構造別、作物タイプ別、地域別、機会および予測、2018~2032年Vertical Farming Market Assessment, By Mechanism, By Structure, By Crop Type, By Region, Opportunities and Forecast, 2018-2032F |
||||||
|
|||||||
カスタマイズ可能
|
|||||||

| 垂直農法市場の評価、メカニズム別、構造別、作物タイプ別、地域別、機会および予測、2018~2032年 |
|
出版日: 2025年02月03日
発行: Markets & Data
ページ情報: 英文 227 Pages
納期: 3~5営業日
|

全表示
- 概要
- 図表
- 目次
世界の垂直農法市場は、2025~2032年の予測期間中にCAGR 21.46%を記録し、2024年の70億2,000万米ドルから2032年には332億5,000万米ドルに成長すると予測されています。同市場は、都市化の進展と相まって持続可能な農業の実践にもたらす急速な成長率と、世界の食糧安全保障を確保するために必要なソリューションを重要視しています。垂直農法は、作物を垂直に積み重ねて栽培するプロセスであり、水耕栽培などのシステムを取り入れ、資源利用を最適化し、LED照明やその他の装置を用いて生産性を高めています。このため、垂直農法は耕地への依存度が低く、水の消費量を減らすことができるとともに、外部の気候条件に左右されずに年間を通じて栽培することができます。世界人口の増加、耕地の減少、広範な気候変動の影響はすべて、垂直農法を、管理された環境で新鮮な無農薬農産物を生産するための優れたソリューションとして正当化しています。
さらに、垂直農法農場が都市中心部に近接していることで、輸送コストが削減され、保存期間が延び、新鮮で地元産の農産物を買いたい健康志向の消費者にとって手頃な価格となります。農業技術革新への公的制度や民間投資は、成長市場をさらに補完します。しかし、高い初期設定費用、エネルギー利用、高度な熟練労働力を必要とする制約が、迅速な普及を妨げる可能性があります。それでも、技術の向上と規模拡大の機会は、垂直農法市場を引き続き牽引していくと思われます。都市人口が増加し続け、消費者の持続可能性への意識が高まるなか、垂直農法は、貴重な天然資源を保護しながら将来の需要に対応する拡張可能なソリューションを提供する、食料生産方法における非常に重要な変化を提示します。
2024年3月、農業技術市場向けのソリューションを世界に設計するINSONGREENは、アフリカと中東で水耕栽培と温室による垂直農法事業を拡張しました。この事業は、アフリカ・中東地域における水不足、耕作限界、高い食糧需要などの問題を解決し、現地の農業活動をより環境に優しいものに改善・進化させることを目的として開発されました。
目次
第1章 プロジェクトの範囲と定義
第2章 調査手法
第3章 エグゼクティブサマリー
第4章 顧客の声
- 人口統計(所得- 低所得、中所得、高地域、国籍など)
- 市場認識と製品情報
- 購入決定時に考慮される要素
- テクノロジーの種類
- 料金
- スケーラビリティ
- ブランドの評判
- 使いやすさ
- 材料の品質
- エネルギー効率
- 栄養管理
- 水の使用
- スペース要件
- 作物の適合性
- 環境制御
- メンテナンス要件
- テクニカルサポート
- 保証と保証
- 購入チャネル
- 購入頻度
- 既存または予定ユーザー
第5章 世界の垂直農法市場の展望、2018年~2032年
- 市場規模の分析と予測
- 金額別
- 市場シェア分析と予測
- メカニズム別
- アクアポニックス
- エアロポニックス
- 水耕栽培
- 構造別
- 建物ベース
- 輸送コンテナベース
- その他
- 作物タイプ別
- 穀物
- 豆類および油糧種子
- 果物と野菜
- その他
- 地域別
- 北米
- 欧州
- アジア太平洋
- 南米
- 中東およびアフリカ
- 企業別市場シェア分析(上位5社およびその他- 金額別、2024年)
- メカニズム別
- 市場マップ分析、2024年
- メカニズム別
- 構造別
- 作物タイプ別
- 地域別
第6章 北米の垂直農法市場の展望、2018年~2032年*
- 市場規模の分析と予測
- 金額別
- 市場シェア分析と予測
- メカニズム別
- アクアポニックス
- エアロポニックス
- 水耕栽培
- 構造別
- 建物ベース
- 輸送コンテナベース
- その他
- 作物タイプ別
- 穀物
- 豆類および油糧種子
- 果物と野菜
- その他
- 国別シェア
- 米国
- カナダ
- メキシコ
- メカニズム別
- 国別市場評価
- 米国の垂直農法市場の見通し、2018~2032年
- 市場規模の分析と予測
- 市場シェア分析と予測
- カナダ
- メキシコ
- 米国の垂直農法市場の見通し、2018~2032年
すべてのセグメントは、対象となるすべての地域と国で提供されます。
第7章 欧州の垂直農法市場の見通し、2018年~2032年
- ドイツ
- フランス
- イタリア
- 英国
- ロシア
- オランダ
- スペイン
- トルコ
- ポーランド
第8章 アジア太平洋の垂直農法市場の展望、2018年~2032年
- インド
- 中国
- 日本
- オーストラリア
- ベトナム
- 韓国
- インドネシア
- フィリピン
第9章 南米の垂直農法市場の見通し、2018年~2032年
- ブラジル
- アルゼンチン
第10章 中東およびアフリカの垂直農法市場の見通し、2018年~2032年
- サウジアラビア
- アラブ首長国連邦
- 南アフリカ
第11章 規制状況
第12章 需要供給分析
第13章 バリューチェーン分析
第14章 ポーターのファイブフォース分析
第15章 PESTLE分析
第16章 マクロ経済指標
第17章 市場力学
- 市場促進要因
- 市場の課題
第18章 市場の動向と発展
第19章 ケーススタディ
第20章 競合情勢
- 市場リーダー上位5社の競合マトリックス
- 企業エコシステム分析(スタートアップvs中小企業vs大規模企業)
- 上位5社企業のSWOT分析
- 主要企業上位10社の市場情勢
- Freight Farms, Inc.
- 会社概要
- 主要経営陣
- 製品とサービス
- 財務状況(報告通り)
- 主な市場フォーカスと地理的プレゼンス
- 最近の動向/コラボレーション/ パートナーシップ/合併と買収
- AppHarvest, Inc.
- Triton Foodworks Private Limited
- Logiqs BV
- Argus Control Systems Limited
- Heliospectra AB
- Hydrodynamics International, Inc.
- Urban Crop Solutions BV
- Hawthorne Hydroponics LLC
- FarmByte Sdn Bhd
上記の企業は市場シェアに基づいて注文を保留しておらず、調査作業中に入手可能な情報に基づいて変更される可能性があります。
第21章 戦略的提言
第22章 調査会社について・免責事項
List of Tables
- Table 1. Competition Matrix of Top 5 Market Leaders
- Table 2. Mergers & Acquisitions/ Joint Ventures (If Applicable)
- Table 3. About Us - Regions and Countries Where We Have Executed Client Projects
List of Figures
- Figure 1. Global Vertical Farming Market, By Value, In USD Billion, 2018-2032F
- Figure 2. Global Vertical Farming Market Share (%), By Mechanism, 2018-2032F
- Figure 3. Global Vertical Farming Market Share (%), By Structure, 2018-2032F
- Figure 4. Global Vertical Farming Market Share (%), By Crop Type, 2018-2032F
- Figure 5. Global Vertical Farming Market Share (%), By Region, 2018-2032F
- Figure 6. North America Vertical Farming Market, By Value, In USD Billion, 2018-2032F
- Figure 7. North America Vertical Farming Market Share (%), By Mechanism, 2018-2032F
- Figure 8. North America Vertical Farming Market Share (%), By Structure, 2018-2032F
- Figure 9. North America Vertical Farming Market Share (%), By Crop Type, 2018-2032F
- Figure 10. North America Vertical Farming Market Share (%), By Country, 2018-2032F
- Figure 11. United States Vertical Farming Market, By Value, In USD Billion, 2018-2032F
- Figure 12. United States Vertical Farming Market Share (%), By Mechanism, 2018-2032F
- Figure 13. United States Vertical Farming Market Share (%), By Structure, 2018-2032F
- Figure 14. United States Vertical Farming Market Share (%), By Crop Type, 2018-2032F
- Figure 15. Canada Vertical Farming Market, By Value, In USD Billion, 2018-2032F
- Figure 16. Canada Vertical Farming Market Share (%), By Mechanism, 2018-2032F
- Figure 17. Canada Vertical Farming Market Share (%), By Structure, 2018-2032F
- Figure 18. Canada Vertical Farming Market Share (%), By Crop Type, 2018-2032F
- Figure 19. Mexico Vertical Farming Market, By Value, In USD Billion, 2018-2032F
- Figure 20. Mexico Vertical Farming Market Share (%), By Mechanism, 2018-2032F
- Figure 21. Mexico Vertical Farming Market Share (%), By Structure, 2018-2032F
- Figure 22. Mexico Vertical Farming Market Share (%), By Crop Type, 2018-2032F
- Figure 23. Europe Vertical Farming Market, By Value, In USD Billion, 2018-2032F
- Figure 24. Europe Vertical Farming Market Share (%), By Mechanism, 2018-2032F
- Figure 25. Europe Vertical Farming Market Share (%), By Structure, 2018-2032F
- Figure 26. Europe Vertical Farming Market Share (%), By Crop Type, 2018-2032F
- Figure 27. Europe Vertical Farming Market Share (%), By Country, 2018-2032F
- Figure 28. Germany Vertical Farming Market, By Value, In USD Billion, 2018-2032F
- Figure 29. Germany Vertical Farming Market Share (%), By Mechanism, 2018-2032F
- Figure 30. Germany Vertical Farming Market Share (%), By Structure, 2018-2032F
- Figure 31. Germany Vertical Farming Market Share (%), By Crop Type, 2018-2032F
- Figure 32. France Vertical Farming Market, By Value, In USD Billion, 2018-2032F
- Figure 33. France Vertical Farming Market Share (%), By Mechanism, 2018-2032F
- Figure 34. France Vertical Farming Market Share (%), By Structure, 2018-2032F
- Figure 35. France Vertical Farming Market Share (%), By Crop Type, 2018-2032F
- Figure 36. Italy Vertical Farming Market, By Value, In USD Billion, 2018-2032F
- Figure 37. Italy Vertical Farming Market Share (%), By Mechanism, 2018-2032F
- Figure 38. Italy Vertical Farming Market Share (%), By Structure, 2018-2032F
- Figure 39. Italy Vertical Farming Market Share (%), By Crop Type, 2018-2032F
- Figure 40. United Kingdom Vertical Farming Market, By Value, In USD Billion, 2018-2032F
- Figure 41. United Kingdom Vertical Farming Market Share (%), By Mechanism, 2018-2032F
- Figure 42. United Kingdom Vertical Farming Market Share (%), By Structure, 2018-2032F
- Figure 43. United Kingdom Vertical Farming Market Share (%), By Crop Type, 2018-2032F
- Figure 44. Russia Vertical Farming Market, By Value, In USD Billion, 2018-2032F
- Figure 45. Russia Vertical Farming Market Share (%), By Mechanism, 2018-2032F
- Figure 46. Russia Vertical Farming Market Share (%), By Structure, 2018-2032F
- Figure 47. Russia Vertical Farming Market Share (%), By Crop Type, 2018-2032F
- Figure 48. Netherlands Vertical Farming Market, By Value, In USD Billion, 2018-2032F
- Figure 49. Netherlands Vertical Farming Market Share (%), By Mechanism, 2018-2032F
- Figure 50. Netherlands Vertical Farming Market Share (%), By Structure, 2018-2032F
- Figure 51. Netherlands Vertical Farming Market Share (%), By Crop Type, 2018-2032F
- Figure 52. Spain Vertical Farming Market, By Value, In USD Billion, 2018-2032F
- Figure 53. Spain Vertical Farming Market Share (%), By Mechanism, 2018-2032F
- Figure 54. Spain Vertical Farming Market Share (%), By Structure, 2018-2032F
- Figure 55. Spain Vertical Farming Market Share (%), By Crop Type, 2018-2032F
- Figure 56. Turkey Vertical Farming Market, By Value, In USD Billion, 2018-2032F
- Figure 57. Turkey Vertical Farming Market Share (%), By Mechanism, 2018-2032F
- Figure 58. Turkey Vertical Farming Market Share (%), By Structure, 2018-2032F
- Figure 59. Turkey Vertical Farming Market Share (%), By Crop Type, 2018-2032F
- Figure 60. Poland Vertical Farming Market, By Value, In USD Billion, 2018-2032F
- Figure 61. Poland Vertical Farming Market Share (%), By Mechanism, 2018-2032F
- Figure 62. Poland Vertical Farming Market Share (%), By Structure, 2018-2032F
- Figure 63. Poland Vertical Farming Market Share (%), By Crop Type, 2018-2032F
- Figure 64. South America Vertical Farming Market, By Value, In USD Billion, 2018-2032F
- Figure 65. South America Vertical Farming Market Share (%), By Mechanism, 2018-2032F
- Figure 66. South America Vertical Farming Market Share (%), By Structure, 2018-2032F
- Figure 67. South America Vertical Farming Market Share (%), By Crop Type, 2018-2032F
- Figure 68. South America Vertical Farming Market Share (%), By Country, 2018-2032F
- Figure 69. Brazil Vertical Farming Market, By Value, In USD Billion, 2018-2032F
- Figure 70. Brazil Vertical Farming Market Share (%), By Mechanism, 2018-2032F
- Figure 71. Brazil Vertical Farming Market Share (%), By Structure, 2018-2032F
- Figure 72. Brazil Vertical Farming Market Share (%), By Crop Type, 2018-2032F
- Figure 73. Argentina Vertical Farming Market, By Value, In USD Billion, 2018-2032F
- Figure 74. Argentina Vertical Farming Market Share (%), By Mechanism, 2018-2032F
- Figure 75. Argentina Vertical Farming Market Share (%), By Structure, 2018-2032F
- Figure 76. Argentina Vertical Farming Market Share (%), By Crop Type, 2018-2032F
- Figure 77. Asia-Pacific Vertical Farming Market, By Value, In USD Billion, 2018-2032F
- Figure 78. Asia-Pacific Vertical Farming Market Share (%), By Mechanism, 2018-2032F
- Figure 79. Asia-Pacific Vertical Farming Market Share (%), By Structure, 2018-2032F
- Figure 80. Asia-Pacific Vertical Farming Market Share (%), By Crop Type, 2018-2032F
- Figure 81. Asia-Pacific Vertical Farming Market Share (%), By Country, 2018-2032F
- Figure 82. India Vertical Farming Market, By Value, In USD Billion, 2018-2032F
- Figure 83. India Vertical Farming Market Share (%), By Mechanism, 2018-2032F
- Figure 84. India Vertical Farming Market Share (%), By Structure, 2018-2032F
- Figure 85. India Vertical Farming Market Share (%), By Crop Type, 2018-2032F
- Figure 86. China Vertical Farming Market, By Value, In USD Billion, 2018-2032F
- Figure 87. China Vertical Farming Market Share (%), By Mechanism, 2018-2032F
- Figure 88. China Vertical Farming Market Share (%), By Structure, 2018-2032F
- Figure 89. China Vertical Farming Market Share (%), By Crop Type, 2018-2032F
- Figure 90. Japan Vertical Farming Market, By Value, In USD Billion, 2018-2032F
- Figure 91. Japan Vertical Farming Market Share (%), By Mechanism, 2018-2032F
- Figure 92. Japan Vertical Farming Market Share (%), By Structure, 2018-2032F
- Figure 93. Japan Vertical Farming Market Share (%), By Crop Type, 2018-2032F
- Figure 94. Australia Vertical Farming Market, By Value, In USD Billion, 2018-2032F
- Figure 95. Australia Vertical Farming Market Share (%), By Mechanism, 2018-2032F
- Figure 96. Australia Vertical Farming Market Share (%), By Structure, 2018-2032F
- Figure 97. Australia Vertical Farming Market Share (%), By Crop Type, 2018-2032F
- Figure 98. Vietnam Vertical Farming Market, By Value, In USD Billion, 2018-2032F
- Figure 99. Vietnam Vertical Farming Market Share (%), By Mechanism, 2018-2032F
- Figure 100. Vietnam Vertical Farming Market Share (%), By Structure, 2018-2032F
- Figure 101. Vietnam Vertical Farming Market Share (%), By Crop Type, 2018-2032F
- Figure 102. South Korea Vertical Farming Market, By Value, In USD Billion, 2018-2032F
- Figure 103. South Korea Vertical Farming Market Share (%), By Mechanism, 2018-2032F
- Figure 104. South Korea Vertical Farming Market Share (%), By Structure, 2018-2032F
- Figure 105. South Korea Vertical Farming Market Share (%), By Crop Type, 2018-2032F
- Figure 106. Indonesia Vertical Farming Market, By Value, In USD Billion, 2018-2032F
- Figure 107. Indonesia Vertical Farming Market Share (%), By Mechanism, 2018-2032F
- Figure 108. Indonesia Vertical Farming Market Share (%), By Structure, 2018-2032F
- Figure 109. Indonesia Vertical Farming Market Share (%), By Crop Type, 2018-2032F
- Figure 110. Philippines Vertical Farming Market, By Value, In USD Billion, 2018-2032F
- Figure 111. Philippines Vertical Farming Market Share (%), By Mechanism, 2018-2032F
- Figure 112. Philippines Vertical Farming Market Share (%), By Structure, 2018-2032F
- Figure 113. Philippines Vertical Farming Market Share (%), By Crop Type, 2018-2032F
- Figure 114. Middle East & Africa Vertical Farming Market, By Value, In USD Billion, 2018-2032F
- Figure 115. Middle East & Africa Vertical Farming Market Share (%), By Mechanism, 2018-2032F
- Figure 116. Middle East & Africa Vertical Farming Market Share (%), By Structure, 2018-2032F
- Figure 117. Middle East & Africa Vertical Farming Market Share (%), By Crop Type, 2018-2032F
- Figure 118. Middle East & Africa Vertical Farming Market Share (%), By Country, 2018-2032F
- Figure 119. Saudi Arabia Vertical Farming Market, By Value, In USD Billion, 2018-2032F
- Figure 120. Saudi Arabia Vertical Farming Market Share (%), By Mechanism, 2018-2032F
- Figure 121. Saudi Arabia Vertical Farming Market Share (%), By Structure, 2018-2032F
- Figure 122. Saudi Arabia Vertical Farming Market Share (%), By Crop Type, 2018-2032F
- Figure 123. UAE Vertical Farming Market, By Value, In USD Billion, 2018-2032F
- Figure 124. UAE Vertical Farming Market Share (%), By Mechanism, 2018-2032F
- Figure 125. UAE Vertical Farming Market Share (%), By Structure, 2018-2032F
- Figure 126. UAE Vertical Farming Market Share (%), By Crop Type, 2018-2032F
- Figure 127. South Africa Vertical Farming Market, By Value, In USD Billion, 2018-2032F
- Figure 128. South Africa Vertical Farming Market Share (%), By Mechanism, 2018-2032F
- Figure 129. South Africa Vertical Farming Market Share (%), By Structure, 2018-2032F
- Figure 130. South Africa Vertical Farming Market Share (%), By Crop Type, 2018-2032F
- Figure 131. By Mechanism Map-Market Size (USD Billion) & Growth Rate (%), 2024
- Figure 132. By Structure Map-Market Size (USD Billion) & Growth Rate (%), 2024
- Figure 133. By Crop Type Map-Market Size (USD Billion) & Growth Rate (%), 2024
- Figure 134. By Region Map-Market Size (USD Billion) & Growth Rate (%), 2024
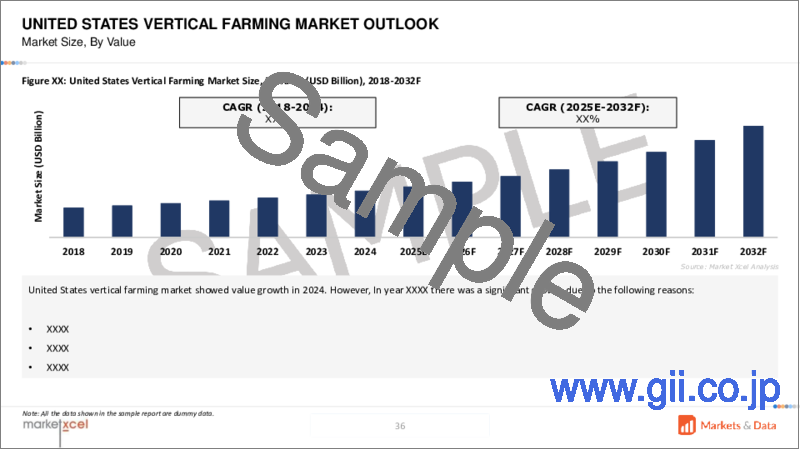
Global vertical farming market is projected to witness a CAGR of 21.46% during the forecast period 2025-2032, growing from USD 7.02 billion in 2024 to USD 33.25 billion in 2032. The market is assigning importance to the rapid growth rate it brings into sustainable practices of agriculture coupled with increasing urbanization and the solutions needed to ensure global food security. Vertical farming is a process of growing crops in vertically stacked layers and incorporating systems such as hydroponics, optimizing resource use, and enhancing productivity using LED lighting and other devices. Due to this, vertical farming makes less dependency on arable land and is able to lessen the amount of water consumption while allowing for year-round cultivation irrespective of external climatic conditions. The increasing global population, reducing arable lands, and wide-ranging climate change effects have all justified vertical farming as a good solution for producing fresh, pesticide-free produce in a controlled environment.
Further, vertical farms being in proximity to urban centers cut down transport costs, increases the shelf life, and makes it affordable to the health-conscious consumers wanting to buy fresh and local produce. Public schemes and private investments in agri-tech innovations supplement the growing market further. However, high initial set costs, energy utilization, and highly skilled labor requirement constraints may impede speedy take-up. Nonetheless, improvements in technology and scaling opportunities shall continue to drive the vertical farming market. Vertical farming, as urban populations continue increasing and consumers become more aware of sustainability, presents a very important change in how food is produced, offering scalable solutions to future demand while conserving precious natural resources.
In March 2024, INSONGREEN, which designs solutions for the agro-technology market globally, extended its hydroponics and green house vertical farming business in Africa and the Middle East. This extension was developed to solve problems such as lack of water, limited arability, and very high food demands in such regions with the overall aim of improving and evolving local farming activities toward being more eco-friendly.
Growing Awareness for Food Security Catalyzes Market Expansion
Food security has become a major issue in the world today, with an increasing population, limited land available for farming, and climate change degrading the quality of land. Vertical farming offers a sustainable way to produce fresh food entirely under controlled conditions, independent of external climatic conditions. A regular supply of crops addresses the erratic problems of traditional agriculture, such as extreme weather conditions, pests, and soil degradation. Making the most of vertical spaces, while using advanced technologies, such as hydroponics and aeroponics, vertical farming maximizes crop yield per square foot, making it suitable for densely populated areas where farmland is limited.
All-year-round cultivation ensures food production without worrying about the seasons, this creates certainty in food-deficient areas or areas where reliance on imported foods is high. It further enhances the crop production portfolios available in places to meet the prevailing dietary requirements and preferences.
In August 2024, iFarm began the construction of vertical farm in Switzerland, using its iFarm StackGrow technology. This vertical farm will have a cultivation area of 1,031 m2, and green crops will be produced in tons of ultra-fresh greens per month. The yield will be distributed to major retail chains across the country.
Increased Resource Efficiency Influences Market Growth
Vertical farming considerably improves efficiency in resource use and thus offers a sustainable alternative to traditional agriculture. It can use as much as 95% less water by utilizing closed-loop systems in which the water is recycled and reused. This resource use reduction is critical because freshwater resources are becoming scarcer globally. Vertical farms also tend to have a significantly smaller land footprint as they grow crops in vertical space instead of occupying more land area and solve the problems of ever-increasing urbanization and deforestation.
Additionally, no chemical runoff is produced to contaminate surrounding ecosystems. Nutrient applications have been managed and tailored specifically for each crop, thus minimizing waste further. Use of LED mimics sunlight while minimizing consumption for optimizing energy usage. In addition, strong efficiency using vertical farming to localize production reduces transportation costs and emissions involved in transporting food, contributing to reducing the carbon footprint.
Capitalizing on the trend, in February 2024, Masdar City introduced its first indoor vertical farm in collaboration with Alesca Technologies, an agricultural innovation company specializing in complete localized farming solutions. Located in repurposed shipping containers and placed near Masdar City's Eco-Plaza, the farm comprises two fully fitted commercial-sized farming containers capable of producing over 650 kg of leafy greens every month of the year to provide farm-to-fork experience.
Hydroponics Hold the Majority Market Share
Hydroponics provides the largest percentage of vertical farming as it is resource saving and highly efficient in urban settings. This soilless culture of growing plants in extremely nutrient-rich water solutions allows for the control of nutrient supply as well as the pH to the optimum level for plant growth. This technique eliminates pest and weed-related soil-related issues, enhancing the crop's quality and yield-yielding with reduced dependence on pesticides and herbicides.
This method, flexible and adaptive, allows for its use in highly compact urban spaces, thus making it most suitable for vertical farming in cities. It ensures all-round crop production throughout the year, with no interruption due to seasonal changes or climatic conditions resulting in constant availability of fresh produce. Advances in technology, such as automated nutrient delivery and monitoring systems, add to the efficiency and scale of hydroponics.
In July 2024, Globalmex International Inc. produced roma tomatoes under Magic Sun brand in central Mexico using a hydroponic greenhouse. By using developed hydroponic systems in conjunction with high-altitude sites in central Mexico, it provides a continuous harvest by safeguarding it from adverse weather conditions. The company adds this particular new crop to its already existing Magic Sun's production of traditional and USDA-certified organic greenhouse tomatoes.
Europe Dominates the Market
Europe is the most prominent vertical farming market across the globe. The reduction of carbon emissions as well as security in terms of food have made vertical farming essential to the region. In addition, an ever-increasing urbanization coupled with a shortage of arable land, especially in countries like the Netherlands, Germany, and the UK, are further driving the vertical farming trend in the region. Moreover, the region is advancing its farming systems with the integration of leading technologies such as IoT, robotics, and artificial intelligence to increase productivity and efficiency of resource utilization in the sector.
Vertical farming has witnessed a surge in importance within the European community as local consumers have shifted to a new preference for the crop, especially one that is grown completely without pesticides. Additionally, public as well as private investments in research and development into new products have helped create new ideas for developing solutions in vertical farming, thus enabling Europe to take the lead worldwide.
In September 2024, Inagro vzw and Urban Crop Solutions BV, in order to build three vertical farming towers at Agrotopia Ireland Limited, inaugurated their first vertical farming tower. The tower uses dynamic LED lighting in conjunction with natural sunlight as a technique for enabling space-efficient agriculture. This integrated system of multi-layer cultivation and dynamic lighting with natural sunlight has maximized space usage, thus marking a very important turn in sustainable agriculture for food production in cities.
Future Market Scenario (2025 - 2032F)
Vertical farming is likely to be an important factor in future urban sustainability efforts, providing smart cities with food production.
Owing to developments in technology and economies of scale, vertical farming is going to become increasingly affordable and eventually accessible for everyone.
Companies will be increasingly fostering alliances with technology providers, retailers, and governments for scaling their operations and enhancing market access.
Key Players Landscape and Outlook
Vertical farming is a dynamic market with a landscape of major players emphasizing innovation, efficiency, and sustainability. The landscape involves the big agricultural technology companies, the young startups, and research organizations which are using new solutions in hydroponics, aeroponics, and smart monitoring systems to enhance productivity. Additionally, they are encouraging energy efficiency with the latest LED lighting systems and renewable energy sources to reduce operating costs and environmental damage.
The market outlook seems positive for such players, fueled by the increasing global demand for sustainable food solutions, especially in urban areas. Companies are extending their geographical scope, targeting emerging markets in Asia-Pacific and the Middle East while scaling up in mature markets such as Europe and North America. Continued investments in R&D and technological advancements are likely to supplement the existing crop diversity and system automation, thus making vertical farming economically viable. As the market expands, competition will increase, and players are expected to focus on strategic alliances and new business models to stay ahead of the competition.
In February 2024, FarmByte Sdn Bhd and Archisen Pte Ltd formed a joint venture to establish a technologically driven indoor vertical farm in Johor Bahru, Malaysia. With an estimated capital of USD 8.22 million, the 52,000-square-foot farm envisions producing more than 306,000 kg of leafy vegetables annually. The project will achieve economic growth, employment generation, and promotion of sustainable agricultural practices across the region.
Table of Contents
1. Project Scope and Definitions
2. Research Methodology
3. Executive Summary
4. Voice of Customer
- 4.1. Demographics (Income - Low, Mid and High; Geography; Nationality; etc.)
- 4.2. Market Awareness and Product Information
- 4.3. Factors Considered in Purchase Decision
- 4.3.1. Technology Type
- 4.3.2. Cost
- 4.3.3. Scalability
- 4.3.4. Brand Reputation
- 4.3.5. Ease of Use
- 4.3.6. Quality of Materials
- 4.3.7. Energy Efficiency
- 4.3.8. Nutrient Management
- 4.3.9. Water Usage
- 4.3.10. Space Requirements
- 4.3.11. Crop Compatibility
- 4.3.12. Environmental Control
- 4.3.13. Maintenance Requirements
- 4.3.14. Technical Support
- 4.3.15. Warranty and Guarantee
- 4.4. Purchase Channel
- 4.5. Frequency of Purchase
- 4.6. Existing or Intended User
5. Global Vertical Farming Market Outlook, 2018-2032F
- 5.1. Market Size Analysis & Forecast
- 5.1.1. By Value
- 5.2. Market Share Analysis & Forecast
- 5.2.1. By Mechanism
- 5.2.1.1. Aquaponics
- 5.2.1.2. Aeroponics
- 5.2.1.3. Hydroponics
- 5.2.2. By Structure
- 5.2.2.1. Building-based
- 5.2.2.2. Shipping Container-based
- 5.2.2.3. Others
- 5.2.3. By Crop Type
- 5.2.3.1. Cereals and Grains
- 5.2.3.2. Pulses and Oilseeds
- 5.2.3.3. Fruits and Vegetables
- 5.2.3.4. Others
- 5.2.4. By Region
- 5.2.4.1. North America
- 5.2.4.2. Europe
- 5.2.4.3. Asia-Pacific
- 5.2.4.4. South America
- 5.2.4.5. Middle East and Africa
- 5.2.5. By Company Market Share Analysis (Top 5 Companies and Others - By Value, 2024)
- 5.2.1. By Mechanism
- 5.3. Market Map Analysis, 2024
- 5.3.1. By Mechanism
- 5.3.2. By Structure
- 5.3.3. By Crop Type
- 5.3.4. By Region
6. North America Vertical Farming Market Outlook, 2018-2032F*
- 6.1. Market Size Analysis & Forecast
- 6.1.1. By Value
- 6.2. Market Share Analysis & Forecast
- 6.2.1. By Mechanism
- 6.2.1.1. Aquaponics
- 6.2.1.2. Aeroponics
- 6.2.1.3. Hydroponics
- 6.2.2. By Structure
- 6.2.2.1. Building-based
- 6.2.2.2. Shipping Container-based
- 6.2.2.3. Others
- 6.2.3. By Crop Type
- 6.2.3.1. Cereals and Grains
- 6.2.3.2. Pulses and Oilseeds
- 6.2.3.3. Fruits and Vegetables
- 6.2.3.4. Others
- 6.2.4. By Country Share
- 6.2.4.1. United States
- 6.2.4.2. Canada
- 6.2.4.3. Mexico
- 6.2.1. By Mechanism
- 6.3. Country Market Assessment
- 6.3.1. United States Vertical Farming Market Outlook, 2018-2032F*
- 6.3.1.1. Market Size Analysis & Forecast
- 6.3.1.1.1. By Value
- 6.3.1.2. Market Share Analysis & Forecast
- 6.3.1.2.1. By Mechanism
- 6.3.1.2.1.1. Aquaponics
- 6.3.1.2.1.2. Aeroponics
- 6.3.1.2.1.3. Hydroponics
- 6.3.1.2.2. By Structure
- 6.3.1.2.2.1. Building-based
- 6.3.1.2.2.2. Shipping Container-based
- 6.3.1.2.2.3. Others
- 6.3.1.2.3. By Crop Type
- 6.3.1.2.3.1. Cereals and Grains
- 6.3.1.2.3.2. Pulses and Oilseeds
- 6.3.1.2.3.3. Fruits and Vegetables
- 6.3.1.2.3.4. Others
- 6.3.1.2.1. By Mechanism
- 6.3.1.1. Market Size Analysis & Forecast
- 6.3.2. Canada
- 6.3.3. Mexico
- 6.3.1. United States Vertical Farming Market Outlook, 2018-2032F*
All segments will be provided for all regions and countries covered
7. Europe Vertical Farming Market Outlook, 2018-2032F
- 7.1. Germany
- 7.2. France
- 7.3. Italy
- 7.4. United Kingdom
- 7.5. Russia
- 7.6. Netherlands
- 7.7. Spain
- 7.8. Turkey
- 7.9. Poland
8. Asia-Pacific Vertical Farming Market Outlook, 2018-2032F
- 8.1. India
- 8.2. China
- 8.3. Japan
- 8.4. Australia
- 8.5. Vietnam
- 8.6. South Korea
- 8.7. Indonesia
- 8.8. Philippines
9. South America Vertical Farming Market Outlook, 2018-2032F
- 9.1. Brazil
- 9.2. Argentina
10. Middle East and Africa Vertical Farming Market Outlook, 2018-2032F
- 10.1. Saudi Arabia
- 10.2. UAE
- 10.3. South Africa
11. Regulatory Landscape
12. Demand Supply Analysis
13. Value Chain Analysis
14. Porter's Five Forces Analysis
15. PESTLE Analysis
16. Macro-economic Indicators
17. Market Dynamics
- 17.1. Market Drivers
- 17.2. Market Challenges
18. Market Trends and Developments
19. Case Studies
20. Competitive Landscape
- 20.1. Competition Matrix of Top 5 Market Leaders
- 20.2. Company Ecosystem Analysis (Startup v/s SME v/s Large-scale)
- 20.3. SWOT Analysis for Top 5 Players
- 20.4. Key Players Landscape for Top 10 Market Players
- 20.4.1. Freight Farms, Inc.
- 20.4.1.1. Company Details
- 20.4.1.2. Key Management Personnel
- 20.4.1.3. Products and Services
- 20.4.1.4. Financials (As Reported)
- 20.4.1.5. Key Market Focus and Geographical Presence
- 20.4.1.6. Recent Developments/Collaborations/Partnerships/Mergers and Acquisition
- 20.4.2. AppHarvest, Inc.
- 20.4.3. Triton Foodworks Private Limited
- 20.4.4. Logiqs B.V.
- 20.4.5. Argus Control Systems Limited
- 20.4.6. Heliospectra AB
- 20.4.7. Hydrodynamics International, Inc.
- 20.4.8. Urban Crop Solutions BV
- 20.4.9. Hawthorne Hydroponics LLC
- 20.4.10. FarmByte Sdn Bhd
- 20.4.1. Freight Farms, Inc.
Companies mentioned above DO NOT hold any order as per market share and can be changed as per information available during research work.
