|
|
市場調査レポート
商品コード
1475032
個人ローン市場:タイプ別、ローン期間別、年齢別、雇用形態別、地域別、機会、予測、2017年~2031年Personal Loan Market Assessment, By Type, By Loan Tenure, By Age, By Employment Type, By Region, Opportunities and Forecast, 2017-2031F |
||||||

|
|||||||
カスタマイズ可能
|
|||||||

| 個人ローン市場:タイプ別、ローン期間別、年齢別、雇用形態別、地域別、機会、予測、2017年~2031年 |
|
出版日: 2024年05月08日
発行: Markets & Data
ページ情報: 英文 227 Pages
納期: 3~5営業日
|

全表示
- 概要
- 図表
- 目次
世界の個人ローンの市場規模は、2024年から2031年の予測期間中に15.65%のCAGRで拡大し、2023年の721億4,000万米ドルから2031年には2,308億6,000万米ドルに成長すると予測されています。世界の個人ローン市場は金融サービス産業の重要な柱として機能しており、個人および消費者の多様なニーズに対して有担保および無担保の資金へのアクセスを個人に提供しています。
世界の個人ローン市場は弾力性があり、消費者のライフスタイルが変化し、世界中で余分な経済的支援に対する要求が絶えないため、長年にわたって一貫して成長してきました。世界の個人ローン市場は非常にダイナミックで、銀行、NBFC、その他の金融機関など、さまざまな背景や要件を持つ顧客に対応する多数の機関がひしめいています。市場の参入企業は、伝統的な銀行から革新的なフィンテックスタートアップに至るまで、嗜好の変化や技術の進歩によって消費者金融の状況が進化していることを反映しています。
当レポートでは、世界の個人ローン市場について調査し、市場の概要とともに、タイプ別、ローン期間別、年齢別、雇用形態別、地域別動向、および市場に参入する企業のプロファイルなどを提供しています。
目次
第1章 調査手法
第2章 プロジェクトの範囲と定義
第3章 エグゼクティブサマリー
第4章 顧客の声
第5章 世界の個人ローン市場の見通し、2017年~2031年
- 市場規模と予測
- タイプ別
- ローン期間別
- 年齢別
- 雇用形態別
- 地域別
- 企業別市場シェア(%)、2023年
第6章 世界の個人ローン市場の見通し、地域別、2017年~2031年
- 北米
- 欧州
- 南米
- アジア太平洋
- 中東・アフリカ
第7章 市場マッピング、2023年
第8章 マクロ環境と産業構造
- 供給需要分析
- 輸入輸出分析
- バリューチェーン分析
- PESTEL分析
- ポーターのファイブフォース分析
第9章 市場力学
第10章 主要参入企業の情勢
第11章 個人ローンの金利分析
第12章 ケーススタディ
第13章 主要参入企業の見通し
- Citigroup Inc
- American Express Company
- U.S. Bancorp
- Discover Financial Services
- JPMorgan Chase & Co.
- WELLS FINANCIAL CORP
- Barclays PLC
- Development Bank of Singapore Limited
- PNC Financial Services Group, Inc.
- ICBC Co., Ltd
第14章 戦略的提言
第15章 お問い合わせと免責事項
List of Tables
- Table 1. Pricing Analysis of Products from Key Players
- Table 2. Competition Matrix of Top 5 Market Leaders
- Table 3. Mergers & Acquisitions/ Joint Ventures (If Applicable)
- Table 4. About Us - Regions and Countries Where We Have Executed Client Projects
List of Figures
- Figure 1.Global Personal Loan Market, By Value, In USD Billion, 2017-2031F
- Figure 2.Global Personal Loan Market Share (%), By Type, 2017-2031F
- Figure 3.Global Personal Loan Market Share (%), By Loan Tenure, 2017-2031F
- Figure 4.Global Personal Loan Market Share (%), By Age, 2017-2031F
- Figure 5.Global Personal Loan Market Share (%), By Employment Type, 2017-2031F
- Figure 6.Global Personal Loan Market Share (%), By Region, 2017-2031F
- Figure 7.North America Personal Loan Market, By Value, In USD Billion, 2017-2031F
- Figure 8.North America Personal Loan Market Share (%), By Type, 2017-2031F
- Figure 9.North America Personal Loan Market Share (%), By Loan Tenure, 2017-2031F
- Figure 10.North America Personal Loan Market Share (%), By Age, 2017-2031F
- Figure 11.North America Personal Loan Market Share (%), By Employment Type, 2017-2031F
- Figure 12.North America Personal Loan Market Share (%), By Country, 2017-2031F
- Figure 13.United States Personal Loan Market, By Value, In USD Billion, 2017-2031F
- Figure 14.United States Personal Loan Market Share (%), By Type, 2017-2031F
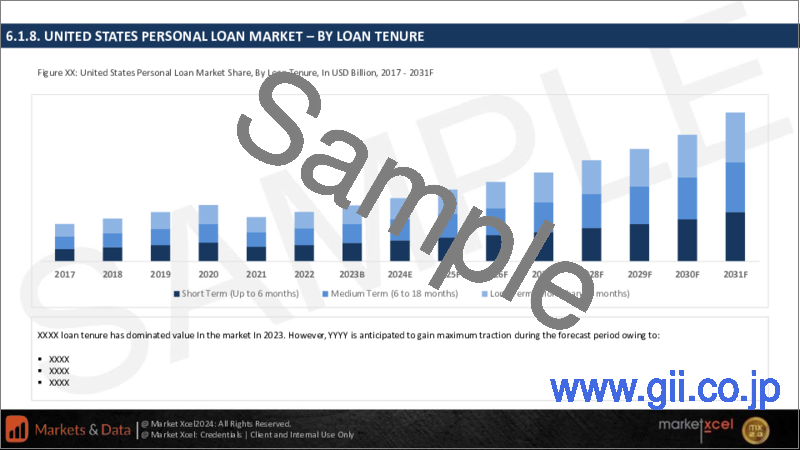
- Figure 15.United States Personal Loan Market Share (%), By Loan Tenure, 2017-2031F
- Figure 16.United States Personal Loan Market Share (%), By Age, 2017-2031F
- Figure 17.United States Personal Loan Market Share (%), By Employment Type, 2017-2031F
- Figure 18.Canada Personal Loan Market, By Value, In USD Billion, 2017-2031F
- Figure 19.Canada Personal Loan Market Share (%), By Type, 2017-2031F
- Figure 20.Canada Personal Loan Market Share (%), By Loan Tenure, 2017-2031F
- Figure 21.Canada Personal Loan Market Share (%), By Age, 2017-2031F
- Figure 22.Canada Personal Loan Market Share (%), By Employment Type, 2017-2031F
- Figure 23.Mexico Personal Loan Market, By Value, In USD Billion, 2017-2031F
- Figure 24.Mexico Personal Loan Market Share (%), By Type, 2017-2031F
- Figure 25.Mexico Personal Loan Market Share (%), By Loan Tenure, 2017-2031F
- Figure 26.Mexico Personal Loan Market Share (%), By Age, 2017-2031F
- Figure 27.Mexico Personal Loan Market Share (%), By Employment Type, 2017-2031F
- Figure 28.Europe Personal Loan Market, By Value, In USD Billion, 2017-2031F
- Figure 29.Europe Personal Loan Market Share (%), By Type, 2017-2031F
- Figure 30.Europe Personal Loan Market Share (%), By Loan Tenure, 2017-2031F
- Figure 31.Europe Personal Loan Market Share (%), By Age, 2017-2031F
- Figure 32.Europe Personal Loan Market Share (%), By Employment Type, 2017-2031F
- Figure 33.Europe Personal Loan Market Share (%), By Country, 2017-2031F
- Figure 34.Germany Personal Loan Market, By Value, In USD Billion, 2017-2031F
- Figure 35.Germany Personal Loan Market Share (%), By Type, 2017-2031F
- Figure 36.Germany Personal Loan Market Share (%), By Loan Tenure, 2017-2031F
- Figure 37.Germany Personal Loan Market Share (%), By Age, 2017-2031F
- Figure 38.Germany Personal Loan Market Share (%), By Employment Type, 2017-2031F
- Figure 39.France Personal Loan Market, By Value, In USD Billion, 2017-2031F
- Figure 40.France Personal Loan Market Share (%), By Type, 2017-2031F
- Figure 41.France Personal Loan Market Share (%), By Loan Tenure, 2017-2031F
- Figure 42.France Personal Loan Market Share (%), By Age, 2017-2031F
- Figure 43.France Personal Loan Market Share (%), By Employment Type, 2017-2031F
- Figure 44.Italy Personal Loan Market, By Value, In USD Billion, 2017-2031F
- Figure 45.Italy Personal Loan Market Share (%), By Type, 2017-2031F
- Figure 46.Italy Personal Loan Market Share (%), By Loan Tenure, 2017-2031F
- Figure 47.Italy Personal Loan Market Share (%), By Age, 2017-2031F
- Figure 48.Italy Personal Loan Market Share (%), By Employment Type, 2017-2031F
- Figure 49.United Kingdom Personal Loan Market, By Value, In USD Billion, 2017-2031F
- Figure 50.United Kingdom Personal Loan Market Share (%), By Type, 2017-2031F
- Figure 51.United Kingdom Personal Loan Market Share (%), By Loan Tenure, 2017-2031F
- Figure 52.United Kingdom Personal Loan Market Share (%), By Age, 2017-2031F
- Figure 53.United Kingdom Personal Loan Market Share (%), By Employment Type, 2017-2031F
- Figure 54.Russia Personal Loan Market, By Value, In USD Billion, 2017-2031F
- Figure 55.Russia Personal Loan Market Share (%), By Type, 2017-2031F
- Figure 56.Russia Personal Loan Market Share (%), By Loan Tenure, 2017-2031F
- Figure 57.Russia Personal Loan Market Share (%), By Age, 2017-2031F
- Figure 58.Russia Personal Loan Market Share (%), By Employment Type, 2017-2031F
- Figure 59.Netherlands Personal Loan Market, By Value, In USD Billion, 2017-2031F
- Figure 60.Netherlands Personal Loan Market Share (%), By Type, 2017-2031F
- Figure 61.Netherlands Personal Loan Market Share (%), By Loan Tenure, 2017-2031F
- Figure 62.Netherlands Personal Loan Market Share (%), By Age, 2017-2031F
- Figure 63.Netherlands Personal Loan Market Share (%), By Employment Type, 2017-2031F
- Figure 64.Spain Personal Loan Market, By Value, In USD Billion, 2017-2031F
- Figure 65.Spain Personal Loan Market Share (%), By Type, 2017-2031F
- Figure 66.Spain Personal Loan Market Share (%), By Loan Tenure, 2017-2031F
- Figure 67.Spain Personal Loan Market Share (%), By Age, 2017-2031F
- Figure 68.Spain Personal Loan Market Share (%), By Employment Type, 2017-2031F
- Figure 69.Turkey Personal Loan Market, By Value, In USD Billion, 2017-2031F
- Figure 70.Turkey Personal Loan Market Share (%), By Type, 2017-2031F
- Figure 71.Turkey Personal Loan Market Share (%), By Loan Tenure, 2017-2031F
- Figure 72.Turkey Personal Loan Market Share (%), By Age, 2017-2031F
- Figure 73.Turkey Personal Loan Market Share (%), By Employment Type, 2017-2031F
- Figure 74.Poland Personal Loan Market, By Value, In USD Billion, 2017-2031F
- Figure 75.Poland Personal Loan Market Share (%), By Type, 2017-2031F
- Figure 76.Poland Personal Loan Market Share (%), By Loan Tenure, 2017-2031F
- Figure 77.Poland Personal Loan Market Share (%), By Age, 2017-2031F
- Figure 78.Poland Personal Loan Market Share (%), By Employment Type, 2017-2031F
- Figure 79.South America Personal Loan Market, By Value, In USD Billion, 2017-2031F
- Figure 80.South America Personal Loan Market Share (%), By Type, 2017-2031F
- Figure 81.South America Personal Loan Market Share (%), By Loan Tenure, 2017-2031F
- Figure 82.South America Personal Loan Market Share (%), By Age, 2017-2031F
- Figure 83.South America Personal Loan Market Share (%), By Employment Type, 2017-2031F
- Figure 84.South America Personal Loan Market Share (%), By Country, 2017-2031F
- Figure 85.Brazil Personal Loan Market, By Value, In USD Billion, 2017-2031F
- Figure 86.Brazil Personal Loan Market Share (%), By Type, 2017-2031F
- Figure 87.Brazil Personal Loan Market Share (%), By Loan Tenure, 2017-2031F
- Figure 88.Brazil Personal Loan Market Share (%), By Age, 2017-2031F
- Figure 89.Brazil Personal Loan Market Share (%), By Employment Type, 2017-2031F
- Figure 90.Argentina Personal Loan Market, By Value, In USD Billion, 2017-2031F
- Figure 91.Argentina Personal Loan Market Share (%), By Type, 2017-2031F
- Figure 92.Argentina Personal Loan Market Share (%), By Loan Tenure, 2017-2031F
- Figure 93.Argentina Personal Loan Market Share (%), By Age, 2017-2031F
- Figure 94.Argentina Personal Loan Market Share (%), By Employment Type, 2017-2031F
- Figure 95.Asia-Pacific Personal Loan Market, By Value, In USD Billion, 2017-2031F
- Figure 96.Asia-Pacific Personal Loan Market Share (%), By Type, 2017-2031F
- Figure 97.Asia-Pacific Personal Loan Market Share (%), By Loan Tenure, 2017-2031F
- Figure 98.Asia-Pacific Personal Loan Market Share (%), By Age, 2017-2031F
- Figure 99.Asia-Pacific Personal Loan Market Share (%), By Employment Type, 2017-2031F
- Figure 100.Asia-Pacific Personal Loan Market Share (%), By Country, 2017-2031F
- Figure 101.India Personal Loan Market, By Value, In USD Billion, 2017-2031F
- Figure 102.India Personal Loan Market Share (%), By Type, 2017-2031F
- Figure 103.India Personal Loan Market Share (%), By Loan Tenure, 2017-2031F
- Figure 104.India Personal Loan Market Share (%), By Age, 2017-2031F
- Figure 105.India Personal Loan Market Share (%), By Employment Type, 2017-2031F
- Figure 106.China Personal Loan Market, By Value, In USD Billion, 2017-2031F
- Figure 107.China Personal Loan Market Share (%), By Type, 2017-2031F
- Figure 108.China Personal Loan Market Share (%), By Loan Tenure, 2017-2031F
- Figure 109.China Personal Loan Market Share (%), By Age, 2017-2031F
- Figure 110.China Personal Loan Market Share (%), By Employment Type, 2017-2031F
- Figure 111.Japan Personal Loan Market, By Value, In USD Billion, 2017-2031F
- Figure 112.Japan Personal Loan Market Share (%), By Type, 2017-2031F
- Figure 113.Japan Personal Loan Market Share (%), By Loan Tenure, 2017-2031F
- Figure 114.Japan Personal Loan Market Share (%), By Age, 2017-2031F
- Figure 115.Japan Personal Loan Market Share (%), By Employment Type, 2017-2031F
- Figure 116.Australia Personal Loan Market, By Value, In USD Billion, 2017-2031F
- Figure 117.Australia Personal Loan Market Share (%), By Type, 2017-2031F
- Figure 118.Australia Personal Loan Market Share (%), By Loan Tenure, 2017-2031F
- Figure 119.Australia Personal Loan Market Share (%), By Age, 2017-2031F
- Figure 120.Australia Personal Loan Market Share (%), By Employment Type, 2017-2031F
- Figure 121.Vietnam Personal Loan Market, By Value, In USD Billion, 2017-2031F
- Figure 122.Vietnam Personal Loan Market Share (%), By Type, 2017-2031F
- Figure 123.Vietnam Personal Loan Market Share (%), By Loan Tenure, 2017-2031F
- Figure 124.Vietnam Personal Loan Market Share (%), By Age, 2017-2031F
- Figure 125.Vietnam Personal Loan Market Share (%), By Employment Type, 2017-2031F
- Figure 126.South Korea Personal Loan Market, By Value, In USD Billion, 2017-2031F
- Figure 127.South Korea Personal Loan Market Share (%), By Type, 2017-2031F
- Figure 128.South Korea Personal Loan Market Share (%), By Loan Tenure, 2017-2031F
- Figure 129.South Korea Personal Loan Market Share (%), By Age, 2017-2031F
- Figure 130.South Korea Personal Loan Market Share (%), By Employment Type, 2017-2031F
- Figure 131.Indonesia Personal Loan Market, By Value, In USD Billion, 2017-2031F
- Figure 132.Indonesia Personal Loan Market Share (%), By Type, 2017-2031F
- Figure 133.Indonesia Personal Loan Market Share (%), By Loan Tenure, 2017-2031F
- Figure 134.Indonesia Personal Loan Market Share (%), By Age, 2017-2031F
- Figure 135.Indonesia Personal Loan Market Share (%), By Employment Type, 2017-2031F
- Figure 136.Philippines Personal Loan Market, By Value, In USD Billion, 2017-2031F
- Figure 137.Philippines Personal Loan Market Share (%), By Type, 2017-2031F
- Figure 138.Philippines Personal Loan Market Share (%), By Loan Tenure, 2017-2031F
- Figure 139.Philippines Personal Loan Market Share (%), By Age, 2017-2031F
- Figure 140.Philippines Personal Loan Market Share (%), By Employment Type, 2017-2031F
- Figure 141.Middle East & Africa Personal Loan Market, By Value, In USD Billion, 2017-2031F
- Figure 142.Middle East & Africa Personal Loan Market Share (%), By Type, 2017-2031F
- Figure 143.Middle East & Africa Personal Loan Market Share (%), By Loan Tenure, 2017-2031F
- Figure 144.Middle East & Africa Personal Loan Market Share (%), By Age, 2017-2031F
- Figure 145.Middle East & Africa Personal Loan Market Share (%), By Employment Type, 2017-2031F
- Figure 146.Middle East & Africa Personal Loan Market Share (%), By Country, 2017-2031F
- Figure 147.Saudi Arabia Personal Loan Market, By Value, In USD Billion, 2017-2031F
- Figure 148.Saudi Arabia Personal Loan Market Share (%), By Type, 2017-2031F
- Figure 149.Saudi Arabia Personal Loan Market Share (%), By Loan Tenure, 2017-2031F
- Figure 150.Saudi Arabia Personal Loan Market Share (%), By Age, 2017-2031F
- Figure 151.Saudi Arabia Personal Loan Market Share (%), By Employment Type, 2017-2031F
- Figure 152.UAE Personal Loan Market, By Value, In USD Billion, 2017-2031F
- Figure 153.UAE Personal Loan Market Share (%), By Type, 2017-2031F
- Figure 154.UAE Personal Loan Market Share (%), By Loan Tenure, 2017-2031F
- Figure 155.UAE Personal Loan Market Share (%), By Age, 2017-2031F
- Figure 156.UAE Personal Loan Market Share (%), By Employment Type, 2017-2031F
- Figure 157.South Africa Personal Loan Market, By Value, In USD Billion, 2017-2031F
- Figure 158.South Africa Personal Loan Market Share (%), By Type, 2017-2031F
- Figure 159.South Africa Personal Loan Market Share (%), By Loan Tenure, 2017-2031F
- Figure 160.South Africa Personal Loan Market Share (%), By Age, 2017-2031F
- Figure 161.South Africa Personal Loan Market Share (%), By Employment Type, 2017-2031F
- Figure 162.By Type Map-Market Size (USD Billion) & Growth Rate (%), 2023
- Figure 163.By Loan Tenure Map-Market Size (USD Billion) & Growth Rate (%), 2023
- Figure 164.By Age Map-Market Size (USD Billion) & Growth Rate (%), 2023
- Figure 165.By Employment Type Map-Market Size (USD Billion) & Growth Rate (%), 2023
- Figure 166.By Region Map-Market Size (USD Billion) & Growth Rate (%), 2023
Global personal loan market is projected to witness a CAGR of 15.65% during the forecast period 2024-2031, growing from USD 72.14 billion in 2023 to USD 230.86 billion in 2031. Global personal loan market serves as a vital pillar of the financial services industry, providing individuals with access to secured and unsecured funds for diverse personal and consumer needs.
Global personal loan market is resilient and has grown consistently over the years due to changing consumer lifestyles and constant requirements for extra financial support across the globe. Global personal loan market is highly dynamic and is flooded with numerous players like banks, NBFCs, and other financial institutions catering to customers of different backgrounds and requirements. Players in the market, ranging from traditional banks to innovative fintech startups, reflect the evolving landscape of consumer lending driven by changing preferences and technological advancements.
Global personal loan market is evolving where market players leverage technology and data analytics to streamline loan application processes, assess creditworthiness, and deliver personalized loan products tailored to individual borrower profiles. The market's expansion is supported by favorable interest rate environments in many regions, driving demand for personal credit among consumers seeking immediate financial solutions. Despite various challenges associated with credit risk and regulatory compliance, global personal loan market is poised for sustained growth, fueled by innovation, competition, urbanization, and a growing appetite for accessible credit solutions worldwide.
In the United States, Unsecured personal loan debt hit a record of USD 245 billion in the fourth quarter of 2023, with the average outstanding sum reaching an all-time high of USD 11,773, according to credit reporting agency TransUnion.
Constant Growth in Loans Distribution to Drive the Market Growth
The growth of global personal loan market is being driven by constant distribution of personal loans whether secured or unsecured. There are various factors due to which there is a constant demand for personal loans leading to rising consumer size, market expansion, and accessibility and technology-driven efficiency. Among consumers across the globe there is a growing demand for financing solutions to meet various needs, including debt consolidation, home improvements, education expenses, marriage expenses, medical bills, and major purchases, which fuel the distribution of personal loans.
As consumer lifestyles evolve and aspirations expand, the demand for accessible and flexible credit options continue to rise. Over the years, digitalization and urbanization aided by digital baking solutions have expanded market reach and accessibility, allowing lenders to serve a broader base of borrowers globally. Online lending platforms, fintech solutions, and alternative credit sources facilitate the distribution of personal loans to underserved populations, including individuals with limited credit histories or subprime credit scores. Owing to these factors and consistent market growth, new players constantly enter the space of personal loans.
In July 2023, Jenius Bank launched a new personal loans product, which was the first step towards creating a new digital bank for the United States market. As part of its initial offerings, it will provide users between USD 5,000 and USD 50,000, paid into their accounts as early as the next business day, with competitive interest rates as low as 6.99% APR.
Digitalization of Products and Services
The digital transformation of global personal loan market and its products and services is tremendous and has had a profound impact on global personal loan market, revolutionizing how loans are applied, processed, and serviced. The shift towards digital banking and online lending has been driven by technological advancements, changing consumer preferences, and the need for more efficient and convenient financial services. Digital transformation has streamlined the loan application process, allowing borrowers to apply for personal loans online from the comfort of their homes or on their mobile devices.
Online applications eliminate the need for physical paperwork and enable borrowers to submit required documentation electronically, reducing processing times, and improving efficiency. In the wake of digital transformation of global personal loan market, the accessibility to the internet and digital devices has played a key role as it has elevated the overall customer experience. Borrowers can track their loan application status, make payments, and access account information through user-friendly online portals or mobile apps. Real-time customer support and chatbots further improve accessibility and responsiveness.
In 2022, Maybank introduced Maybank Personal Digital Financing on the Maybank2u online and MAE app, providing customers with a rapid, hassle-free, and digital experience from application to disbursements within ten seconds of approval.
Future Market Scenario (2024 - 2031F)
The ongoing digital transformation will continue to drive innovation in global personal loan market. Fintech companies will play a prominent role in leveraging technology to enhance customer experiences, streamline loan processes, and offer personalized loan products tailored to individual borrower profiles. Also, innovative personal loans are expected to be encouraged in the future.
As inflation cools down globally, the bank interest rates for personal loans will dip and it will provide a much-needed push to the market as the personal loans will become more accessible for a larger consumer base.
Alternative lending platforms, including P2P lending, marketplace lending, and community-based lending initiatives, will continue to gain traction, providing accessible and inclusive financing options to underserved populations.
Key Players Landscape and Outlook
The outlook for global personal loan market is highly positive. It is expected that the market will continue to grow and expand in the coming years. Increasing consumer demand for personal loans to finance major expenses, consolidate debt, cover unexpected costs, incur personal expenses, and pursuing lifestyle upgrades is expected to fuel the market growth. Continued digital transformation and adoption of fintech solutions will enhance the accessibility and efficiency of personal loans, attracting tech-savvy borrowers.
In the coming years, financial institutions such as banks, NBFCs, fintech companies, and peer-to-peer lending platforms will incorporate more advanced technologies like AI and ML. As the major chunk of the population is in the developing regions of Asia and Africa, the markets will be exposed to digitization and urbanization, adapting and improving online banking system and will further push the market growth.
Table of Contents
1.Research Methodology
2.Project Scope & Definitions
3.Executive Summary
4.Voice of Customer
- 4.1.Demographics (Age/Cohort Analysis - Baby Boomers and Gen X, Millennials, Gen Z; Gender; Income - Low, Mid, and High; Geography; Nationality; etc.)
- 4.2.Market Awareness and Product Information
- 4.3.Brand Awareness and Loyalty
- 4.4.Factors Considered in Purchase Decision
- 4.4.1.Interest Rate
- 4.4.2.Institute Reputation
- 4.4.3.Financial Flexibility
- 4.4.4.Loan Sanction Period
- 4.5.Purpose of Purchase
- 4.6.Medium of Purchase
- 4.7.Frequency of Purchase
- 4.8.Recommendations from friends/family
- 4.9.Role of Brand Ambassador or Influencer Marketing on Product/Brand Absorption.
5.Global Personal Loan Market Outlook, 2017-2031F
- 5.1.Market Size & Forecast
- 5.1.1.By Value
- 5.2.By Type
- 5.2.1.Secured Loans
- 5.2.2.Unsecured Loans
- 5.3.By Loan Tenure
- 5.3.1.Short-term (Up to 6 months)
- 5.3.2.Medium Term (6 to 18 months)
- 5.3.3.Long-term (More than 18 months)
- 5.4.By Age
- 5.4.1.Less than 30
- 5.4.2.30 to 50
- 5.4.3.More than 50
- 5.5.By Employment Type
- 5.5.1.Business
- 5.5.2.Salaried
- 5.5.3.Others
- 5.6.By Region
- 5.6.1.North America
- 5.6.2.Europe
- 5.6.3.South America
- 5.6.4.Asia-Pacific
- 5.6.5.Middle East and Africa
- 5.7.By Company Market Share (%), 2023
6.Global Personal Loan Market Outlook, By Region, 2017-2031F
- 6.1.North America*
- 6.1.1.Market Size & Forecast
- 6.1.1.1.By Value
- 6.1.2.By Type
- 6.1.2.1.Secured Loans
- 6.1.2.2.Unsecured Loans
- 6.1.3.By Loan Tenure
- 6.1.3.1.Short-term (Up to 6 months)
- 6.1.3.2.Medium Term (6 to 18 months)
- 6.1.3.3.Long-term (More than 18 months)
- 6.1.4.By Age
- 6.1.4.1.Less than 30
- 6.1.4.2.30 to 50
- 6.1.4.3.More than 50
- 6.1.5.By Employment Type
- 6.1.5.1.Business
- 6.1.5.2.Salaried
- 6.1.5.3.Others
- 6.1.6.United States*
- 6.1.6.1.Market Size & Forecast
- 6.1.6.1.1.By Value
- 6.1.6.1.Market Size & Forecast
- 6.1.7.By Type
- 6.1.7.1.Secured Loans
- 6.1.7.2.Unsecured Loans
- 6.1.8.By Loan Tenure
- 6.1.8.1.Short-term (Up to 6 months)
- 6.1.8.2.Medium Term (6 to 18 months)
- 6.1.8.3.Long-term (More than 18 months)
- 6.1.9.By Age
- 6.1.9.1.Less than 30
- 6.1.9.2.30 to 50
- 6.1.9.3.More than 50
- 6.1.10.By Employment Type
- 6.1.10.1.Business
- 6.1.10.2.Salaried
- 6.1.10.3.Others
- 6.1.11.Canada
- 6.1.12.Mexico
- 6.1.1.Market Size & Forecast
All segments will be provided for all regions and countries covered
- 6.2.Europe
- 6.2.1.Germany
- 6.2.2.France
- 6.2.3.Italy
- 6.2.4.United Kingdom
- 6.2.5.Russia
- 6.2.6.Netherlands
- 6.2.7.Spain
- 6.2.8.Turkey
- 6.2.9.Poland
- 6.3.South America
- 6.3.1.Brazil
- 6.3.2.Argentina
- 6.4.Asia-Pacific
- 6.4.1.India
- 6.4.2.China
- 6.4.3.Japan
- 6.4.4.Australia
- 6.4.5.Vietnam
- 6.4.6.South Korea
- 6.4.7.Indonesia
- 6.4.8.Philippines
- 6.5.Middle East and Africa
- 6.5.1.UAE
- 6.5.2.Saudi Arabia
- 6.5.3.South Africa
7.Market Mapping, 2023
- 7.1.By Type
- 7.2.By Loan Tenure
- 7.3.By Age
- 7.4.By Employment Type
- 7.5.By Region
8.Macro Environment and Industry Structure
- 8.1.Supply Demand Analysis
- 8.2.Import Export Analysis
- 8.3.Value Chain Analysis
- 8.4.PESTEL Analysis
- 8.4.1.Political Factors
- 8.4.2.Economic System
- 8.4.3.Social Implications
- 8.4.4.Technological Advancements
- 8.4.5.Environmental Impacts
- 8.4.6.Legal Compliances and Regulatory Policies (Statutory Bodies Included)
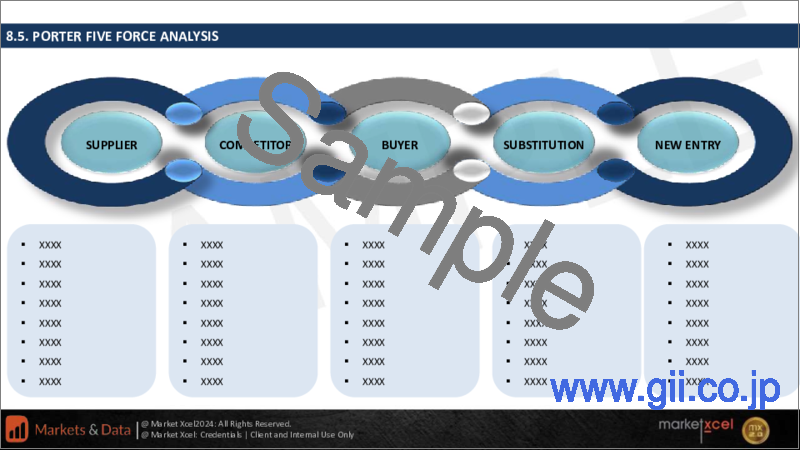
- 8.5.Porter's Five Forces Analysis
- 8.5.1.Supplier Power
- 8.5.2.Buyer Power
- 8.5.3.Substitution Threat
- 8.5.4.Threat from New Entrant
- 8.5.5.Competitive Rivalry
9.Market Dynamics
- 9.1.Growth Drivers
- 9.2.Growth Inhibitors (Challenges and Restraints)
10.Key Players Landscape
- 10.1.Competition Matrix of Top Five Market Leaders
- 10.2.Market Revenue Analysis of Top Five Market Leaders (in %, 2023)
- 10.3.Mergers and Acquisitions/Joint Ventures (If Applicable)
- 10.4.SWOT Analysis (For Five Market Players)
- 10.5.Patent Analysis (If Applicable)
11.Personal Loan Interest Analysis
12.Case Studies
13.Key Players Outlook
- 13.1.Citigroup Inc
- 13.1.1.Company Details
- 13.1.2.Key Management Personnel
- 13.1.3.Products & Services
- 13.1.4.Financials (As reported)
- 13.1.5.Key Market Focus & Geographical Presence
- 13.1.6.Recent Developments
- 13.2.American Express Company
- 13.3.U.S. Bancorp
- 13.4.Discover Financial Services
- 13.5.JPMorgan Chase & Co.
- 13.6.WELLS FINANCIAL CORP
- 13.7.Barclays PLC
- 13.8.Development Bank of Singapore Limited
- 13.9.PNC Financial Services Group, Inc.
- 13.10.ICBC Co., Ltd
Companies mentioned above DO NOT hold any order as per market share and can be changed as per information available during research work
