
|
市場調査レポート
商品コード
1445449
マカダミア:市場シェア分析、業界動向と統計、成長予測(2024:2029)Macadamia - Market Share Analysis, Industry Trends & Statistics, Growth Forecasts (2024 - 2029) |
||||||
カスタマイズ可能
適宜更新あり
|
|||||||
| マカダミア:市場シェア分析、業界動向と統計、成長予測(2024:2029) |
|
出版日: 2024年02月15日
発行: Mordor Intelligence
ページ情報: 英文 138 Pages
納期: 2~3営業日
|

全表示
- 概要
- 目次
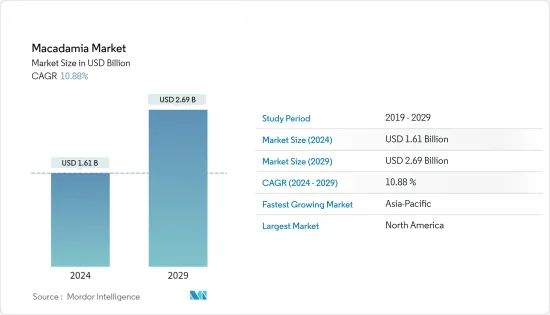
マカダミア市場規模は2024年に16億1,000万米ドルと推定され、2029年までに26億9,000万米ドルに達すると予測されており、予測期間(2024年から2029年)中に10.88%のCAGRで成長します。
主なハイライト
- 健康的な食生活の重要性と植物ベースのタンパク質食品の需要の増加により、市場は急速に成長しています。たとえば、カナダ政府によると、タンパク質需要は2025年までに9億5,350万トンに達すると予想されており、これには植物由来タンパク質の年間増加分の14%が含まれます。この依存度の増加が市場の原動力となっています。パンデミックがそれをさらに加速させました。消費者は健康的なスナックの選択肢としてナッツを選択し、毎日の食事に取り入れることが多くなり、その結果、長期にわたる市場の健全な成長がもたらされています。
- さらに、有機マカダミアは消費面でも人気が高まっており、欧州諸国からの需要が増加しています。食品・飲料、化粧品、パーソナルケア産業など、さまざまな産業分野で加工マカダミアが広く応用されていることも、世界市場でのこれらのナッツの成長を促進しています。
- さらに、南アフリカ、オーストラリア、ケニア、中国、米国のハワイは世界最大のマカダミア生産国です。オーストラリア・マカダミア協会の報告によると、ほとんどの地域で良い雨が降り、良好な気象条件が2021年の生産量を順調に伸ばしました。対照的に、開花期と初期のナッツの発育、成熟した果樹園、剪定、昆虫や病気の悪条件により、生産量は減少しました。したがって、マカダミアの使用量の増加と生産量の増加は、今後数年間の市場の成長に貢献します。
マカダミア市場の動向
政府の取り組みの増加がマカダミアの生産と貿易を支援
世界市場における商品需要の高まりと供給不足により、商品の需給状況に矛盾が生じており、業界への投資や政府機関からの拠出が切実に必要とされています。また、市場開拓の成長促進剤としても機能する可能性があります。たとえば、ハワイマカダミアナッツ協会は、栄養素の管理と葉のサンプリング、総合的な害虫管理、果樹園の床、樹冠の管理、微量栄養素の管理などを研究しました。そのようなプロジェクトの1つはマカダミアの施肥に関するもので、これには施肥に影響を与えるすべての重要な要素、マカダミアナッツの重要な土壌、栄養状態の決定、土壌分析、マカダミアナッツを実らせるための組織濃度、およびその他の要素が含まれていました。
これに加えて、2021年にはデジタルトランスフォーメーション補助金がクイーンズランド州の経済回復計画に基づくプロジェクトとしてオーストラリア・マカダミア協会を促進し、このプロジェクトに5万8,620米ドルの補助金が使用される予定です。このプロジェクトは、マカダミア産業における意思決定のための微気候モニタリングとデジタルデータを改善することを目的としています。さらに、別のプロジェクトでは、118,960ドルの助成金が気象観測所とセンサーの設置、生産者向けの新しいオンラインダッシュボードプラットフォームの作成を支援し、農家、農場労働者、連絡担当者、調査員への教育プログラムの提供に役立ちます。したがって、このプログラムはマカダミアビジネスに即座に影響を与え、急速に拡大する顧客ベースへの到達を支援します。
こうした政府の取り組みは、主要生産国における生産増加の原動力となっています。たとえば、国際ナッツ&ドライフルーツ評議会によると、2021年の南アフリカ、オーストラリア、ケニア、中国のマカダミア生産量は、それぞれ5万4,174トン、4万8,500トン、3万8,500トン、3万2,000トンでした。したがって、需要の増加により政府の支援を受けて生産が増加しており、予測期間にはさらに市場の成長が見込まれています。
オーストラリアはマカダミアナッツの最も急成長する市場になると予想されている
オーストラリアのマカダミア作物は、主に生産性向上への持続的な投資と木の実の輸出の倍増により、長年にわたり着実に成長してきました。たとえば、オーストラリアのマカダミア生産者は、最先端の研究開発に年間200万米ドルを投資しています。彼らはまた、国の世界クラスの製品を支える天然資源の保護にも熱心に取り組んでいます。これらの投資によりマカダミアの生産量が増加しています。国際ナッツ&ドライフルーツ評議会によると、2021年の同国のマカダミア生産量は4万8,500トンで、2020年の4万6,900トンから増加しました。
これに加えて、マカダミアはオーストラリア原産で、主にニューサウスウェールズ州北部とバンダバーグで栽培されています。それにもかかわらず、これらのナッツは北部の川でも生産されています。この拡大は、国内のマカダミアナッツ生産を促進したバンダバーグ北のエメラルドやバリナ南のヤンバなどの比較的新しい地域を含むすべての栽培地域で記録されました。さらに、オーストラリアン・マカダミア協会によると、オーストラリアの3つの州に700を超える栽培者がおり、年間約50,000トンを生産しています。マカダミアの収穫量の70%は40カ国以上に輸出されています。主な輸出市場は、日本、韓国、台湾、中国、欧州、北米です。
さらに、オーストラリアのマカダミアは世界中で最も人気があり、同国の生産量の75%が海外に輸出されています。マカダミアはオーストラリアの第4位の園芸輸出品です。 2020年、オーストラリアマカダミア協会は、マカダミア生産の農場ゲート価値を2億9,300万米ドル、5年間の平均生産量は約4万6,000トンと推定しました。栄養価の高い食事に対する消費者の嗜好の変化と、国際市場におけるマカダミアナッツの重要性の高まりにより、マカダミアナッツの需要が高まる可能性があります。したがって、生産者の研究開発への投資は生産を増加させ、それによって輸出市場を引き上げ、予測期間の市場の成長に貢献します。
マカダミア産業の概要
その他の特典
- エクセル形式の市場予測(ME)シート
- 3か月のアナリストサポート
目次
第1章 イントロダクション
- 調査の前提条件と市場の定義
- 調査範囲
第2章 調査手法
第3章 エグゼクティブサマリー
第4章 市場力学
- 市場概要
- 市場促進要因
- 市場抑制要因
- バリューチェーン分析
第5章 市場セグメンテーション
- 地域-生産分析(数量)、消費分析(金額と数量)、輸入分析(金額と数量)、輸出分析(金額と数量)、および価格傾向分析
- 米国
- カナダ
- グアテマラ
- ブラジル
- ドイツ
- オランダ
- 中国
- 日本
- ベトナム
- オーストラリア
- 南アフリカ
- ケニア
第6章 市場機会と将来の動向
The Macadamia Market size is estimated at USD 1.61 billion in 2024, and is expected to reach USD 2.69 billion by 2029, growing at a CAGR of 10.88% during the forecast period (2024-2029).
Key Highlights
- The market is growing faster with the importance of healthy eating habits and increased demand for plant-based protein foods. For instance, according to the Government of Canada, the protein demand is expected to reach 953.5 million metric tons by 2025, which includes a 14% of annual increase in plant-based proteins. This increase in dependency is becoming a driving factor for the market. The pandemic further boosted it. Consumers are more frequently choosing nuts as a healthy snack option and incorporating them into their daily diets resulting in healthy market growth over the long term.
- Additionally, organic macadamia is gaining popularity on the consumption side, with increasing demand coming from European countries. The wide application of processed macadamia in different industrial segments, such as the food and beverage and cosmetics and personal care industries, is also augmenting the growth of these nuts in the global market.
- Moreover, South Africa, Australia, Kenya, China, and Hawaii in the United States are the largest macadamia producers in the world. As reported by the Australian Macadamia Society, favorable weather conditions, with most regions receiving good rains, resulted in sound production in 2021. In contrast, adverse conditions during flowering and early nut development, mature orchards, pruning, and insects and diseases led to declined macadamia crops in South Africa in 2021. Therefore, the increased usage and growing production of macadamia is contributing to the market's growth in the coming years.
Macadamia Market Trends
Increase in Government Initiatives is Supporting Macadamia Production and Trade
The rising commodity demand and the supply shortage in the global market lead to discrepancies in the demand-supply commodity situation, because of which there is a dire need for investments in the industry and contributions from government organizations. It may also act as a growth catalyst for market development. For instance, the Hawaii Macadamia Nut Association researched nutrient management and leaf sampling, integrated pest management, orchard floor, canopy management, micronutrient management, and many more. One such project was on fertilizing macadamia, which included all the critical factors affecting fertilizing, important soils in macadamia nuts, determining the nutrient status, soil analysis, tissue concentration for bearing macadamia nuts, and other factors.
Along with this, in 2021, Digital Transformation Grant is a project under Queensland's Economic Recovery Plan that will facilitate the Australian Macadamias Society, which would use its USD 58,620 grant on this project. This project is to improve microclimate monitoring and digital data for decision-making in the macadamia industry. Moreover, the under another project, a grant of USD 118,960 will help with the installation of weather stations and sensors, the creation of a new online dashboard platform for growers, and provide instructional programs to farmers, farm laborers, liaison officers, and research personnel. Therefore, this program immediately impacts the macadamia business, assisting it in reaching a fast-expanding client base.
These government initiatives are a driving factor for increased production in the major producing countries. For instance, according to International Nut & Dried Fruit Council, in 2021, the production of macadamia in South Africa, Australia, Kenya, and China stood at 54,174, 48,500, 38,500, and 32,000 metric tons, respectively. Therefore, an increase in demand is giving rise to production, aided by government support, and is further expected to market growth in the forecast period.
Australia is Expected to be the Fastest-growing Market for Macadamia Nuts
The Australian macadamia crops have grown steadily over the years, mainly driven by sustained investment in productivity improvements and doubling the export of tree nuts. For instance, Australian macadamia producers invest USD 2 million annually in cutting-edge research and development. They are also dedicated to protecting the natural resources that support the country's world-class products. These investments are raising macadamia production. According to the International Nut & Dried Fruit Council, the country's macadamia production accounted for 48,500 metric tons in 2021, which increased from 46,900 metric tons in 2020.
Along with this, macadamia is native to Australia and is predominantly grown in northern New South Wales and Bundaberg. Nevertheless, these nuts are also produced in the Northern Rivers. The expansion was recorded across all growing regions, including relatively newer areas such as Emerald north of Bundaberg and Yamba south of Ballina, which fuelled the macadamia nuts production in the country. Additionally, according to the Australian Macadamia Society, more than 700 growers spread over three states in Australia and produce approximately 50,000 metric tons per year. 70% of the macadamia harvest is exported to more than 40 nations. The major export markets are Japan, Korea, Taiwan, China, Europe, and North America.
Moreover, Australian macadamia is the most sought-after worldwide, with 75% of the country's production being exported overseas. Macadamias are Australia's fourth largest horticultural export. In 2020, the Australian Macadamia Society estimated the farm gate value of macadamia production to be USD 293 million, with a five-year average production of approximately 46 thousand metric tons. The changing consumer preferences toward nutritious diets, coupled with the growing importance of macadamia nuts in the international markets, are likely to drive the demand for macadamia nuts. Therefore, the growers' investments in research and development are increasing production, thereby raising the export market and contributing to the market growth in the forecast period.
Macadamia Industry Overview
Additional Benefits:
- The market estimate (ME) sheet in Excel format
- 3 months of analyst support
TABLE OF CONTENTS
1 INTRODUCTION
- 1.1 Study Assumptions and Market Definition
- 1.2 Scope of the Study
2 RESEARCH METHODOLOGY
3 EXECUTIVE SUMMARY
4 MARKET DYNAMICS
- 4.1 Market Overview
- 4.2 Market Drivers
- 4.3 Market Restraints
- 4.4 Value Chain Analysis
5 MARKET SEGMENTATION
- 5.1 Geography - Production Analysis(Volume), Consumption Analysis (Value and Volume), Import Analysis (Value and Volume), Export Analysis (Value and Volume), and Price Trend Analysis
- 5.1.1 United States
- 5.1.2 Canada
- 5.1.3 Guatemala
- 5.1.4 Brazil
- 5.1.5 Germany
- 5.1.6 Netherlands
- 5.1.7 China
- 5.1.8 Japan
- 5.1.9 Vietnam
- 5.1.10 Australia
- 5.1.11 South Africa
- 5.1.12 Kenya

