
米国のフルサービスレストラン:市場シェア分析、産業動向、成長予測(2025~2030年)
United States Full Service Restaurants - Market Share Analysis, Industry Trends & Statistics, Growth Forecasts (2025 - 2030)- 発行日
- ページ情報
- 英文 155 Pages
- 納期
- 2~3営業日
- 商品コード
- 1693893
- カスタマイズ可能 お客様のご希望に応じて、既存データの加工や未掲載情報(例:国別セグメント)の追加などの対応が可能です。詳細はお問い合わせください。
- 適宜更新あり 本レポートは最新情報反映のため適宜更新し、内容構成変更を行う場合があります。ご検討の際はお問い合わせください。
- 翻訳ツール提供対象 PDF対応AI翻訳ツールの無料貸し出しサービスのご利用が可能です
概要
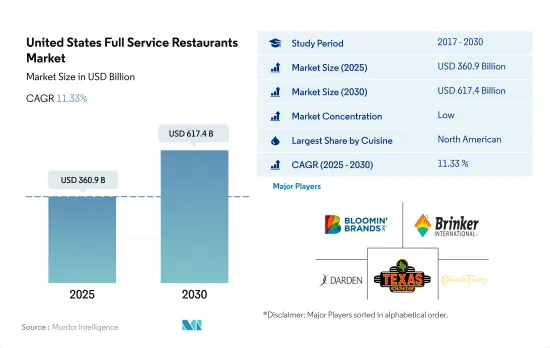
米国のフルサービスレストラン市場規模は2025年に3,609億米ドルと推定され、2030年には6,174億米ドルに達すると予測され、予測期間中(2025~2030年)のCAGRは11.33%で成長する見込みです。
観光客の大幅な増加が市場成長の原動力となっており、観光客の流入がもたらす機会を活用しています。
- 北米料理は予測期間中にCAGR 11.12%を記録すると予測されます。COVID-19後の家庭外消費の増加に伴い、米国の80%の人々が高級レストランで月に少なくとも1回はエスニック料理を好むようになっています。また、観光客の増加に伴い、アメリカ料理への欲求が急増しました。例えば、2021年には2,210万人だった海外からの観光客は、2022年には5,135万人に上ります。
- 米国ではハワイが最も多様な人口を抱え、全体の76%近くを占めます。そのため、アジア文化が大きく発展し、レストランではさまざまな汎アジア料理が提供されています。しかし、アジア系住民、特に中国人、日本人、インド人の絶え間ない移住により、彼らの文化的影響は領土の壁を越えて広がっています。2020年現在、米国には510万人の中国人が移民しています。そのため、中華料理への嗜好が高まっています。アジア料理の需要が高まるにつれ、FSRはアジア料理の品揃えを充実させるようになりました。
- 料理のタイプ別では、フルサービスレストランにおける中南米料理は予測期間中に10.92%のCAGRで推移すると予想されます。メキシコ料理は依然として消費者の間で最も人気のあるエスニック料理の動向であるため、各店舗はより本格的なメキシコ料理に力を入れています。
- 消費量では、ナチョス、サルサ、タコス、ブリトーが最も消費されているメキシコ料理です。消費量に関しては、2022年には米国の79%の人々がナチョスを消費しています。顧客の嗜好がテックスメックス料理にシフトする中、Costa Pacifica、Rio Rio Cantina、Rosario's Mexican Restaurantのようなテキサスを拠点とする高級レストランでは、様々なメキシカンフュージョン料理を提供しています。
米国のフルサービスレストラン市場動向
フルサービスレストランは米国のフードサービス店舗の約3分の1を占めます。
- 2022年の米国の外食店舗数に占めるQSRの割合は48.23%、次いでFSRが32.9%で、約32万店舗に相当します。2020年に人気のフルサービスレストランには、1,577店舗を展開するAppleビーズ(うち107店舗はカリフォルニア州)、884店舗を展開するオリーブ・ガーデン、米国で619店舗を展開するテキサス・ロードハウス、IHOP、チリーズ、レッド・ロブスターなどがあります。2020年の産業平均アメリカ顧客満足度指数は80点弱。
- 予測期間中(2023~2029年)、店舗数は前年比平均0.40%の割合で増加すると予想されます。2021年の米国のFSR数は32,027店でした。FSRで提供される最も人気のある料理には、ブリトー、サーモンロール、ツナロール、カリフォルニアロール、枝豆、メヌード、ライス、チラキレスなどがあります。
- COVID-19の影響で、政府の規制やパンデミック時の売上減少により、1,000近いFSRが閉鎖され、市場全体の売上に悪影響を及ぼしました。パンデミック以降、オンライン注文の数は増加しており、昨年はアメリカ人の60%以上が少なくとも週に1回はオンラインで食品を注文しています。オンライン注文は2014年以降、ダインインよりも300%速いペースで伸びており、レストランの総売上のおよそ40%を占めています。
北米料理と中南米料理は、フルサービスレストランで2番目と3番目に人気のある料理です。
- FSRの平均注文金額はQSRより約50.37%高いです。FSRは、顧客の興味を引くためにダインイン設備や音楽などのエンターテイメントを提供し、調理には熟練したシェフを雇う。こうした付加サービスがFSRの価格価値を高めています。FSRでは、アジア料理が最も人気があり、2022年の市場シェアの47%を占め、次いで北米料理と中南米料理が37%を占めます。
- ファミレス、カジュアルダイニング、高級レストランなど、さまざまな種類のレストランチェーンがあります。IHOPの売上高は2021年に約30億米ドルに達し、ファミリー・スタイルのレストランチェーンとしてはトップです。オリーブ・ガーデンはカジュアル・ダイニングのトップチェーンで、2021年の売上高は約41億8,000万米ドルでした。Ruth's Chris Steak Houseの売上高は2021年に約6億3,600万米ドルとなり、米国を代表する高級レストランチェーンとなりました。
- 米国で人気のある料理には、ブリトー(一皿約10米ドル)、フエボス・ランチェロス(一皿約12.5米ドル)、サーモンとツナのロール(一皿約8米ドル)、枝豆(一皿約7米ドル)などがあります。その他の人気メニューは、ライス(一皿あたり約3.5米ドル)、サラダ(一皿あたり約13米ドル)、ポケボウル(一皿あたり約13.5米ドル)。
- 平均注文額は2017~2022年にかけて16.23%増加しました。2017~2022年にかけて平均6~7%増加したインフレ率の上昇により、2022年には1レストラン当たりの注文数は1万6,000件以上に増加しました。
米国のフルサービスレストラン産業概要
米国のフルサービスレストラン市場は細分化されており、上位5社で8.69%を占めています。この市場の主要企業は、Bloomin'Brands Inc.、Brinker International Inc.、Darden Restaurants Inc.、Texas Roadhouse Inc.、The Cheesecake Factory Restaurants Inc.などです。
その他の特典
- エクセル形式の市場予測(ME)シート
- 3ヶ月のアナリストサポート
目次
第1章 エグゼクティブサマリーと主要調査結果
第2章 レポートのオファー
第3章 イントロダクション
- 調査の前提条件と市場定義
- 調査範囲
- 調査手法
第4章 主要産業動向
- アウトレット数
- 平均注文額
- 規制の枠組み
- 米国
- メニュー分析
第5章 市場セグメンテーション
- 料理
- アジア料理
- 欧州料理
- ラテンアメリカ料理
- 中東料理
- 北米料理
- その他のFSR料理
- アウトレット
- チェーン店
- 独立アウトレット
- ロケーション
- レジャー
- 宿泊施設
- 小売
- 独立型
- 旅行
第6章 競合情勢
- 主要な戦略動向
- 市場シェア分析
- 企業情勢
- 企業プロファイル
- BJ's Restaurants Inc.
- Bloomin'Brands Inc.
- Brinker International Inc.
- Cracker Barrel Old Country Store Inc.
- Darden Restaurants Inc.
- DFO LLC
- Dine Brands Global Inc.
- Red Lobster Hospitality LLC
- Texas Roadhouse Inc.
- The Cheesecake Factory Restaurants Inc.
第7章 CEOへの主要戦略的質問
第8章 付録
- 世界概要
- 概要
- ファイブフォース分析フレームワーク
- 世界のバリューチェーン分析
- 市場力学(DROs)
- 情報源と参考文献
- 図表一覧
- 主要な洞察
- データパック
- 用語集
目次
The United States Full Service Restaurants Market size is estimated at 360.9 billion USD in 2025, and is expected to reach 617.4 billion USD by 2030, growing at a CAGR of 11.33% during the forecast period (2025-2030).
A significant rise in tourist arrivals is driving the market growth, capitalizing on the opportunities presented by the influx of visitors
- North American cuisine is projected to register a CAGR of 11.12% during the forecast period. With the rise in out-of-home consumption after COVID-19, 80% of US people prefer ethnic cuisines at least once a month in fine dining restaurants. In addition, as the number of tourists grew, the desire for American food surged. For instance, in 2022, overseas visitors numbered 51.35 million compared to 22.1 million in 2021.
- In the United States, Hawaii has the most diverse population, accounting for nearly 76% of the total. Therefore, Asian culture has grown significantly, with restaurants offering a range of Pan-Asian cuisines. However, due to the constant migration of Asian populations, particularly Chinese, Japanese, and Indians, their cultural impact has spread beyond territorial barriers. As of 2020, 5.1 million Chinese immigrants were in the United States. Thus, the preference for Chinese cuisine is more popular. With the rising demand for Asian foods, FSRs used to keep a wide assortment of Asian cuisines.
- By cuisine type, Latin American cuisine in full service restaurants is expected to register a CAGR of 10.92% during the forecast period. Mexican food remains the most popular ethnic eating trend among consumers, prompting establishments to focus on more genuine Mexican meals.
- In terms of consumption, nachos, salsa, tacos, and burritos were the most consumed Mexican food. In terms of consumption, in 2022, 79% of the people in the United States consumed nachos. As customer preferences shift toward Tex-Mex delicacies, most Texas-based fine dining restaurants, like Costa Pacifica, Rio Rio Cantina, and Rosario's Mexican Restaurant, offer a range of Mexican fusion cuisines.
United States Full Service Restaurants Market Trends
Full service restaurants account for nearly one-third of foodservice outlets in the United States
- QSRs accounted for 48.23% of the total foodservice outlets in the United States in 2022, followed by FSRs with 32.9%, equivalent to around 0.32 million restaurants. Some of the popular full service restaurants in the United States in 2020 included Applebee's, with 1,577 outlets, out of which 107 stores were in California, Olive Garden, with 884 outlets, Texas Roadhouse, with 619 restaurants in the United States, IHOP, Chili's, and Red Lobster. The industry's average American Customer Satisfaction Index score for 2020 was just under 80.
- The number of outlets is expected to increase at an average rate of 0.40% Y-o-Y during the forecast period (2023-2029). There were 32,027 FSRs in the United States in 2021. Some of the most popular dishes served at FSRs are burritos, salmon rolls, tuna rolls, California rolls, edamame, menudo, rice, and chilaquiles.
- Owing to COVID-19, almost 1,000 FSRs were closed due to government regulations and reduced sales during the pandemic, negatively affecting overall market sales. The number of online orders has increased since the pandemic; in the last year, more than 60% of Americans ordered food online at least once a week. Online food ordering has grown 300% faster than dine-in since 2014, accounting for roughly 40% of total restaurant sales.
North American and Latin American cuisines are the second and third most popular cuisines at full service restaurants
- The average order value of FSRs costs around 50.37% higher than that of QSRs. FSRs provide dine-in facilities and entertainment, such as music, to attract the customer's interest, and employ skilled chefs for the preparation of food. These extra services raise the price value for FSRs. Under FSRs, Asian cuisine is the most popular cuisine, accounting for 47% of the market share in 2022, followed by North American and Latin American cuisine, with a 37% share.
- Different kinds of restaurant chains are available, such as family-style dining, casual dining, and fine dining. IHOP's sales amounted to around USD 3 billion in 2021, making it the leading family-style dining restaurant chain. Olive Garden was the leading casual dining restaurant chain, with sales amounting to around USD 4.18 billion in 2021. Ruth's Chris Steak House's sales amounted to around USD 636 million in 2021, making it the leading fine-dining restaurant chain in the United States.
- In the United States, some of the popular dishes include burritos (around USD 10 per plate), huevos rancheros (around 12.5 per plate), salmon and tuna rolls (around USD 8 per plate), and edamame (around USD 7 per plate). Other popular dishes are rice (around USD 3.5 per plate), salads (around USD 13 per plate), and poke bowls (around USD 13.5 per plate).
- The average order value increased by 16.23% from 2017 to 2022. Owing to the rising inflation rate, which increased by an average of 6-7% from 2017 to 2022, the number of orders increased to more than 16,000 in 2022 per restaurant.
United States Full Service Restaurants Industry Overview
The United States Full Service Restaurants Market is fragmented, with the top five companies occupying 8.69%. The major players in this market are Bloomin' Brands Inc., Brinker International Inc., Darden Restaurants Inc., Texas Roadhouse Inc. and The Cheesecake Factory Restaurants Inc. (sorted alphabetically).
Additional Benefits:
- The market estimate (ME) sheet in Excel format
- 3 months of analyst support
TABLE OF CONTENTS
1 EXECUTIVE SUMMARY & KEY FINDINGS
2 REPORT OFFERS
3 INTRODUCTION
- 3.1 Study Assumptions & Market Definition
- 3.2 Scope of the Study
- 3.3 Research Methodology
4 KEY INDUSTRY TRENDS
- 4.1 Number Of Outlets
- 4.2 Average Order Value
- 4.3 Regulatory Framework
- 4.3.1 United States
- 4.4 Menu Analysis
5 MARKET SEGMENTATION (includes market size in Value in USD, Forecasts up to 2030 and analysis of growth prospects)
- 5.1 Cuisine
- 5.1.1 Asian
- 5.1.2 European
- 5.1.3 Latin American
- 5.1.4 Middle Eastern
- 5.1.5 North American
- 5.1.6 Other FSR Cuisines
- 5.2 Outlet
- 5.2.1 Chained Outlets
- 5.2.2 Independent Outlets
- 5.3 Location
- 5.3.1 Leisure
- 5.3.2 Lodging
- 5.3.3 Retail
- 5.3.4 Standalone
- 5.3.5 Travel
6 COMPETITIVE LANDSCAPE
- 6.1 Key Strategic Moves
- 6.2 Market Share Analysis
- 6.3 Company Landscape
- 6.4 Company Profiles (includes Global Level Overview, Market Level Overview, Core Business Segments, Financials, Headcount, Key Information, Market Rank, Market Share, Products and Services, and Analysis of Recent Developments).
- 6.4.1 BJ's Restaurants Inc.
- 6.4.2 Bloomin' Brands Inc.
- 6.4.3 Brinker International Inc.
- 6.4.4 Cracker Barrel Old Country Store Inc.
- 6.4.5 Darden Restaurants Inc.
- 6.4.6 DFO LLC
- 6.4.7 Dine Brands Global Inc.
- 6.4.8 Red Lobster Hospitality LLC
- 6.4.9 Texas Roadhouse Inc.
- 6.4.10 The Cheesecake Factory Restaurants Inc.
7 KEY STRATEGIC QUESTIONS FOR FOODSERVICE CEOS
8 APPENDIX
- 8.1 Global Overview
- 8.1.1 Overview
- 8.1.2 Porter's Five Forces Framework
- 8.1.3 Global Value Chain Analysis
- 8.1.4 Market Dynamics (DROs)
- 8.2 Sources & References
- 8.3 List of Tables & Figures
- 8.4 Primary Insights
- 8.5 Data Pack
- 8.6 Glossary of Terms
- 発行日
- 発行
- Mordor Intelligence
- ページ情報
- 英文 155 Pages
- 納期
- 2~3営業日