
|
市場調査レポート
商品コード
1693773
インドの生物防除剤:市場シェア分析、産業動向と統計、成長予測(2025年~2030年)India Biocontrol Agents - Market Share Analysis, Industry Trends & Statistics, Growth Forecasts (2025 - 2030) |
||||||
カスタマイズ可能
適宜更新あり
|
|||||||
| インドの生物防除剤:市場シェア分析、産業動向と統計、成長予測(2025年~2030年) |
|
出版日: 2025年03月18日
発行: Mordor Intelligence
ページ情報: 英文 142 Pages
納期: 2~3営業日
|

全表示
- 概要
- 目次
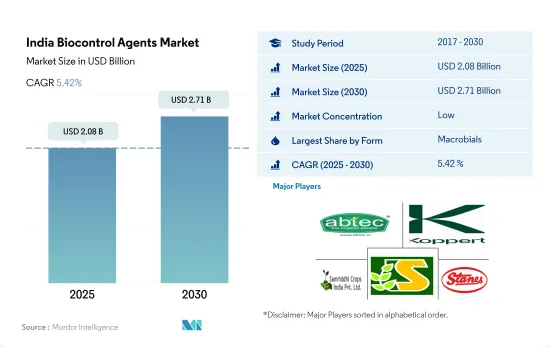
インドの生物防除剤市場規模は2025年に20億8,000万米ドルと推定・予測され、2030年には27億1,000万米ドルに達し、予測期間(2025~2030年)のCAGRは5.42%で成長すると予測されています。
- 細菌や真菌の生物防除剤などの微生物生物防除剤は、病害虫を管理するために農業で広く使用されています。これらの微生物は、商業利用のためにラボで簡単に複製でき、便利な適用プロセスを提供することができるため、インドの生物防除剤市場における潜在的な成長に寄与しています。しかし、2022年の微生物生物防除剤の市場シェアは1.0%以下でした。
- Beauvaria bassianaやTrichoderma virideなどの真菌生物防除剤は、害虫や病害を駆除するために農業で広く使用されています。B. bassianaは様々な害虫と効果的に闘うことが示されており、一方T. virideは有害な真菌を不活性化することにより、様々な植物病害を中和することが知られています。研究によると、B. bassianaを散布すると、有害昆虫の死亡率が大幅に増加し、その子孫数が減少することが明らかになっています。これらの真菌は、最も商業的に利用されている真菌生物防除剤のひとつです。
- プレデターはインドで最も利用されている大腸菌生物防除剤であり、市場シェアも最大です。これは、入手が容易で繁殖能力が早いことに起因しています。このセグメントは、2023~2029年の間に5.6%という高いCAGRで推移すると予測されています。
- 生物防除剤のもう1つのタイプである寄生生物は、農業で一般的に使用されており、2022年には微生物生物防除剤市場の2.6%を占めました。寄生生物は害虫の幼虫や蛹を食べて害虫を駆除するため、農業従事者は害虫の問題に初期段階で対処できます。
- マクロ微生物生物防除剤は、環境や植物に害を与えることなく対象となる害虫を駆除するもので、農業における使用量は2023~2029年にかけて増加すると予想されています。
インドの生物防除剤市場動向
有機生産者の増加により、主に連作作物で有機栽培面積が増加
- インドは、認定有機生産者の総数では世界最大の国であり、2019年には130万人の有機生産者がいます。多くの有機生産者がいるにもかかわらず、同国の有機栽培面積は全農業面積の2.0%程度です。2021年には、同国の有機栽培面積は71万1,094ヘクタールと記録され、2017年と比較して約3.4%増加しました。国内の有機農業は一部の州に集中しています。国内の有機農業上位10州が有機作物総面積の約80.0%を占めています。マディヤ・プラデシュ州、ラジャスタン州、マハラシュトラ州のように、有機農業の普及率向上でリードしている州は少数です。マディヤ・プラデシュ州だけで2019年のインドの有機栽培面積の約27.0%を占めています。
- 同国では連作作物の有機栽培が優勢で、2021年には有機作物総栽培面積の約59.7%を占めました。穀物生産は米、小麦、雑穀、トウモロコシが主です。ほとんどの穀類作物はカリフ期(6月~9月)に栽培されます。この時期に栽培される作物は、主に雨に左右されるか、稲、トウモロコシ、綿花、大豆のように多くの水を必要とします。
- 有機換金作物全体の栽培面積は、2017年の27万ヘクタールから2021年には28万ヘクタールに増加します。同国で生産される主要換金作物は、綿花、サトウキビ、紅茶、スパイスです。同国では現在、有機園芸作物の成長は限られています。有機製品に対する需要の高まりとインド政府の有機栽培への取り組みにより、2023~2029年にかけて有機作物の栽培面積が増加すると予想されます。
需要の高まりとeコマースチャネルによる入手の容易さにより、有機食品への1人当たり支出が増加
- インドのオーガニック製品に対する1人当たり支出は0.23米ドルと、アジア太平洋のオーガニック製品に対する1人当たり支出の平均と比べると比較的低いです。しかし近年は、オーガニック製品は免疫力が高く、品質が高く、eコマースチャネルを通じて入手しやすいと認識する顧客が増えたため、消費者の需要がオーガニック製品へとシフトしています。インドは有機食品と飲食品の有望な市場です。インド国内の有機飲食品産業は、2019~2024年にかけてCAGR13%で上昇し、2024年までに1億3,800万米ドルの規模になると予想されています。
- 2022年に国内で消費された有機飲食品の合計は1億800万米ドル相当でした。同国における有機製品の消費額は、2016年の4,500万米ドルから2021年には9,600万米ドルに増加しました。オーガニック食品の販売動向は、主に消費者意識の高まりにより増加傾向にあり、高所得の消費者がオーガニック飲食品の消費を促進しています。最も需要を獲得したカテゴリーには、有機卵、乳製品、果物・野菜などの必須食品が含まれます。
- 有機飲料消費が市場を独占し、2022年の有機食品と有機飲料の合計市場金額の約85.2%を占めました。有機飲料セグメントには、承認された認証機関によって認証された有機包装飲食品が含まれます。有機飲料の消費額は2020~2022年にかけてCAGR 14%で増加しました。有機製品に関連する価格プレミアムは、低所得層の消費者のアクセスを妨げ、有機食品消費の主要制限要因となっています。しかし、有機製品の積極的な販売促進と利点が、予測期間中の有機食品市場を牽引します。
インドの生物防除剤産業の概要
インドの生物防除剤市場はセグメント化されており、上位5社で0.56%を占めています。この市場の主要企業は、Agro Bio-Tech Research Centre Ltd、Koppert Biological Systems Inc.、Samriddhi Crops India Pvt. Ltd、Sonkul Agro Industries、T.Stanes、Company Limitedなどです。
その他の特典
- エクセル形式の市場予測(ME)シート
- 3ヶ月のアナリストサポート
目次
第1章 エグゼクティブサマリーと主要調査結果
第2章 レポートのオファー
第3章 イントロダクション
- 調査の前提条件と市場定義
- 調査範囲
- 調査手法
第4章 主要産業動向
- 有機栽培面積
- 一人当たりのオーガニック製品への支出
- 規制の枠組み
- インド
- バリューチェーンと流通チャネル分析
第5章 市場セグメンテーション
- 形態
- マクロ微生物
- 生物別
- 昆虫病原性線虫
- 寄生虫
- 捕食者
- 微生物
- 生物別
- 細菌性生物防除剤
- 真菌生物防除剤
- その他の微生物
- マクロ微生物
- 作物タイプ
- 換金作物
- 園芸作物
- 耕作作物
第6章 競争情勢
- 主要な戦略的動き
- 市場シェア分析
- 企業情勢
- 企業プロファイル
- Agro Bio-Tech Research Centre Ltd
- Andermatt Group AG
- KN Bio Sciences India Pvt. Ltd
- Koppert Biological Systems Inc.
- Manidharma BIoTech Private Limited
- RAJSHREE BIOSOLUTIONS
- Samriddhi Crops India Pvt. Ltd
- Sonkul Agro Industries
- T.Stanes and Company Limited
第7章 CEOへの主要戦略的質問
第8章 付録
- 世界概要
- 概要
- ファイブフォース分析フレームワーク
- 世界のバリューチェーン分析
- 市場力学(DROs)
- 情報源と参考文献
- 図表一覧
- 主要な洞察
- データパック
- 用語集
The India Biocontrol Agents Market size is estimated at 2.08 billion USD in 2025, and is expected to reach 2.71 billion USD by 2030, growing at a CAGR of 5.42% during the forecast period (2025-2030).
- Microbial biocontrol agents, such as bacterial and fungal biocontrol agents, are widely used in agriculture to manage pests and diseases. These microorganisms can be easily reproduced in laboratories for commercial use and offer a convenient application process, which contributes to their potential growth in the Indian biocontrol agents market. However, the market share of microbial biocontrol agents was less than 1.0% in 2022.
- Fungal biocontrol agents, such as Beauvaria bassiana and Trichoderma viride, are widely used in agriculture for controlling pests and diseases. B. bassiana has been shown to effectively combat a range of pests, while T. viride is known to neutralize various plant diseases by rendering the harmful fungi inactive. Studies have revealed that the application of B. bassiana results in a significant increase in the mortality of harmful insects and a decrease in their progeny count. These fungi are among the most commercially utilized fungal biocontrol agents available.
- Predators are the most used macrobial biocontrol agents in India and have the largest market share. This can be attributed to their ease of availability and faster reproductive capacity. The segment is projected to record a higher CAGR of 5.6% between 2023 and 2029.
- Parasitoids, another type of biocontrol agents, are commonly used in agriculture and accounted for 2.6% of the microbial biocontrol agents market in 2022. They control pests by feeding on their larvae or pupae, allowing farmers to address pest problems in the early stages.
- Macrobial biocontrol agents control the target pests with no harm to the environment and plants, and their usage in agriculture is expected to grow between 2023 and 2029.
India Biocontrol Agents Market Trends
Growing number of organic producers helping the increase in area under organic cultivation, primarily in row crops
- India is the largest country, in terms of the total number of certified organic producers in the world, with 1.3 million organic producers in 2019. Despite having a large number of organic producers, organic cultivation areas in the country account for around 2.0% of the total agriculture area in the country. In 2021, the organic area in the country was recorded as 711,094.0 hectares, which increased by about 3.4% compared to 2017. Organic farming in the country is concentrated in only a few states. The top ten organic farming states in the country account for about 80.0% of the total organic crop area. A few states have taken the lead in improving organic farming coverage, like Madhya Pradesh, Rajasthan, and Maharashtra, which are the top three organic farming states in the country. Madhya Pradesh alone accounted for about 27.0% of India's total organic cultivation area in 2019.
- Organic cultivation of row crops is dominant in the country, which accounted for about 59.7% of the total organic crop area in 2021. Cereal crop production is dominant rice, wheat, millet, and maize are the major cereals produced. Most cereal crops are grown in the kharif season (June - September). The crops grown in this season are mainly rain dependent or require more water, like rice, maize, cotton, and soybean.
- The overall organic cash crop cultivation area increased from 0.27 million hectares in 2017 to 0.28 million hectares in 2021. The major cash crops produced in the country are cotton, sugarcane, tea, and spices. There is a limited growth of organic horticultural crops currently in the country. The increasing demand for organic products and Indian government initiatives to go organic are anticipated to increase organic crop area between 2023 and 2029.
Growing demand and their easy accessibility through e-commerce channels, rising the per capita spending on organic food
- India's per capita spending on organic products is relatively low at USD 0.23 compared to the average per capita spending on organic products in Asia-Pacific. However, in recent years, shifting consumer demand has increased toward organic products as more customers perceive these items offer better immunity, higher quality, and more accessibility through e-commerce channels. India is a promising and developing market for organic foods and beverages. India's domestic organic food and beverage industry is expected to be worth USD 138.0 million by 2024, rising at a compound annual growth rate of 13% between 2019 to 2024.
- In 2022, the total combined organic food and beverages worth USD 108.0 million consumed in the country. The consumption value of organic products in the country increased from USD 45 million in 2016 to USD 96.0 million in 2021. Organic food sales have seen an increasing trend mainly due to increasing consumer awareness, and high-income consumers are propelling organic food and beverage consumption. Categories that gained the most demand included essential foods, such as organic eggs, dairy, and fruits and vegetables.
- Organic beverage consumption dominated the market and accounted for about 85.2% of the total combined organic food and beverages market value in 2022. The organic beverages segment includes organic packaged food and beverages that are certified by the approved certification body. Organic beverage consumption value increased at a CAGR of 14% between 2020 to 2022. The price premium associated with organic products hampers lower-income consumer access and is the major limiting factor for organic food consumption. However, organic products' active promotion and advantages drive the organic food market during the forecast period.
India Biocontrol Agents Industry Overview
The India Biocontrol Agents Market is fragmented, with the top five companies occupying 0.56%. The major players in this market are Agro Bio-Tech Research Centre Ltd, Koppert Biological Systems Inc., Samriddhi Crops India Pvt. Ltd, Sonkul Agro Industries and T.Stanes and Company Limited (sorted alphabetically).
Additional Benefits:
- The market estimate (ME) sheet in Excel format
- 3 months of analyst support
TABLE OF CONTENTS
1 EXECUTIVE SUMMARY & KEY FINDINGS
2 REPORT OFFERS
3 INTRODUCTION
- 3.1 Study Assumptions & Market Definition
- 3.2 Scope of the Study
- 3.3 Research Methodology
4 KEY INDUSTRY TRENDS
- 4.1 Area Under Organic Cultivation
- 4.2 Per Capita Spending On Organic Products
- 4.3 Regulatory Framework
- 4.3.1 India
- 4.4 Value Chain & Distribution Channel Analysis
5 MARKET SEGMENTATION (includes market size in Value in USD and Volume, Forecasts up to 2030 and analysis of growth prospects)
- 5.1 Form
- 5.1.1 Macrobials
- 5.1.1.1 By Organism
- 5.1.1.1.1 Entamopathogenic Nematodes
- 5.1.1.1.2 Parasitoids
- 5.1.1.1.3 Predators
- 5.1.2 Microbials
- 5.1.2.1 By Organism
- 5.1.2.1.1 Bacterial Biocontrol Agents
- 5.1.2.1.2 Fungal Biocontrol Agents
- 5.1.2.1.3 Other Microbials
- 5.1.1 Macrobials
- 5.2 Crop Type
- 5.2.1 Cash Crops
- 5.2.2 Horticultural Crops
- 5.2.3 Row Crops
6 COMPETITIVE LANDSCAPE
- 6.1 Key Strategic Moves
- 6.2 Market Share Analysis
- 6.3 Company Landscape
- 6.4 Company Profiles (includes Global Level Overview, Market Level Overview, Core Business Segments, Financials, Headcount, Key Information, Market Rank, Market Share, Products and Services, and Analysis of Recent Developments).
- 6.4.1 Agro Bio-Tech Research Centre Ltd
- 6.4.2 Andermatt Group AG
- 6.4.3 KN Bio Sciences India Pvt. Ltd
- 6.4.4 Koppert Biological Systems Inc.
- 6.4.5 Manidharma Biotech Private Limited
- 6.4.6 RAJSHREE BIOSOLUTIONS
- 6.4.7 Samriddhi Crops India Pvt. Ltd
- 6.4.8 Sonkul Agro Industries
- 6.4.9 T.Stanes and Company Limited
7 KEY STRATEGIC QUESTIONS FOR AGRICULTURAL BIOLOGICALS CEOS
8 APPENDIX
- 8.1 Global Overview
- 8.1.1 Overview
- 8.1.2 Porter's Five Forces Framework
- 8.1.3 Global Value Chain Analysis
- 8.1.4 Market Dynamics (DROs)
- 8.2 Sources & References
- 8.3 List of Tables & Figures
- 8.4 Primary Insights
- 8.5 Data Pack
- 8.6 Glossary of Terms
