
|
市場調査レポート
商品コード
1686196
パイオコントロール製剤:市場シェア分析、産業動向・統計、成長予測(2025年~2030年)Biocontrol Agents - Market Share Analysis, Industry Trends & Statistics, Growth Forecasts (2025 - 2030) |
||||||
カスタマイズ可能
適宜更新あり
|
|||||||
| パイオコントロール製剤:市場シェア分析、産業動向・統計、成長予測(2025年~2030年) |
|
出版日: 2025年03月18日
発行: Mordor Intelligence
ページ情報: 英文 310 Pages
納期: 2~3営業日
|

全表示
- 概要
- 目次
概要
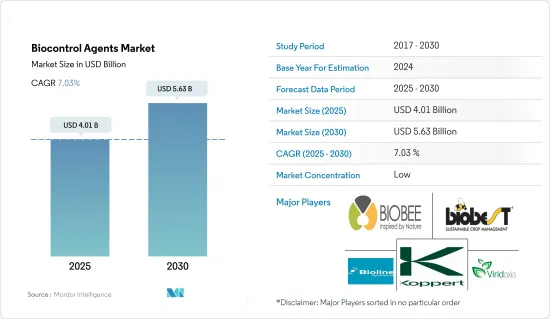
パイオコントロール製剤の市場規模は2025年に40億1,000万米ドルと予測され、2030年には56億3,000万米ドルに達し、予測期間中(2025-2030年)のCAGRは7.03%で成長すると予測されます。
- パイオコントロール製剤産業は急成長している産業であり、世界の農業慣行に大きな影響を与えようとしています。2022年の市場規模は31億8,000万米ドルで、広範囲の害虫を駆除できることから、マクロパイオコントロール製剤が業界を支配しています。捕食パイオコントロール製剤は、マクロパイオコントロール製剤の市場価値の91%を占め、その主な原因は、異なるライフステージにわたる複数の害虫を攻撃する能力にあります。
- 微生物パイオコントロール製剤は市場で牽引力を増しています。2022年の市場規模は7,290万米ドルでした。微生物パイオコントロール製剤は、広範囲の病気や害虫を駆除するのに非常に効果的です。
- 特に真菌のパイオコントロール製剤は人気が高く、2022年の世界の微生物パイオコントロール製剤市場の53.8%を占めています。特にトリコデルマは商業的に入手可能なパイオコントロール製剤であり、根腐れ病、フザリウム萎凋病、苗立枯病を防除するために主要作物で広く使用されています。
- パイオコントロール製剤の使用は、化学農薬の必要性を減らすことができるため、栽培コスト全体の削減に直結する可能性があります。マクロ生物および微生物パイオコントロール製剤の優位性と、総合的害虫管理手法の広範な採用により、政府は農家やアドバイザーを支援するための総合的害虫管理ツールを推進しています。これらの要因が、2023年から2029年にかけてパイオコントロール製剤市場を牽引すると予想されます。
- アジア太平洋地域は世界のパイオコントロール製剤市場を独占しており、2022年には67.8%という大きなシェアを占めています。この地域では、インドが最大のパイオコントロール製剤市場で、2022年のシェアは51.0%です。微生物パイオコントロール製剤の市場は特に強く、2022年には市場の60.1%を占める。これは、微生物剤が商業的な実験室で増殖しやすく、マクロ生物剤よりも適用が容易であることによる。しかし、捕食者は容易に入手でき、繁殖能力が早いため、マクロパイオコントロール製剤として最も一般的に使用されています。この分野は予測期間中に大きく成長すると予測され、2023~2029年の推定CAGRは8.4%です。
- 欧州では、パイオコントロール製剤の市場が大きく、2022年には世界市場シェアの14.3%を占める。この地域ではイタリアが最大の市場であり、金額で39.0%、数量で28.7%のシェアを占めています。欧州の市場は2023年から2029年にかけて成長し、CAGRは7.6%と予測されます。この成長は、園芸作物の栽培増加と、これらの作物を加害する新たな害虫の発見によるものと予想されます。
- 欧州は、2030年までに有機農業の総農地面積を少なくとも25%に増やすという目標を掲げています。有機製品に対する需要の増加と、有機農業を促進するための政府・非政府の取り組みが、2023年から2029年にかけて市場と市場価値を牽引すると予想されます。パイオコントロール製剤市場は、有機製品に対する需要の増加や生物防除技術の進歩などの要因によって、アジア太平洋と欧州の両方で大きな成長を遂げると予測されます。
世界のパイオコントロール製剤市場動向
北米と欧州では、意識の高まりと政府の取り組みにより、有機生産が史上最高水準にあります。
- 有機農業は持続可能な食糧システムに大きく貢献するものとして台頭し、世界187カ国で実践されています。2021年現在、世界の有機農地は7,230万haで、2018年から2021年にかけて全地域で平均2.9%増加しています。有機耕地は1,440万haで、有機農地全体の19.9%を占めています。
- 有機農業の最も強力な市場は北米と欧州で、世界の有機耕地の41.0%を占めています。2022年には、欧州には650万haの有機耕地があり、これは有機耕地全体の44.1%に相当します。北米と欧州で有機栽培されている最も重要な作物は、リンゴ、イチゴ、穀物、オリーブです。
- アジア太平洋の新興諸国も有機農業運動に参加し、国内需要を満たす新鮮な有機農産物の生産と供給で自給自足しつつあります。有機農業の動向はアジア太平洋で勢いを増しており、同地域では2017年から2022年にかけて有機耕地面積が18.8%増加します。この地域の政府による主要な取り組みも、有機農業の拡大傾向に重要な役割を果たしています。例えば、日本の食料・農業・農村基本計画は、2030年までに有機農家と有機農地の数を3倍に増やすことを目標としています。
- 有機農業の成長の原動力となっているのは、土壌の健康を促進し、環境への影響を低減し、より健康的な食品を生産するといった、有機農業の利点に対する意識の高まりです。
有機食品の1人当たり支出は主に米国とドイツで観察されるが、これはより健康的で持続可能な食品に対する消費者の需要に起因します。
- オーガニック食品市場は過去数年間に著しい成長を遂げ、世界の売上高は2012年の708億米ドルから2020年には1,206億米ドルに達します。有機食品への動向は、より健康的で持続可能な食品の選択肢を求める消費者需要の高まりや、従来型農業が環境に与える影響に対する意識の高まりなど、いくつかの要因に後押しされています。世界の有機食品市場は、今後数年間も成長傾向が続くと予想されます。
- オーガニック・トレード協会が2021年に実施した調査によると、同年のオーガニック果物・野菜の売上高は約4.5%増加し、オーガニック売上高全体の15%を占めました。オーガニック製品への平均支出額では北米が市場を独占しており、米国の1人当たり支出額は2021年に186.7米ドルに達し、北米諸国の中で最も高いです。欧州も有機食品市場で大きな成長が見込まれており、2021年の1人当たり支出額が最も高いのはドイツで75.6米ドルです。
- 有機食品市場は、消費者の可処分所得の高い先進諸国が依然として支配的であるが、新興諸国でも成長が見込まれます。例えば、アジア太平洋地域では労働者階級が増加しており、有機食品を入手しやすく手頃な価格で購入できるようになっているため、市場の拡大に寄与する可能性があります。
パイオコントロール製剤産業の概要
パイオコントロール製剤市場は細分化されており、上位5社で8.87%を占めています。この市場の主要企業は以下の通りです。 Biobee Ltd, Biobest Group NV, Bioline AgroSciences Ltd, Koppert Biological Systems Inc. and VIRIDAXIS SA(sorted alphabetically).
その他の特典
- エクセル形式の市場予測(ME)シート
- 3ヶ月のアナリストサポート
目次
第1章 エグゼクティブサマリーと主な調査結果
第2章 レポートのオファー
第3章 イントロダクション
- 調査の前提条件と市場定義
- 調査範囲
- 調査手法
第4章 主要産業動向
- 有機栽培面積
- 一人当たりのオーガニック製品への支出
- 規制の枠組み
- オーストラリア
- ブラジル
- カナダ
- 中国
- フランス
- ドイツ
- インド
- インドネシア
- イタリア
- 日本
- メキシコ
- オランダ
- フィリピン
- ロシア
- スペイン
- タイ
- トルコ
- 英国
- 米国
- ベトナム
- バリューチェーンと流通チャネル分析
第5章 市場セグメンテーション
- 形態
- マクロ生物
- 生物別
- 昆虫病原性線虫
- 寄生虫
- 捕食者
- 微生物
- 生物別
- 細菌性パイオコントロール製剤
- 真菌パイオコントロール製剤
- その他の微生物
- マクロ生物
- 作物タイプ
- 換金作物
- 園芸作物
- 畑作物
- 地域
- アフリカ
- 国別
- エジプト
- ナイジェリア
- 南アフリカ
- その他のアフリカ
- アジア太平洋
- 国別
- オーストラリア
- 中国
- インド
- インドネシア
- 日本
- フィリピン
- タイ
- ベトナム
- その他アジア太平洋地域
- 欧州
- 国別
- フランス
- ドイツ
- イタリア
- オランダ
- ロシア
- スペイン
- トルコ
- 英国
- その他欧州
- 中東
- 国別
- イラン
- サウジアラビア
- その他中東
- 北米
- 国別
- カナダ
- メキシコ
- 米国
- その他北米地域
- 南米
- 国別
- アルゼンチン
- ブラジル
- その他南米
- アフリカ
第6章 競合情勢
- 主要な戦略動向
- 市場シェア分析
- 企業情勢
- 企業プロファイル.
- Andermatt Group AG
- Beneficial Insectary Inc.
- Biobee Ltd
- Biobest Group NV
- Bioline AgroSciences Ltd
- Bioworks Inc.
- Henan Jiyuan Baiyun Industry Co. Ltd
- Koppert Biological Systems Inc.
- T Stanes and Company Limited
- VIRIDAXIS SA
第7章 CEOへの主な戦略的質問
第8章 付録
- 世界概要
- 概要
- ファイブフォース分析フレームワーク
- 世界のバリューチェーン分析
- 市場力学(DROs)
- 情報源と参考文献
- 図表一覧
- 主要洞察
- データパック
- 用語集
目次
Product Code: 50344
The Biocontrol Agents Market size is estimated at 4.01 billion USD in 2025, and is expected to reach 5.63 billion USD by 2030, growing at a CAGR of 7.03% during the forecast period (2025-2030).
- The biocontrol agents industry is a rapidly growing industry that is poised to have a significant impact on global agricultural practices. In 2022, the market was valued at USD 3.18 billion, with macrobial biocontrol agents dominating the industry due to their ability to control a wide range of pests. Predators accounted for 91% of the market value of macrobial biocontrol products, mostly attributed to their capacity to attack multiple pests across different life stages.
- Microbial biocontrol agents are gaining traction in the market. They were valued at USD 72.9 million in 2022. Microbial biocontrol agents are highly effective in controlling a wide range of diseases and pests.
- Fungal biocontrol agents, in particular, are highly sought after, accounting for 53.8% of the value of the global microbial biocontrol agents market in 2022. Trichoderma, in particular, is a commercially available biocontrol agent that is widely used in major crops to control root rotting, fusarium wilting, and seedling diseases.
- The use of biocontrol agents can reduce the need for chemical pesticides, which could directly reduce the overall cost of cultivation. The dominance of macrobial and microbial biocontrol agents and the widespread adoption of integrated pest management practices have led governments to promote integrated pest management tools to assist farmers and advisors. These factors are expected to drive the biocontrol agents market between 2023 and 2029.
- The Asia-Pacific region dominates the global biocontrol agents market, accounting for a significant 67.8% share in 2022. In this region, India is the largest market for biocontrol agents, with a share of 51.0% in 2022. The market for microbial biocontrol agents is particularly strong, accounting for 60.1% of the market in 2022. This is due to the fact that microbial agents are easy to multiply in commercial laboratories and are easier to apply than macrobial agents. However, predators are the most commonly used macrobial biocontrol agents, as they are readily available and have a faster reproductive capacity. This segment is projected to experience significant growth during the forecast period, with an estimated CAGR of 8.4% between 2023 and 2029.
- In Europe, the market for biocontrol agents is significant, accounting for 14.3% of the global market share in 2022. Italy is the largest market in the region, with a share of 39.0% by value and 28.7% by volume. The market in Europe is expected to grow between 2023 and 2029, with a projected CAGR of 7.6%. This growth is expected to be the result of the increasing cultivation of horticultural crops and the discovery of new pests that attack these crops.
- Europe has set a target to increase the total farmland under organic farming to at least 25% by 2030. The increasing demand for organic products and government and non-government initiatives to promote organic farming are expected to drive the market and market value between 2023 and 2029. The biocontrol agents market is projected to experience significant growth in both Asia-Pacific and Europe, driven by factors such as the increasing demand for organic products and advancements in biocontrol technologies.
Global Biocontrol Agents Market Trends
Organic production is at an all-time high in North America and Europe, due to the increasing awareness and Government initiatives.
- Organic agriculture has emerged as a significant contributor to sustainable food systems, with 187 countries practicing it globally. As of 2021, there was 72.3 million ha of organic agricultural land worldwide, with an average increase of 2.9% across all regions from 2018 to 2021. Organic arable land accounted for 14.4 million ha, representing 19.9% of the total organic agricultural land.
- The strongest markets for organic farming are North America and Europe, accounting for 41.0% of the global organic arable land. In 2022, Europe had 6.5 million ha of organic arable land, equivalent to 44.1% of the overall organic arable agricultural area. The most significant crops grown organically in North America and Europe are apples, strawberries, cereals, and olives.
- Developing countries in Asia-Pacific are also joining the organic agriculture movement and becoming self-sufficient in producing and providing fresh organic produce to meet their domestic demand. The trend of organic farming is gaining momentum in Asia-Pacific, with the region recording an 18.8% increase in organic arable land from 2017 to 2022. The major initiatives by governments in the region also play a vital role in the growing trend of organic farming. For example, Japan's Basic Plan for Food, Agriculture, and Rural Areas aims to triple the number of organic farmers and lands by 2030.
- The growth of organic agriculture is driven by the rising awareness of the benefits of organic farming, such as promoting soil health, reducing environmental impacts, and producing healthier food.
Per capita spending of organic food majorly observed in United States and Germany, attributed to the consumer demand for healthier and sustainable food
- The organic food market experienced significant growth in the past few years, with global sales reaching USD 120.6 billion in 2020, up from USD 70.8 billion in 2012. The trend toward organic food is being driven by several factors, such as increasing consumer demand for healthier, more sustainable food options and a growing awareness of the environmental impact of conventional agriculture. The global organic food market is expected to continue its growth trend over the coming years.
- According to a survey conducted by the Organic Trade Association in 2021, sales of organic fruits and vegetables increased by around 4.5% in the same year, accounting for 15% of the overall organic sales. North America dominates the market in terms of average spending on organic products, with per capita spending in the United States reaching USD 186.7 in 2021, the highest among all North American countries. Europe is also expected to experience significant growth in the organic food market, with Germany accounting for the highest per capita spending of USD 75.6 in 2021.
- While the organic food market is still dominated by developed countries with high consumer disposable incomes, it is also expected to grow in developing nations. For example, the increasing number of working-class people in the Asia-Pacific region may contribute to the market's expansion due to the growing availability and affordability of organic food products.
Biocontrol Agents Industry Overview
The Biocontrol Agents Market is fragmented, with the top five companies occupying 8.87%. The major players in this market are Biobee Ltd, Biobest Group NV, Bioline AgroSciences Ltd, Koppert Biological Systems Inc. and VIRIDAXIS SA (sorted alphabetically).
Additional Benefits:
- The market estimate (ME) sheet in Excel format
- 3 months of analyst support
TABLE OF CONTENTS
1 EXECUTIVE SUMMARY & KEY FINDINGS
2 REPORT OFFERS
3 INTRODUCTION
- 3.1 Study Assumptions & Market Definition
- 3.2 Scope of the Study
- 3.3 Research Methodology
4 KEY INDUSTRY TRENDS
- 4.1 Area Under Organic Cultivation
- 4.2 Per Capita Spending On Organic Products
- 4.3 Regulatory Framework
- 4.3.1 Australia
- 4.3.2 Brazil
- 4.3.3 Canada
- 4.3.4 China
- 4.3.5 France
- 4.3.6 Germany
- 4.3.7 India
- 4.3.8 Indonesia
- 4.3.9 Italy
- 4.3.10 Japan
- 4.3.11 Mexico
- 4.3.12 Netherlands
- 4.3.13 Philippines
- 4.3.14 Russia
- 4.3.15 Spain
- 4.3.16 Thailand
- 4.3.17 Turkey
- 4.3.18 United Kingdom
- 4.3.19 United States
- 4.3.20 Vietnam
- 4.4 Value Chain & Distribution Channel Analysis
5 MARKET SEGMENTATION (includes market size in Value in USD and Volume, Forecasts up to 2030 and analysis of growth prospects)
- 5.1 Form
- 5.1.1 Macrobials
- 5.1.1.1 By Organism
- 5.1.1.1.1 Entamopathogenic Nematodes
- 5.1.1.1.2 Parasitoids
- 5.1.1.1.3 Predators
- 5.1.2 Microbials
- 5.1.2.1 By Organism
- 5.1.2.1.1 Bacterial Biocontrol Agents
- 5.1.2.1.2 Fungal Biocontrol Agents
- 5.1.2.1.3 Other Microbials
- 5.1.1 Macrobials
- 5.2 Crop Type
- 5.2.1 Cash Crops
- 5.2.2 Horticultural Crops
- 5.2.3 Row Crops
- 5.3 Region
- 5.3.1 Africa
- 5.3.1.1 By Country
- 5.3.1.1.1 Egypt
- 5.3.1.1.2 Nigeria
- 5.3.1.1.3 South Africa
- 5.3.1.1.4 Rest of Africa
- 5.3.2 Asia-Pacific
- 5.3.2.1 By Country
- 5.3.2.1.1 Australia
- 5.3.2.1.2 China
- 5.3.2.1.3 India
- 5.3.2.1.4 Indonesia
- 5.3.2.1.5 Japan
- 5.3.2.1.6 Philippines
- 5.3.2.1.7 Thailand
- 5.3.2.1.8 Vietnam
- 5.3.2.1.9 Rest of Asia-Pacific
- 5.3.3 Europe
- 5.3.3.1 By Country
- 5.3.3.1.1 France
- 5.3.3.1.2 Germany
- 5.3.3.1.3 Italy
- 5.3.3.1.4 Netherlands
- 5.3.3.1.5 Russia
- 5.3.3.1.6 Spain
- 5.3.3.1.7 Turkey
- 5.3.3.1.8 United Kingdom
- 5.3.3.1.9 Rest of Europe
- 5.3.4 Middle East
- 5.3.4.1 By Country
- 5.3.4.1.1 Iran
- 5.3.4.1.2 Saudi Arabia
- 5.3.4.1.3 Rest of Middle East
- 5.3.5 North America
- 5.3.5.1 By Country
- 5.3.5.1.1 Canada
- 5.3.5.1.2 Mexico
- 5.3.5.1.3 United States
- 5.3.5.1.4 Rest of North America
- 5.3.6 South America
- 5.3.6.1 By Country
- 5.3.6.1.1 Argentina
- 5.3.6.1.2 Brazil
- 5.3.6.1.3 Rest of South America
- 5.3.1 Africa
6 COMPETITIVE LANDSCAPE
- 6.1 Key Strategic Moves
- 6.2 Market Share Analysis
- 6.3 Company Landscape
- 6.4 Company Profiles (includes Global Level Overview, Market Level Overview, Core Business Segments, Financials, Headcount, Key Information, Market Rank, Market Share, Products and Services, and Analysis of Recent Developments).
- 6.4.1 Andermatt Group AG
- 6.4.2 Beneficial Insectary Inc.
- 6.4.3 Biobee Ltd
- 6.4.4 Biobest Group NV
- 6.4.5 Bioline AgroSciences Ltd
- 6.4.6 Bioworks Inc.
- 6.4.7 Henan Jiyuan Baiyun Industry Co. Ltd
- 6.4.8 Koppert Biological Systems Inc.
- 6.4.9 T Stanes and Company Limited
- 6.4.10 VIRIDAXIS SA
7 KEY STRATEGIC QUESTIONS FOR AGRICULTURAL BIOLOGICALS CEOS
8 APPENDIX
- 8.1 Global Overview
- 8.1.1 Overview
- 8.1.2 Porter's Five Forces Framework
- 8.1.3 Global Value Chain Analysis
- 8.1.4 Market Dynamics (DROs)
- 8.2 Sources & References
- 8.3 List of Tables & Figures
- 8.4 Primary Insights
- 8.5 Data Pack
- 8.6 Glossary of Terms

