
米国のヘンププロテイン:市場シェア分析、産業動向・統計、成長予測(2025年~2030年)
United States Hemp Protein - Market Share Analysis, Industry Trends & Statistics, Growth Forecasts (2025 - 2030)- 発行日
- ページ情報
- 英文 149 Pages
- 納期
- 2~3営業日
- 商品コード
- 1693693
- カスタマイズ可能 お客様のご希望に応じて、既存データの加工や未掲載情報(例:国別セグメント)の追加などの対応が可能です。詳細はお問い合わせください。
- 適宜更新あり 本レポートは最新情報反映のため適宜更新し、内容構成変更を行う場合があります。ご検討の際はお問い合わせください。
- 翻訳ツール提供対象 PDF対応AI翻訳ツールの無料貸し出しサービスのご利用が可能です
概要
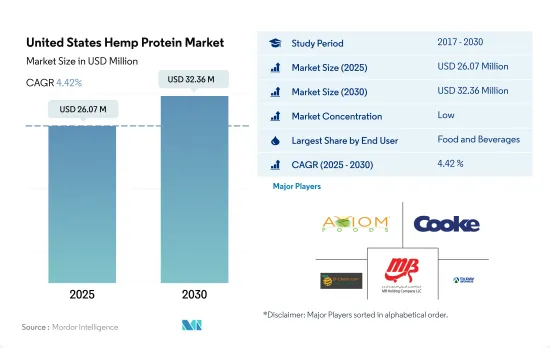
米国のヘンププロテイン市場規模は2025年に2,607万米ドルと推定され、2030年には3,236万米ドルに達すると予測され、予測期間中(2025-2030年)のCAGRは4.42%で成長する見込みです。
タンパク質が豊富で繊維質の多いタンパク質への関心の高まりが、ヘンププロテインのサプリメント分野への応用に大きく影響しています。
- COVID-19が国内を襲うと、消費者は免疫力を高めるためにビタミンとミネラルのサプリメントに注目しました。ビタミンとミネラルのサプリメントに対する嗜好は、2019年の76%から2020年にはほぼ95%に激増しました。2020年には、アメリカ人の91%が免疫力を高めるサプリメントの消費を増やし、約98%がCOVID-19パンデミックの間にマルチビタミンを消費しました。このシナリオは、タンパク質ベースのサプリメント需要を弱め、市場にさらに影響を与えました。
- レビュー期間中、サプリメントは米国のヘンププロテイン市場で最も支配的なセグメントであり続けた。サプリメントは市場で2番目のシェアを占め、予測期間のCAGRは金額ベースで5.04%と予測されています。近年、ヘンププロテインは天然のスポーツサプリメントとして、あるいは食物繊維や健康的な脂肪(オメガ3とオメガ6)を多く含み、鼓腸を起こさないタンパク質豊富なブーストとして人気を博しています。具体的には、オメガ3、6、9脂肪酸が含まれています。また、ヘンププロテインは、時間が経っても常にエネルギーレベルを高めてくれます。
- 飲食品市場は主要な市場シェアを占め、予測期間には金額ベースでCAGR 3.27%を記録すると予測されています。しかし、2020年にはシナリオが変わり、基準年のタンパク質ベースのサプリメント需要が弱まったため、F&Bセクターがトップの座を獲得しました。プロテイン食品への関心の高まりと健康的なライフスタイルの台頭により、63%がほとんどまたは常に健康的な食事を心がけています。スナック菓子では、有機的に調達されたヘンププロテインは主にフレークの形で使用され、タンパク質強化とともに製品に歯ごたえを加えています。
米国のヘンププロテイン市場動向
植物性タンパク質消費量の成長が原料市場の主要企業に機会を提供
- 米国では、投資と技術革新に支えられて、一人当たりの植物性タンパク質消費量がかなりの割合で増加しており、その結果、消費量は一日当たり40.28グラムに達しています。米国では、動物が虐待される工場畜産が常態化しているからです。多くのアメリカ人は肉や動物性食品の摂取量を減らしているが、完全に排除しているわけではないです。また、ビーガンやベジタリアンよりもフレキシタリアンである傾向が強いです。米国では12%近くの消費者が植物性の食事を好み、7%の消費者がフレキシタリアンです。米国ではあらゆる世代の消費者が植物ベースの食事に関心を持っているが、20代と30代が最も植物ベースの食事に熱心です。
- 肉、鶏肉、ベーカリー製品など、さまざまな食品に幅広く応用されているため、一人当たりのエンドウタンパク消費量は常に増加しています。約41%の消費者がエンドウタンパク由来の植物性食品に関心を持っています。エンドウ豆プロテインは主にスポーツ栄養や肉の代替食品に使用されています。エンドウ豆プロテインパウダーの典型的な1食分は30グラムで、25グラムのタンパク質が含まれています。アスリートは通常1日1食を使用するが、1日3食摂取することもあります。
- 大豆プロテインと乳清プロテインは、主に飲食品、サプリメント、スポーツ栄養産業で使用されています。2021年には、約36%の消費者が大豆タンパク質を知っており、摂取したことがあるのに対し、米国では31%の人がホエイプロテインを摂取していました。同様に、大豆ベースの飲食品の消費は2014年から2019年にかけて12.9%増加し、予測期間中も一貫して増加し続ける可能性が高いです。
米国のヘンププロテイン産業概要
米国のヘンププロテイン市場は断片化されており、上位5社で31.81%を占めています。同市場の主要企業は以下の通り。 Axiom Foods Inc., Cooke Inc., ETChem, Martin Bauer Group and Tilray Inc.(アルファベット順)
その他の特典
- エクセル形式の市場予測(ME)シート
- 3ヶ月間のアナリストサポート
目次
第1章 エグゼクティブサマリーと主な調査結果
第2章 イントロダクション
- 調査の前提条件と市場定義
- 調査範囲
- 調査手法
第3章 主要産業動向
- エンドユーザー市場規模
- ベビーフードおよび乳児用調製粉乳
- ベーカリー
- 飲料
- 朝食用シリアル
- 調味料/ソース
- 菓子類
- 乳製品および乳製品代替製品
- 高齢者栄養・医療栄養
- 肉・鶏肉・魚介類および肉代替製品
- RTE/RTC食品
- スナック
- スポーツ/パフォーマンス栄養
- 動物飼料
- パーソナルケアと化粧品
- タンパク質消費動向
- 植物
- 規制の枠組み
- 米国
- バリューチェーンと流通チャネル分析
第4章 市場セグメンテーション
- エンドユーザー
- 飲食品
- サブエンドユーザー別
- ベーカリー
- 飲料
- スナック
- サプリメント
- サブエンドユーザー別
- 高齢者栄養および医療栄養
- スポーツ/パフォーマンス栄養
- 飲食品
第5章 競合情勢
- 主要な戦略動向
- 市場シェア分析
- 企業情勢
- 企業プロファイル.
- A. Costantino & C. SpA
- Axiom Foods Inc.
- Bioway(Xi'An)Organic Ingredients Co. Ltd
- Cooke Inc.
- ETChem
- Foodcom SA
- Green Source Organics
- Martin Bauer Group
- Tilray Inc.
第6章 CEOへの主な戦略的質問
第7章 付録
- 世界概要
- 概要
- ファイブフォース分析フレームワーク
- 世界のバリューチェーン分析
- 市場力学(DROs)
- 情報源と参考文献
- 図表一覧
- 主要洞察
- データパック
- 用語集
目次
Product Code: 93462
The United States Hemp Protein Market size is estimated at 26.07 million USD in 2025, and is expected to reach 32.36 million USD by 2030, growing at a CAGR of 4.42% during the forecast period (2025-2030).
Growing interest in protein-rich, high-fiber protein is impacting the application of hemp protein largely in supplements sector
- As COVID-19 hit the country, consumers focused on vitamin and mineral supplements to boost their immunity. The preference for vitamin and mineral supplements has increased drastically from 76% in 2019 to almost 95% in 2020. In 2020, 91% of Americans increased their consumption of immunity-boosting supplements, and about 98% consumed multivitamins during the COVID-19 pandemic. The scenario weakened the protein-based supplement demand, further affecting the market.
- Over the review period, supplements remained the most dominant segment in the US hemp protein market. Supplements hold the second major share in the market, it is projected to register a CAGR of 5.04% by value in the forecasted period. In recent years, hemp protein has gained popularity as a natural sports supplement or a protein-rich boost that is high in fiber, and healthy fats (omega 3 and 6), and does not cause bloating. Specifically, omega 3, 6, and 9 fatty acids are included in the product. Hemp protein also constantly boosts energy levels over time.
- The market for food and beverages possesses a major market share, it is projected to register a CAGR of 3.27% by value in the forecasted period. However, the scenario changed in 2020, as the F&B sector claimed its top position due to the weakened protein-based supplement demand in the base year. The rising interest in protein foods and the rise in a healthy lifestyle, with 63% trying to eat healthy most or all of the time. In snacks, organically sourced hemp protein is mainly used in the form of flakes that add a crunch to the product, along with providing protein fortification.
United States Hemp Protein Market Trends
Growth in plant protein consumption provides opportunities for key players in the ingredients market
- The per capita consumption rate of plant proteins is increasing at a considerable rate in the United States, supported by investments and innovations, resulting in a consumption rate of 40.28 grams per day, primarily due to a rising number of consumers turning vegan to promote animal welfare. This is because factory farming, where animals are maltreated, is a norm in the United States. Most Americans eat less meat and animal products, but they do not eliminate their consumption entirely. They also tend to be more flexitarian than vegan or vegetarian. Nearly 12% of consumers in the country prefer a plant-based diet, whereas 7% of consumers follow a flexitarian diet. Although consumers of all generations in the United States are interested in plant-based meals, individuals in their 20s and 30s are the keenest to adopt plant-based diets.
- There is a constant rise in the per capita consumption of pea protein due to its wide applications in different food products, like meat, poultry, and bakery products. Around 41% of consumers are interested in plant-based food derived from pea protein. Pea protein is mainly used in sports nutrition and meat alternatives. A typical serving of pea protein powder is 30 grams, with 25 grams of protein. Athletes usually use one serving per day but may take as many as three servings per day.
- Soy and whey proteins are used primarily in the food and beverage, supplement, and sports nutrition industries. In 2021, around 36% of consumers were familiar with soy protein and had consumed the same, whereas 31% of individuals consumed whey protein in the US. Similarly, the consumption of soy-based food and beverages favorably increased by 12.9% during 2014-2019, and it is likely to remain consistent throughout the forecast period.
United States Hemp Protein Industry Overview
The United States Hemp Protein Market is fragmented, with the top five companies occupying 31.81%. The major players in this market are Axiom Foods Inc., Cooke Inc., ETChem, Martin Bauer Group and Tilray Inc. (sorted alphabetically).
Additional Benefits:
- The market estimate (ME) sheet in Excel format
- 3 months of analyst support
TABLE OF CONTENTS
1 EXECUTIVE SUMMARY & KEY FINDINGS
2 INTRODUCTION
- 2.1 Study Assumptions & Market Definition
- 2.2 Scope of the Study
- 2.3 Research Methodology
3 KEY INDUSTRY TRENDS
- 3.1 End User Market Volume
- 3.1.1 Baby Food and Infant Formula
- 3.1.2 Bakery
- 3.1.3 Beverages
- 3.1.4 Breakfast Cereals
- 3.1.5 Condiments/Sauces
- 3.1.6 Confectionery
- 3.1.7 Dairy and Dairy Alternative Products
- 3.1.8 Elderly Nutrition and Medical Nutrition
- 3.1.9 Meat/Poultry/Seafood and Meat Alternative Products
- 3.1.10 RTE/RTC Food Products
- 3.1.11 Snacks
- 3.1.12 Sport/Performance Nutrition
- 3.1.13 Animal Feed
- 3.1.14 Personal Care and Cosmetics
- 3.2 Protein Consumption Trends
- 3.2.1 Plant
- 3.3 Regulatory Framework
- 3.3.1 United States
- 3.4 Value Chain & Distribution Channel Analysis
4 MARKET SEGMENTATION (includes market size in Value in USD and Volume, Forecasts up to 2030 and analysis of growth prospects)
- 4.1 End User
- 4.1.1 Food and Beverages
- 4.1.1.1 By Sub End User
- 4.1.1.1.1 Bakery
- 4.1.1.1.2 Beverages
- 4.1.1.1.3 Snacks
- 4.1.2 Supplements
- 4.1.2.1 By Sub End User
- 4.1.2.1.1 Elderly Nutrition and Medical Nutrition
- 4.1.2.1.2 Sport/Performance Nutrition
- 4.1.1 Food and Beverages
5 COMPETITIVE LANDSCAPE
- 5.1 Key Strategic Moves
- 5.2 Market Share Analysis
- 5.3 Company Landscape
- 5.4 Company Profiles (includes Global Level Overview, Market Level Overview, Core Business Segments, Financials, Headcount, Key Information, Market Rank, Market Share, Products and Services, and Analysis of Recent Developments).
- 5.4.1 A. Costantino & C. SpA
- 5.4.2 Axiom Foods Inc.
- 5.4.3 Bioway (Xi'An) Organic Ingredients Co. Ltd
- 5.4.4 Cooke Inc.
- 5.4.5 ETChem
- 5.4.6 Foodcom SA
- 5.4.7 Green Source Organics
- 5.4.8 Martin Bauer Group
- 5.4.9 Tilray Inc.
6 KEY STRATEGIC QUESTIONS FOR PROTEIN INGREDIENTS INDUSTRY CEOS
7 APPENDIX
- 7.1 Global Overview
- 7.1.1 Overview
- 7.1.2 Porter's Five Forces Framework
- 7.1.3 Global Value Chain Analysis
- 7.1.4 Market Dynamics (DROs)
- 7.2 Sources & References
- 7.3 List of Tables & Figures
- 7.4 Primary Insights
- 7.5 Data Pack
- 7.6 Glossary of Terms
米国のヘンププロテイン:市場シェア分析、産業動向・統計、成長予測(2025年~2030年)
- 発行日
- 発行
- Mordor Intelligence
- ページ情報
- 英文 149 Pages
- 納期
- 2~3営業日