
|
市場調査レポート
商品コード
1692582
アジア太平洋地域の自動車用接着剤とシーラント:市場シェア分析、産業動向・統計、成長予測(2025年~2030年)Asia-Pacific Automotive Adhesives & Sealants - Market Share Analysis, Industry Trends & Statistics, Growth Forecasts (2025 - 2030) |
||||||
カスタマイズ可能
適宜更新あり
|
|||||||
| アジア太平洋地域の自動車用接着剤とシーラント:市場シェア分析、産業動向・統計、成長予測(2025年~2030年) |
|
出版日: 2025年03月18日
発行: Mordor Intelligence
ページ情報: 英文 218 Pages
納期: 2~3営業日
|

全表示
- 概要
- 目次
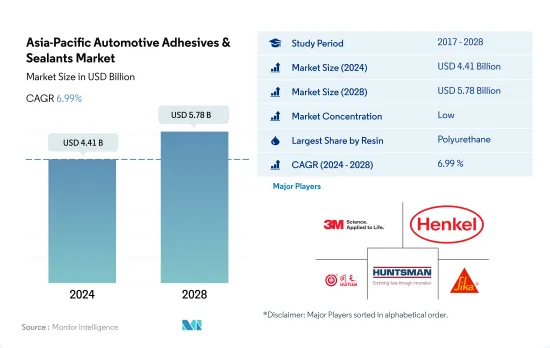
アジア太平洋地域の自動車用接着剤とシーラント市場規模は2024年に44億1,000万米ドルと推定・予測され、2028年には57億8,000万米ドルに達すると予測され、予測期間中(2024-2028年)のCAGRは6.99%で成長すると予測されます。
自動車産業における持続可能性の採用とEV生産の増加が市場需要を促進
- アジア太平洋地域の自動車用接着剤とシーラント市場では、ポリウレタン樹脂が最大のシェアを占めています。北米には多くの生産施設があるため、ポリウレタン接着剤の使用範囲は他の樹脂よりも高いです。2017年から2019年にかけて、自動車生産の減少により消費成長率は約-5%減少しました。COVID-19パンデミックの後、消費成長率は前年比10%上昇しました。ポリウレタン接着剤は、2022年から2028年の予測期間中にCAGR 4.5%を記録すると予想されます。
- エポキシ接着剤とアクリル接着剤もアジア太平洋自動車用接着剤市場で大きな存在感を示しています。しかし、エポキシ接着剤を製造するために使用される原材料は性質上有害であるため、AICS、PICCS、IECSC、NZIoCといった地域の政府機関によって規制されつつあります。エポキシ接着剤は第2位の消費材料であり、予測期間2022-2028年のCAGRは約4.2%を記録すると予想されます。エポキシ接着剤分野に続いて、アクリル接着剤分野が2022~2028年の予測期間に約4.5%のCAGRで推移すると予測されています。
- シアノアクリレートやシリコーンシーラントなどの接着剤は増加傾向にあります。自動車産業における持続可能性の採用は著しく増加しており、EVの生産も大幅に増加しています。その結果、自動車の電子部品アセンブリにこれらの接着剤の使用が増加しており、その結果、今後数年間の需要増加につながる可能性があります。シアノアクリレート系接着剤とシリコーン系接着剤は、2022~2028年の予測期間中、数量ベースでそれぞれ3.41%以上、4.05%以上のCAGRで推移すると予想されます。
主要自動車メーカーである中国が市場の主導権を握る
- アジア太平洋地域は世界最大の自動車生産国であり、中国、インド、日本といった国々が世界の主要自動車生産国のひとつです。同地域の自動車生産台数は、2021年の4,790万台から2022年には5.9%の成長が見込まれています。
- 2020年には、中国、インド、マレーシア、日本、インドネシアなど多くの国がCOVID-19パンデミックの影響を受けました。自動車用接着剤とシーラントの消費量は、生産施設の閉鎖、国際国境の閉鎖、いくつかの国における原材料不足により、2019年と比較して13.3%近く減少しました。
- アジア太平洋は接着剤とシーラントの生産で成長している地域であり、中でも中国は国内の高品質な生産設備により自動車用接着剤とシーラントの最大の生産国です。中国には100社以上の接着剤・シーラントメーカーがあり、世界中に製品を供給しています。インドも自動車生産大国であり、2022年には2021年比6.5%増の610万台の自動車生産が見込まれています。
- 多くの国が電気自動車を推進する政策を実施しているため、この地域では電気自動車の生産が増加しています。中国とインドは電気自動車の成長市場です。これらの要因は、予測期間において自動車用接着剤とシーラントの需要を促進すると予想されます。例えば、中国における電気自動車の生産台数は2021年には111万台となり、2020年よりも1.05%増加しました。
アジア太平洋地域の自動車用接着剤とシーラント市場の動向
電気自動車の普及が業界を牽引
- アジア太平洋地域の自動車産業は、自動車販売台数が大きく伸びており、市場を牽引する産業の一つです。すべての国の中で、中国が最大の自動車生産国で、この地域の生産量の約57%を占めており、次いで日本が17%、インドが10%、韓国が8%となっています。
- 同地域の自動車販売台数は生産台数とともに大きく減少しており、そのために接着剤の利用が影響を受けています。2017-18年の前年比変動は-1.8%であったが、2018-19年はさらに-6.4%減少しました。2019-20年には、地域の生産は再びマイナスの影響を受け、COVID-19の流行により前年比-10.2%を記録しました。製造施設の操業停止とサプライチェーンの混乱による自動車部品の不足が生産水準を制約しました。しかし、2021年には自動車需要が再び増加し、今後も続くと予想されるため、予測期間中は地域全体で接着剤の利用が増加します。
- アジア太平洋のEV市場は、接着剤市場にとってもう一つの成長機会となります。EVとハイブリッド車の生産台数と採用台数の増加が、自動車の電子部品組立用接着剤の使用量を押し上げています。中国はEVの世界最大の生産国であると同時に、この地域全体でも最大の生産国です。2016年から2021年にかけて、商用電気自動車の台数は562,603台から1,116,382台に増加し、約98%の成長率を記録しました。これらの要因によって接着剤の需要が増加し、予測期間中の市場成長率が高まると予想されます。
アジア太平洋地域の自動車用接着剤とシーラント産業の概要
アジア太平洋地域の自動車用接着剤とシーラント市場は断片化されており、上位5社で13.25%を占めています。この市場の主要企業は以下の通りです。 3M, Henkel AG & Co. KGaA, Hubei Huitian New Materials, Huntsman International LLC and Sika AG(アルファベット順)
その他の特典
- エクセル形式の市場予測(ME)シート
- 3ヶ月のアナリストサポート
目次
第1章 エグゼクティブサマリーと主な調査結果
第2章 レポートのオファー
第3章 イントロダクション
- 調査の前提条件と市場定義
- 調査範囲
- 調査手法
第4章 主要産業動向
- エンドユーザー動向
- 自動車
- 規制の枠組み
- オーストラリア
- 中国
- インド
- インドネシア
- 日本
- マレーシア
- シンガポール
- 韓国
- タイ
- バリューチェーンと流通チャネル分析
第5章 市場セグメンテーション
- 樹脂
- アクリル
- シアノアクリレート
- エポキシ
- ポリウレタン
- シリコーン
- VAE・EVA
- その他の樹脂
- テクノロジー
- ホットメルト
- 反応性
- シーラント
- 溶剤系
- UV硬化型接着剤
- 水性
- 国名
- オーストラリア
- 中国
- インド
- インドネシア
- 日本
- マレーシア
- シンガポール
- 韓国
- タイ
- その他アジア太平洋地域
第6章 競合情勢
- 主要な戦略動向
- 市場シェア分析
- 企業情勢
- 企業プロファイル
- 3M
- Arkema Group
- Dow
- H.B. Fuller Company
- Henkel AG & Co. KGaA
- Hubei Huitian New Materials Co. Ltd
- Huntsman International LLC
- SHINSUNG PETROCHEMICAL
- Sika AG
- ThreeBond Holdings Co., Ltd.
第7章 CEOへの主な戦略的質問
第8章 付録
- 世界の接着剤とシーラント産業の概要
- 概要
- ファイブフォース分析フレームワーク(産業魅力度分析)
- 世界のバリューチェーン分析
- 促進要因、抑制要因、機会
- 情報源と参考文献
- 図表一覧
- 主要洞察
- データパック
- 用語集
The Asia-Pacific Automotive Adhesives & Sealants Market size is estimated at 4.41 billion USD in 2024, and is expected to reach 5.78 billion USD by 2028, growing at a CAGR of 6.99% during the forecast period (2024-2028).
The adoption of sustainability in the automotive industry coupled with growing EV production to aid market demand
- Across the Asia-Pacific automotive adhesives and sealants market, polyurethane resins account for the largest share. The scope of polyurethane adhesive in North America is higher than other resins since the region includes many production facilities. From 2017 to 2019, the consumption growth rate declined by about -5% due to a reduction in automotive production. After the COVID-19 pandemic, the consumption growth rate rose by 10% Y-o-Y. Polyurethane adhesives are expected to record a CAGR of 4.5% during the forecast period 2022 to 2028.
- Epoxy and acrylic adhesives also have a significant presence in the Asia-Pacific automotive adhesives market. However, for epoxy, the upcoming year could be a great challenge as the raw materials used to produce epoxy adhesives are hazardous in nature and, thus, are getting regulated by government bodies in the region, such as AICS, PICCS, IECSC, and NZIoC. Epoxy adhesive is the second-largest consumed material and is expected to record a CAGR of about 4.2% during the forecast period 2022-2028. The epoxy adhesives segment is followed by the acrylic adhesives segment, which is expected to record a CAGR of about 4.5% during the forecast period 2022-2028.
- Adhesives such as cyanoacrylate and silicone sealants are on a growing trend. The adoption of sustainability in the automotive industry is increasing significantly, and EV production is increasing to a large extent. As a result, the usage of these adhesives for electronic component assembly in automobiles is increasing, which, as a result, may lead to increased demand over the coming years. Cyanoacrylate and silicone adhesives are expected to record CAGRs of above 3.41% and 4.05%, respectively, in terms of volume during the forecast period 2022-2028.
China to hold the pole position in the market owing to being major automobile manufacturer
- The Asia-Pacific is the largest producer of vehicles in the world, as countries like China, India, and Japan are among the major vehicle producers across the globe. Vehicle production in the region was expected to grow by 5.9% in 2022 from 47.9 million units in 2021.
- In 2020, many countries, including China, India, Malaysia, Japan, and Indonesia, were impacted by the COVID-19 pandemic. The consumption of automotive adhesives and sealants declined by nearly 13.3% compared to 2019 due to the shutdown of production facilities, the closing of international borders, and raw material shortages in several countries.
- Asia-Pacific is a growing region in the production of adhesives and sealants, of which China is the largest producer of automotive adhesives and sealants owing to the high-quality production facilities in the country. China has over 100 adhesives and sealants manufacturers supplying products worldwide. India is also a leading producer of vehicles, and it was expected to produce 6.1 million units of vehicles in 2022, which is 6.5% more than in 2021.
- The production of electric vehicles is increasing in the region due to the policies implemented by many countries to promote electric vehicles. China and India are the growing markets for electric vehicles. These factors are expected to drive the demand for automotive adhesives and sealants in the forecast period. For instance, electric vehicle production in China amounted to 1.11 million units in 2021, an increase of 1.05% more than in 2020.
Asia-Pacific Automotive Adhesives & Sealants Market Trends
Increasing adoption of electric vehicles to drive the industry
- The Asia-Pacific automotive industry is one of the leading industries in the market, as the sales of automotive vehicles are largely increasing. Among all the countries, China is the largest automotive producer, accounting for about 57% of the regional production, followed by Japan with 17%, India with 10%, and South Korea with 8%.
- Vehicle sales in the region have majorly declined along with production, owing to which the utilization of adhesives has been impacted. While the Y-o-Y variation in 2017-18 was -1.8%, it fell further by -6.4% in 2018-19. In 2019-20, regional production was again impacted negatively and recorded a -10.2% decline from the previous year due to the COVID-19 pandemic. The shutdown of manufacturing facilities and the shortage of vehicle components due to disruptions in the supply chain constrained the production level. However, in 2021, the demand for automobiles rose again and is expected to continue, thereby increasing the utilization of adhesives across the region over the forecast period.
- The EV market in Asia-Pacific offers another opportunity for the adhesives market to grow. The rising production and adoption of EVs and hybrid vehicles are boosting the usage of adhesives for electronic component assembly in vehicles. China is the largest producer of EVs globally as well as across the region. From 2016 to 2021, the volume of commercial electric vehicles increased from 562,603 to 1,116,382 units, recording a growth rate of about 98%. These factors are expected to increase the demand for adhesives and result in the higher market growth over the forecast period.
Asia-Pacific Automotive Adhesives & Sealants Industry Overview
The Asia-Pacific Automotive Adhesives & Sealants Market is fragmented, with the top five companies occupying 13.25%. The major players in this market are 3M, Henkel AG & Co. KGaA, Hubei Huitian New Materials Co. Ltd, Huntsman International LLC and Sika AG (sorted alphabetically).
Additional Benefits:
- The market estimate (ME) sheet in Excel format
- 3 months of analyst support
TABLE OF CONTENTS
1 EXECUTIVE SUMMARY & KEY FINDINGS
2 REPORT OFFERS
3 INTRODUCTION
- 3.1 Study Assumptions & Market Definition
- 3.2 Scope of the Study
- 3.3 Research Methodology
4 KEY INDUSTRY TRENDS
- 4.1 End User Trends
- 4.1.1 Automotive
- 4.2 Regulatory Framework
- 4.2.1 Australia
- 4.2.2 China
- 4.2.3 India
- 4.2.4 Indonesia
- 4.2.5 Japan
- 4.2.6 Malaysia
- 4.2.7 Singapore
- 4.2.8 South Korea
- 4.2.9 Thailand
- 4.3 Value Chain & Distribution Channel Analysis
5 MARKET SEGMENTATION (includes market size in Value in USD and Volume, Forecasts up to 2028 and analysis of growth prospects)
- 5.1 Resin
- 5.1.1 Acrylic
- 5.1.2 Cyanoacrylate
- 5.1.3 Epoxy
- 5.1.4 Polyurethane
- 5.1.5 Silicone
- 5.1.6 VAE/EVA
- 5.1.7 Other Resins
- 5.2 Technology
- 5.2.1 Hot Melt
- 5.2.2 Reactive
- 5.2.3 Sealants
- 5.2.4 Solvent-borne
- 5.2.5 UV Cured Adhesives
- 5.2.6 Water-borne
- 5.3 Country
- 5.3.1 Australia
- 5.3.2 China
- 5.3.3 India
- 5.3.4 Indonesia
- 5.3.5 Japan
- 5.3.6 Malaysia
- 5.3.7 Singapore
- 5.3.8 South Korea
- 5.3.9 Thailand
- 5.3.10 Rest of Asia-Pacific
6 COMPETITIVE LANDSCAPE
- 6.1 Key Strategic Moves
- 6.2 Market Share Analysis
- 6.3 Company Landscape
- 6.4 Company Profiles (includes Global Level Overview, Market Level Overview, Core Business Segments, Financials, Headcount, Key Information, Market Rank, Market Share, Products and Services, and Analysis of Recent Developments).
- 6.4.1 3M
- 6.4.2 Arkema Group
- 6.4.3 Dow
- 6.4.4 H.B. Fuller Company
- 6.4.5 Henkel AG & Co. KGaA
- 6.4.6 Hubei Huitian New Materials Co. Ltd
- 6.4.7 Huntsman International LLC
- 6.4.8 SHINSUNG PETROCHEMICAL
- 6.4.9 Sika AG
- 6.4.10 ThreeBond Holdings Co., Ltd.
7 KEY STRATEGIC QUESTIONS FOR ADHESIVES AND SEALANTS CEOS
8 APPENDIX
- 8.1 Global Adhesives and Sealants Industry Overview
- 8.1.1 Overview
- 8.1.2 Porter's Five Forces Framework (Industry Attractiveness Analysis)
- 8.1.3 Global Value Chain Analysis
- 8.1.4 Drivers, Restraints, and Opportunities
- 8.2 Sources & References
- 8.3 List of Tables & Figures
- 8.4 Primary Insights
- 8.5 Data Pack
- 8.6 Glossary of Terms
