
|
市場調査レポート
商品コード
1911699
水産物:市場シェア分析、業界動向と統計、成長予測(2026年~2031年)Seafood - Market Share Analysis, Industry Trends & Statistics, Growth Forecasts (2026 - 2031) |
||||||
カスタマイズ可能
適宜更新あり
|
|||||||
| 水産物:市場シェア分析、業界動向と統計、成長予測(2026年~2031年) |
|
出版日: 2026年01月12日
発行: Mordor Intelligence
ページ情報: 英文 440 Pages
納期: 2~3営業日
|

概要
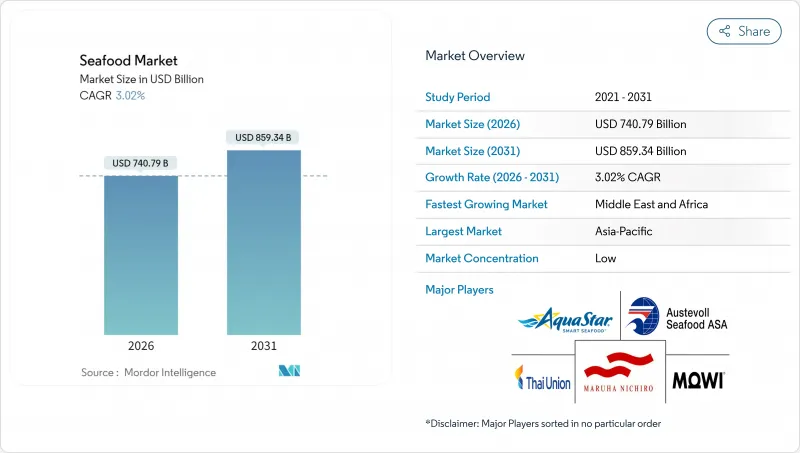
2026年の水産物市場規模は7,407億9,000万米ドルと推定されており、2025年の7,190億8,000万米ドルから成長が見込まれます。
2031年の予測では8,593億4,000万米ドルに達し、2026年から2031年にかけてCAGR3.02%で拡大する見通しです。
この成長は、養殖水産物の生産技術進歩と健康志向の食生活への関心の高まりが牽引要因となる競争の激しい市場を浮き彫りにしています。生産者はロボット工学、人工知能、センサーを活用した養殖手法などの技術への投資を拡大しています。これらの革新は飼料コストの削減、運営効率の向上、死亡率の低下に寄与し、結果として収益性の向上につながっています。同時に、企業はより厳格化する環境規制への対応を進めています。水産物種類別では魚が依然として主要カテゴリーですが、エビ分野では顕著な技術革新が進行中です。形態別では冷凍水産物が市場をリードしていますが、加工技術の進歩が新たな機会を創出しています。供給源別では天然漁獲水産物が伝統的な魅力を維持する一方、養殖水産物は効率性と持続可能性から支持を拡大中です。流通チャネルでは、オントレード(飲食店向け)販売が堅調を維持する一方、オフトレード(小売店向け)チャネルでは顕著な革新が進んでいます。水産物市場は細分化されており、多数のプレイヤーが市場シェアを争っています。主要企業は垂直統合に注力し、孵化場や育成場から加工施設、ブランド流通ネットワークに至るサプライチェーン全体の運営を管理しています。
世界の水産物市場の動向と洞察
タンパク質豊富な食品に対する消費者需要の高まり
より多くの消費者が健康的な食生活に注力し、タンパク質豊富な食品を食事に取り入れるようになっていることから、世界の水産物需要は増加しています。国際食品情報評議会(IFIC)の2024年食品・健康調査によると、消費者の71%が積極的にタンパク質摂取量の増加に取り組んでおり、食習慣の大きな変化を反映しています。2024年5月時点のPubMed Centralによれば、総重量の20~30%をタンパク質が占める水産物は、赤身肉や鶏肉と比較してより健康的かつ低脂肪なタンパク源と見なされています。世界自然保護基金(WWF)は、世界中で30億人以上が野生捕獲および養殖の魚介類を動物性タンパク質の一次情報として依存していることを強調し、世界の栄養安全保障を確保する上でその重要な役割を指摘しています。これらの要因が魚介類消費の着実な成長を促進しており、養殖業の拡大、持続可能な漁法、サプライチェーン効率の向上への投資増加を促しています。持続可能性と近代化へのこの高まる注目は、魚介類市場の長期的な発展を支えると期待されています。
食文化の世界の化と外食産業の需要
世界各国の料理の人気拡大と外食産業の活性化が、様々な飲食チャネルにおける水産物需要を牽引しております。消費者が国際的な味覚への関心を高める中、ファストフード店やカジュアルダイニングレストランでは、エビ、サーモン、イカなどの水産物を用いた革新的な料理の導入が進んでおります。米国経済分析局によれば、飲食施設における支出額は2025年第2四半期に過去最高の1兆2,493億米ドルに達し、第1四半期の1兆2,233億米ドルから増加しており、外食産業における強い消費者需要が浮き彫りとなっています。例えば、2025年9月8日にはレッドロブスターが「アルティメット・スプエンレス・シュリンプ」を発売しました。これはガーリックシュリンプスカンピ、シュリンプリングイーニアルフレド、ポップコーンシュリンプが15.99ドルで楽しめる、お財布に優しいメニューです。これは、飲食店が手頃な価格と創造的なメニュー提供を組み合わせ、より多くの顧客を惹きつけている実例です。こうした動向は、多様な料理への関心の高まりと安定した外食支出が、市場の拡大に寄与していることを反映しています。
代替タンパク質との競合
代替タンパク質の競合が、水産物市場にとって大きな課題となりつつあります。押出成形、発酵、3Dプリントといった技術の革新により、植物由来や培養技術を用いた水産物代替品が、従来の水産物の味、食感、栄養価を忠実に再現できるようになってきています。例えば、2025年8月にはレボ・フーズ社が「キンダ・サーモン」を発表しました。これはマイコプロテインを原料としたフィレで、サーモンのほぐれる食感を再現しつつ、外食産業のバイヤーにとってコスト効率の良い選択肢を提供しています。ベンチャーキャピタルからの資金増加がこの分野の急速な進歩を後押ししており、スタートアップ企業がフレキシタリアン消費者向けにこれらの代替品を効果的に販売することを可能にしています。若い購買層は購入決定時に環境持続可能性をますます重視しており、これが代替品の魅力を高めています。しかしながら、魚介類はオメガ3脂肪酸の天然源であるなど独自の利点を依然として保持しており、これらの要素が伝統的な魚介類の市場での存在感を維持する一助となっています。とはいえ、代替タンパク質の人気の高まりは、市場の長期的な成長にとって引き続き重大な課題となっています。
セグメント分析
魚は2025年においても世界水産物市場で52.06%という大きなシェアを占め、引き続き支配的な地位を維持しています。この優位性は主に、アジア太平洋地域、北米、欧州といった地域における堅調な消費パターンに起因しています。サーモンやマグロなどの人気種がこの消費量の大部分を占めており、持続可能性認証を取得した著名な種を優先的に扱う小売業者の取り組みがこれを支えています。消費者は、栄養価の高さ、トレーサビリティ、クリーンラベルの特性に惹かれて魚を選びます。これらは高まる健康意識や環境意識と合致しています。こうした要因により、市場が不安定な時期であっても、魚は水産物市場において安定した重要なセグメントであり続けることが保証されています。
エビは水産物市場で最も急速に成長しているセグメントとして台頭しており、2026年から2031年にかけてCAGR3.49%が見込まれています。この成長は、生存率の向上と生産サイクルの短縮を実現する養殖技術の進歩により、エビ養殖の効率化が進んでいることが原動力となっています。エビは様々な料理、特にファストフードやフュージョン料理における汎用性の高さから、世界の需要が拡大しています。多様な消費者市場での幅広い受容性も成長を支える要因です。こうした動向により、エビは魚介類セクターにおける主要な促進要因として位置付けられ、魚セグメントの安定した業績を補完しています。
2025年には冷凍シーフードが市場を独占し、全体の50.08%を占めました。この成長は主に、品質と安全性を維持しながら年間を通じてシーフードの供給を確保するコールドチェーンネットワークの効率性に起因しています。冷凍水産物は、保存期間の延長と利便性を提供するため、小売業者や外食産業事業者から高い支持を得ています。これにより様々な水産種の世界の流通が可能となり、地元生産が限られる地域においても信頼性の高い選択肢となっています。これらの要因から、冷凍水産物は商業需要と消費者需要の両方に効果的に対応する業界の主要セグメントとなっています。
加工水産物は、2031年までにCAGR3.78%と予測される最も急成長しているセグメントの一つとして台頭しています。この成長は、真空スキン包装や高圧処理技術など、製品の鮮度と安全性を高める包装・保存技術の進歩によって牽引されています。調理済み製品やシェフ監修の風味の導入により、消費者の関心が高まり、加工水産物の日常的な食事での利用が拡大しています。これらの革新は利便性を向上させるだけでなく、変化する消費者の嗜好にも応えるものであり、加工水産物を世界市場においてダイナミックかつ急速に成長するカテゴリーにしています。
本水産物市場レポートは、水産物の種類(魚、エビなど)、形態(缶詰、冷凍など)、生産源(養殖、天然)、流通経路(外食産業向け、小売向け)、地域(北米、欧州、アジア太平洋、南米、中東・アフリカ)ごとに分類されています。市場予測は、金額(米ドル)および数量(トン)で提供されます。
地域別分析
2025年時点でアジア太平洋地域は水産物市場において最大のシェア(45.12%)を占めました。中国は同地域をリードし、7,100万メトリックトン(うち養殖システム由来は5,812万トン)を生産しています。同地域の優位性は、中産階級の所得増加、加工施設の進歩、技術導入を促進する政府補助金によって支えられています。日本や韓国などの国々は、寿司や刺身文化が根強いことから、水産物の消費量が引き続き高い水準を維持しています。一方、ベトナムやタイは、コンプライアンス基準の改善やコールドチェーンインフラの強化により、輸出能力の拡大を図っています。
中東およびアフリカ地域は、2031年までCAGR3.55%と、最も高い成長率が見込まれています。湾岸協力会議(GCC)加盟国は、食糧安全保障の目標を達成するため、孵化場施設、遺伝学調査、自動化技術に多額の投資を行っています。ナイジェリアとエジプトは、国際融資を活用して養魚池の改良と飼料生産能力の増強を行っており、これにより国内供給と輸出の可能性の両方が高まると予想されます。モロッコは、大西洋の漁獲枠を活用して欧州市場に対応しており、南アフリカは、海藻栽培と魚類養殖を統合して水産物の生産を多様化しています。
北米と欧州は成熟した市場ですが、世界の水産業界において引き続き重要な役割を果たしています。米国は、輸入依存度を低減し、環境の持続可能性を向上させるため、サケの循環式養殖システムの拡大に注力しています。ノルウェーは、通貨の変動にもかかわらず、責任ある養殖サケの評判に後押しされ、2024年12月には輸出量の伸びを達成しました。欧州では、トレーサビリティとカーボンフットプリントの開示に関する規制指令が世界のベンチマークとなり、コンプライアンスへの投資を促進しています。南米では、チリなどの国々がサーモン輸出における地位を回復しつつある一方、エクアドルは有利な貿易協定を確保した後、エビ輸出を加速させています。
その他の特典:
- エクセル形式の市場予測(ME)シート
- アナリストによる3ヶ月間のサポート
よくあるご質問
目次
第1章 イントロダクション
- 調査の前提条件と市場の定義
- 調査範囲
第2章 調査手法
第3章 エグゼクティブサマリー
第4章 市場情勢
- 市場概要
- 市場促進要因
- タンパク質豊富な食品に対する消費者需要の高まり
- 技術と養殖技術革新
- 世界の水産物貿易と輸出機会の拡大
- 持続可能で認証済み、倫理的かつトレーサビリティのある水産物に対する消費者需要の高まり
- 食文化の世界の化と外食産業における需要
- 政府支援と漁業管理
- 市場抑制要因
- 代替タンパク質との競合
- 飼料価格の上昇と生産農場における疾病発生
- 厳格な規制および品質基準
- 違法・無報告・無規制(IUU)漁業
- 規制の見通し
- 消費者行動分析
- ポーターのファイブフォース
- 新規参入業者の脅威
- 買い手の交渉力
- 供給企業の交渉力
- 代替品の脅威
- 競争企業間の敵対関係
第5章 市場規模と成長予測(金額と数量)
- 水産物別
- 魚
- サーモン
- マグロ
- その他の魚の種類
- エビ
- その他の水産物
- 魚
- 形態別
- 缶詰
- 生鮮・冷蔵
- 冷凍
- 処理済み
- ソース別
- 養殖
- 天然物
- 流通チャネル別
- 小売店向け
- スーパーマーケット/ハイパーマーケット
- オンライン小売店
- コンビニエンスストア
- その他
- オントレード
- ホテル
- レストラン
- ケータリング
- 小売店向け
- 地域別
- 北米
- 米国
- カナダ
- メキシコ
- その他北米地域
- 南米
- ブラジル
- コロンビア
- チリ
- ペルー
- アルゼンチン
- その他南米
- 欧州
- 英国
- ドイツ
- フランス
- イタリア
- スペイン
- ポーランド
- ベルギー
- スウェーデン
- その他欧州地域
- アジア太平洋地域
- 中国
- 日本
- インド
- オーストラリア
- インドネシア
- 韓国
- タイ
- シンガポール
- その他アジア太平洋地域
- 中東・アフリカ
- 南アフリカ
- サウジアラビア
- アラブ首長国連邦
- ナイジェリア
- エジプト
- モロッコ
- トルコ
- その他中東・アフリカ地域
- 北米
第6章 競合情勢
- 市場集中度
- 戦略的動向
- 市場シェア分析
- 企業プロファイル
- Mazzetta Company, LLC
- Aqua Star Corp
- Austevoll Seafood ASA
- Ocean Garden Products Inc.(Central Seaway Company)
- Mowi ASA
- Apex Frozen Foods Ltd
- Maruha Nichiro Corp.(Umios Corp.)
- Grieg Aqua AS
- Beaver Street Fisheries
- Trident Seafoods Corp.
- Agrosuper S.A.
- The Waterbase Limited
- The Bumble Bee Seafood Company
- Thai Union(Chicken of the Sea)
- Avanti Feeds Limited
- Dulcich Inc.
- Woods Fisheries
- Sysco Corporation
- Cooke Inc.
- High Liner Foods Inc.

