
|
市場調査レポート
商品コード
1692028
ホエイプロテイン:市場シェア分析、産業動向・統計、成長予測(2025年~2030年)Whey Protein - Market Share Analysis, Industry Trends & Statistics, Growth Forecasts (2025 - 2030) |
||||||
カスタマイズ可能
適宜更新あり
|
|||||||
| ホエイプロテイン:市場シェア分析、産業動向・統計、成長予測(2025年~2030年) |
|
出版日: 2025年03月18日
発行: Mordor Intelligence
ページ情報: 英文 408 Pages
納期: 2~3営業日
|

全表示
- 概要
- 目次
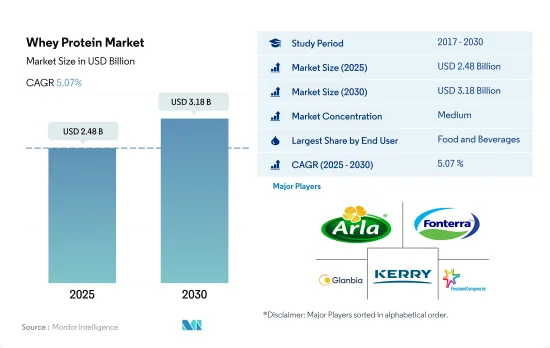
ホエイプロテインの市場規模は2025年に24億8,000万米ドルと推定され、2030年には31億8,000万米ドルに達すると予測され、予測期間(2025-2030年)のCAGRは5.07%で成長します。
フィットネスクラブの増加に伴う高タンパク飲料がセグメント需要を牽引
- 2022年には、飲食品セグメントが数量ベースで67.20%の大きなシェアを獲得し、優位を占めました。この背景には、少量でより頻繁な食事へのシフト、従来の食事からプロテインベースのスナックバーのようなより効率的な選択肢への移行、健康志向の飲料への嗜好の高まりがあります。さらに、糖分の多い食品に課税する世界の動向が、より健康的な代替飲料の需要をさらに押し上げました。
- アジア太平洋は、2022年に最大の市場シェアを占めてトップランナーに浮上し、予測期間を通じて金額ベースで4.59%のCAGRが予測され、リードを維持する見通しです。ホエイの水溶性とタンパク質強化に起因する飲料への需要の高まりは注目に値します。飲料メーカー、特に分散性に優れた高タンパク飲料を求めるメーカーは、ますますホエイに注目しています。さらに、特に韓国、中国、インドなどの国々でフィットネスセンターやヘルスセンターが急増しており、ホエイプロテインの地域別消費量は増加する傾向にあります。この増加は、より健康的なライフスタイルと食生活を選択する人口の増加によってもたらされます。
- より広範なセグメントの中では、スポーツ/パフォーマンス栄養が他を凌駕し、予想CAGRは金額ベースで5.9%です。アスリートは、筋肉増強と回復に役立つホエイプロテイン補給に注目しています。ホエイプロテインは、しばしば理学療法や心理療法と組み合わされ、アスリートのバイタルサインと全体的な身体能力を高めるのに役立っています。この動向は、ホエイプロテインサプリメントを中心としたスポーツ栄養を支持するフィットネス愛好家の増加によってさらに拍車がかかっています。注目すべきは、2021年には米国が38,477のヘルスクラブで首位に立ち、ブラジルの34,509、英国が7,000以上のジムを誇っていることです。
ホエイプロテインの需要は北米が大きく牽引し、アジア太平洋がそれに続く
- 北米が世界のホエイプロテイン市場を独占しています。スポーツ栄養学は常にタンパク質含有量に焦点を当てており、おそらく近年さらに強くなっており、2017年から2022年の間に米国では40%以上が発売されます。ホエイプロテインは吸収が非常に速く、運動後の筋肉疲労を防ぐと考えられているアミノ酸、システインの豊富な供給源でもあります。また、ホエイプロテインは分岐鎖アミノ酸の含有量も多く、激しい運動中のタンパク質の分解を抑え、筋肉の合成を促進します。
- アジア太平洋地域は、2022年に2番目に大きな市場であり、予測期間中に金額ベースで4.59%という最も速いCAGRで推移すると予測されています。中国は、2022年に金額ベースで市場シェアの37.58%を占めました。中国では近年、高タンパク商品が大きな注目を集め、食品購入前にタンパク質が最も求められる要素の1つとなっています。消費者は間食の際に、ホエイプロテインなどのより健康的な代替品を選ぼうとします。健康意識の高まりと、機能的な利点を持つ間食製品への需要の高まりが、ホエイプロテイン市場成長の主な促進要因と考えられています。
- その他の市場セグメントも引き続き莫大な市場開拓の可能性を秘めており、多国籍企業がアフリカ、南米、中東の乳清市場に多額の投資を行う誘惑に駆られています。人々が活動的なライフスタイルを採用することで、スポーツジムの会員数が増加し、スポーツ栄養製品の消費が増加しています。ホエイプロテインの補給は、筋肉の損傷を減らし、激しいトレーニングからの筋肉の回復を促進し、それによってスポーツのパフォーマンスを助ける。例えば、南アフリカでは2021年に278万人がフィットネスクラブやヘルスクラブの会員になっています。
世界のホエイプロテイン市場動向
健康意識の高まりとミレニアル世代からの需要増が市場を牽引
- 健康意識の高まりとミレニアル世代からの需要の急増がスポーツ栄養分野を牽引しています。この分野では、筋肉の維持や成長などの利点を理由に、消費者がタンパク質を強化した飲料や栄養補助食品を求める傾向が強まっています。例えば、2023年のCRN Consumer Survey on Dietary Supplements(栄養補助食品に関する消費者調査)によると、米国の成人の74%が栄養補助食品を摂取しており、そのうち55%が「常用者」であることが明らかになっています。
- スポーツドリンクは従来、激しい運動中の電解質補給を目的として販売されてきたが、炭水化物や塩分の増加、運動中のパフォーマンス向上といったメリットを強調するように進化してきました。この進化は、アクティブで健康的なライフスタイルへのシフトと一致しています。スポーツ栄養分野では、中高年層のスポーツ参加率の高まりが追い風となっています。例えば、2022年には、アジアの6~12歳の青少年の定期的なスポーツ参加率は、2019年の35%から42%に急上昇しました。
- 北米は、スポーツ動向の高まり、健康への関心、食生活に牽引され、スポーツ栄養セグメントの最前線に立っています。同市場は、健康上の利点を誇る風味イノベーションの継続的な動向から恩恵を受けると予想されます。一方、欧州は重要なプレーヤーとして台頭しており、英国、ドイツ、スペイン、フランスなどの主要市場が市場の主要シェアを占めています。2022年の統計によると、欧州連合(EU)の成人の38%が週に1回以上スポーツや運動を行っており、6%が週に5回行っています。
ドライホエイ生産を支える乳製品と乳製品誘導体の生産
- ホエイプロテインは、発展途上国の小規模農家で生産される生乳を原料としています。この生乳生産は家計を支え、食料安全保障と栄養の確保に重要な役割を果たしています。こうした小規模生産者にとって、生乳は迅速かつ大きな経済的見返りをもたらしています。過去30年間で、世界の生乳生産量は1988年の5億3,000万トンから2018年には8億4,300万トンへと59%以上も急増しました。チーズやカゼインをベースとする乳製品製造の貴重な製品別であるホエイは、豊富な栄養素を誇り、多様な商業的用途が見つかっています。凝固乳製品、特に需要が3倍に急増したギリシャヨーグルトへの旺盛な需要に牽引され、廃ホエイの量は急増しています。
- 世界の生乳生産量はインドがトップで、米国、中国、パキスタン、ブラジルがこれに続きます。インドの生乳生産量は2019年から2020年にかけて、過去9年間と比較して55.79%急増し、ホエイタンパクに対する需要の高まりを下支えしています。家畜の生産性を高めることを目的とした政府の取り組みにより、インドの生乳生産はさらなる成長を遂げようとしています。さらに、ホエイプロテイン濃縮物は、食品配合における費用対効果の高い卵白の代用品として新たな用途を見出しています。これらの濃縮タンパク質は、そのタンパク質含有量の増加により、栄養価を高めるだけでなく、乳化、起泡、水結合、粘度強化、ゲル化などの機能的特性の改善を食品にもたらします。
- アフリカの生乳生産が貧困と不利な気候条件のために課題に直面している一方で、他の地域では不足が見られます。中国、イタリア、ロシア、メキシコ、アルジェリア、インドネシアのような国々は生乳不足に悩まされており、ホエイプロテインを含む多額の輸入が必要となっています。このような新興国開拓は市場をさらに後押しします。
ホエイプロテイン産業の概要
ホエイプロテイン市場は適度に統合されており、上位5社で51.13%を占めています。この市場の主要企業は以下の通りです。 Arla Foods AMBA, Fonterra Co-operative Group Limited, Glanbia PLC, Kerry Group PLC and Royal FrieslandCampina NV(sorted alphabetically).
その他の特典
- エクセル形式の市場予測(ME)シート
- 3ヶ月のアナリストサポート
目次
第1章 エグゼクティブサマリーと主な調査結果
第2章 イントロダクション
- 調査の前提条件と市場定義
- 調査範囲
- 調査手法
第3章 主要産業動向
- エンドユーザー市場規模
- ベビーフードおよび乳児用調製乳
- ベーカリー
- 飲料
- 朝食用シリアル
- 調味料/ソース
- 菓子類
- 乳製品および乳製品代替製品
- 高齢者栄養・医療栄養
- 肉・鶏肉・魚介類および肉代替製品
- RTE/RTC食品
- スナック
- スポーツ/パフォーマンス栄養
- 動物飼料
- パーソナルケアと化粧品
- タンパク質消費動向
- 動物
- 生産動向
- 動物
- 規制の枠組み
- オーストラリア
- カナダ
- 中国
- フランス
- ドイツ
- インド
- イタリア
- 日本
- 英国
- 米国
- バリューチェーンと流通チャネル分析
第4章 市場セグメンテーション
- 形態
- 濃縮物
- 加水分解物
- 分離物
- エンドユーザー
- 動物飼料
- 飲食品
- サブエンドユーザー別
- ベーカリー
- 飲料
- 朝食用シリアル
- 調味料/ソース
- 乳製品及び乳製品代替製品
- RTE/RTC食品
- スナック
- パーソナルケアと化粧品
- サプリメント
- サブエンドユーザー別
- ベビーフードおよび乳児用調製乳
- 高齢者栄養と医療栄養
- スポーツ/パフォーマンス栄養
- 地域別
- アフリカ
- 形態別
- エンドユーザー別
- 国別
- ナイジェリア
- 南アフリカ
- その他のアフリカ
- アジア太平洋
- 形態別
- エンドユーザー別
- 国別
- オーストラリア
- 中国
- インド
- インドネシア
- 日本
- マレーシア
- ニュージーランド
- 韓国
- タイ
- ベトナム
- その他アジア太平洋地域
- 欧州
- 形態別
- エンドユーザー別
- 国別
- ベルギー
- フランス
- ドイツ
- イタリア
- オランダ
- ロシア
- スペイン
- トルコ
- 英国
- その他欧州
- 中東
- 形態別
- エンドユーザー別
- 国別
- イラン
- サウジアラビア
- アラブ首長国連邦
- その他中東
- 北米
- 形態別
- エンドユーザー別
- 国別
- カナダ
- メキシコ
- 米国
- その他北米
- 南米
- 形態別
- エンドユーザー別
- 国別
- アルゼンチン
- ブラジル
- その他南米地域
- アフリカ
第5章 競合情勢
- 主要な戦略動向
- 市場シェア分析
- 企業情勢
- 企業プロファイル.
- Agropur Dairy Cooperative
- Arla Foods AMBA
- Fonterra Co-operative Group Limited
- Glanbia PLC
- Groupe LACTALIS
- Hilmar Cheese Company, Inc.
- Kerry Group PLC
- Lacto Japan Co., Ltd.
- Royal FrieslandCampina NV
- Saputo Inc
第6章 CEOへの主な戦略的質問
第7章 付録
- 世界概要
- 概要
- ファイブフォース分析フレームワーク
- 世界のバリューチェーン分析
- 市場力学(DROs)
- 情報源と参考文献
- 図表一覧
- 主要洞察
- データパック
- 用語集
The Whey Protein Market size is estimated at 2.48 billion USD in 2025, and is expected to reach 3.18 billion USD by 2030, growing at a CAGR of 5.07% during the forecast period (2025-2030).
High-protein drinks with an increasing number of fitness clubs drove the segmental demand
- In 2022, the food and beverage segment dominated, capturing a significant 67.20% share by volume. This was fueled by a shift toward smaller, more frequent meals, a move from traditional diets to more efficient options like protein-based snack bars, and a growing appetite for health-conscious beverages. Additionally, a global trend towards taxing sugary foods further bolstered the demand for healthier drink alternatives.
- Asia-Pacific emerged as the frontrunner, holding the largest market share in 2022, and is poised to maintain its lead with a projected CAGR of 4.59% by value through the forecast period. The rising demand for whey in beverages, attributed to its water solubility and protein enrichment, is notable. Beverage manufacturers, especially those eyeing high-protein drinks with excellent dispersibility, are increasingly turning to whey. Moreover, with a surge in fitness and health centers, particularly in nations like South Korea, China, and India, the regional consumption of whey protein is set to rise. This uptick is driven by a growing populace opting for healthier lifestyles and dietary choices.
- Within the broader segment, sport/performance nutrition is set to outpace others, with a forecasted CAGR of 5.9% by value. Athletes are turning to whey protein supplementation for its muscle-building and recovery benefits. Often paired with physiotherapy and psychotherapy, whey protein aids in enhancing athletes' vital signs and overall physical performance. This trend is further fueled by a rising number of fitness enthusiasts endorsing sports nutrition centered around whey protein supplements. Notably, the US led the pack in 2021 with 38,477 health clubs, trailed by Brazil with 34,509, and the UK boasting over 7,000 gyms.
Demand for whey protein is largely driven by North America, followed by Asia-Pacific
- North America dominates the global whey protein market. Sports nutrition has always focused on protein content, which has probably grown even stronger in recent years, with over 40% of the US launches between 2017 and 2022. Whey protein is absorbed much faster and is also a rich source of cysteine, an amino acid thought to prevent post-exercise muscle fatigue. Whey protein also has a much higher content of branched-chain amino acids that help reduce protein degradation during heavy exercise and boost muscle synthesis.
- Asia-Pacific was the second-largest market in 2022, and it is projected to record the fastest CAGR of 4.59% by value during the forecast period. China accounted for 37.58% of the market share by value in 2022, as high-protein goods have gained significant public attention in China in recent years, identifying protein as one of the most sought-after elements prior to food purchase. Consumers try to opt for healthier alternatives, such as whey proteins, while snacking. Increasing health awareness and rising demand for snacking products with functional benefits are considered the major driving factors for the growth of the whey protein market.
- Other market segments continue to have enormous development potential, which is tempting multinational businesses to spend heavily in the whey market in Africa, South America, and the Middle East. People adopting an active lifestyle is helping increase gym memberships and the consumption of sports nutrition products. Whey protein supplementation reduces muscle damage and facilitates muscle recovery from strenuous training, thereby assisting sports performance. For example, 2.78 million people in South Africa had fitness and health club memberships in 2021.
Global Whey Protein Market Trends
Rising health awareness and growing demand from millennials are driving the market
- Rising health awareness and a surge in demand from millennials are driving the sports nutrition segment. The segment is witnessing an upswing, with consumers increasingly seeking protein-enriched beverages and dietary supplements, citing benefits like muscle maintenance and growth. For instance, the 2023 CRN Consumer Survey on Dietary Supplements reveals that 74% of US adults consume dietary supplements, with 55% identified as "regular users".
- Sports drinks, traditionally marketed for their electrolyte-replenishing properties during intense physical activities, have evolved to emphasize benefits such as increased carbohydrates, salts, and enhanced performance during workouts. This evolution aligns with the shift toward active and healthier lifestyles. The sports nutrition segment has seen a boost from growing participation in sports among middle-aged and elderly populations. For example, in 2022, the rate of regular sports participation among Asian youth aged 6 to 12 years surged to 42%, up from 35% in 2019.
- North America stands at the forefront of the sports nutrition segment, driven by a rising athletic trend, health concerns, and dietary habits. The market is expected to benefit from the ongoing trend of flavor innovations that boast health advantages. Meanwhile, Europe is emerging as a significant player, with key markets like the United Kingdom, Germany, Spain, and France commanding a major share of the market. In 2022, statistics revealed that 38% of adults in the European Union engaged in sports or exercise at least once a week, with 6% committing to it five times weekly.
Production of dairy and dairy derivatives to support dry whey production
- Whey proteins are sourced from raw milk produced by smallholders in developing nations. This milk production supports household livelihoods and plays a crucial role in ensuring food security and nutrition. For these small-scale producers, milk offers a swift and significant financial return. Over the past three decades, global milk production surged by over 59%, from 530 million tons in 1988 to 843 million tons in 2018. Whey, a valuable by-product from cheese and casein-based dairy manufacturing, boasts rich nutrients and finds diverse commercial applications. Driven by a rising appetite for coagulated milk products, notably Greek yogurt, which has seen a threefold surge in demand, volumes of waste whey have swelled.
- India leads global milk production, trailed by the United States, China, Pakistan, and Brazil. India's milk output surged by 55.79% in the 2019-2020 period compared to the previous nine years, underpinning the escalating demand for whey protein. With government initiatives aimed at boosting livestock productivity, India's milk production is poised for further growth. Additionally, whey protein concentrates are finding novel applications as cost-effective egg-white substitutes in food formulations. These concentrates, with their escalating protein content, not only enhance nutritional value but also bring improved functional attributes like emulsification, foaming, water binding, viscosity enhancement, and gelling to food products.
- While milk production in Africa faces challenges due to poverty and adverse climatic conditions, other regions exhibit deficits. Countries like China, Italy, Russia, Mexico, Algeria, and Indonesia are grappling with milk shortfalls, necessitating significant imports, including whey protein. Such developments further aid the market.
Whey Protein Industry Overview
The Whey Protein Market is moderately consolidated, with the top five companies occupying 51.13%. The major players in this market are Arla Foods AMBA, Fonterra Co-operative Group Limited, Glanbia PLC, Kerry Group PLC and Royal FrieslandCampina NV (sorted alphabetically).
Additional Benefits:
- The market estimate (ME) sheet in Excel format
- 3 months of analyst support
TABLE OF CONTENTS
1 EXECUTIVE SUMMARY & KEY FINDINGS
2 INTRODUCTION
- 2.1 Study Assumptions & Market Definition
- 2.2 Scope of the Study
- 2.3 Research Methodology
3 KEY INDUSTRY TRENDS
- 3.1 End User Market Volume
- 3.1.1 Baby Food and Infant Formula
- 3.1.2 Bakery
- 3.1.3 Beverages
- 3.1.4 Breakfast Cereals
- 3.1.5 Condiments/Sauces
- 3.1.6 Confectionery
- 3.1.7 Dairy and Dairy Alternative Products
- 3.1.8 Elderly Nutrition and Medical Nutrition
- 3.1.9 Meat/Poultry/Seafood and Meat Alternative Products
- 3.1.10 RTE/RTC Food Products
- 3.1.11 Snacks
- 3.1.12 Sport/Performance Nutrition
- 3.1.13 Animal Feed
- 3.1.14 Personal Care and Cosmetics
- 3.2 Protein Consumption Trends
- 3.2.1 Animal
- 3.3 Production Trends
- 3.3.1 Animal
- 3.4 Regulatory Framework
- 3.4.1 Australia
- 3.4.2 Canada
- 3.4.3 China
- 3.4.4 France
- 3.4.5 Germany
- 3.4.6 India
- 3.4.7 Italy
- 3.4.8 Japan
- 3.4.9 United Kingdom
- 3.4.10 United States
- 3.5 Value Chain & Distribution Channel Analysis
4 MARKET SEGMENTATION (includes market size in Value in USD and Volume, Forecasts up to 2030 and analysis of growth prospects)
- 4.1 Form
- 4.1.1 Concentrates
- 4.1.2 Hydrolyzed
- 4.1.3 Isolates
- 4.2 End User
- 4.2.1 Animal Feed
- 4.2.2 Food and Beverages
- 4.2.2.1 By Sub End User
- 4.2.2.1.1 Bakery
- 4.2.2.1.2 Beverages
- 4.2.2.1.3 Breakfast Cereals
- 4.2.2.1.4 Condiments/Sauces
- 4.2.2.1.5 Dairy and Dairy Alternative Products
- 4.2.2.1.6 RTE/RTC Food Products
- 4.2.2.1.7 Snacks
- 4.2.3 Personal Care and Cosmetics
- 4.2.4 Supplements
- 4.2.4.1 By Sub End User
- 4.2.4.1.1 Baby Food and Infant Formula
- 4.2.4.1.2 Elderly Nutrition and Medical Nutrition
- 4.2.4.1.3 Sport/Performance Nutrition
- 4.3 Region
- 4.3.1 Africa
- 4.3.1.1 By Form
- 4.3.1.2 By End User
- 4.3.1.3 By Country
- 4.3.1.3.1 Nigeria
- 4.3.1.3.2 South Africa
- 4.3.1.3.3 Rest of Africa
- 4.3.2 Asia-Pacific
- 4.3.2.1 By Form
- 4.3.2.2 By End User
- 4.3.2.3 By Country
- 4.3.2.3.1 Australia
- 4.3.2.3.2 China
- 4.3.2.3.3 India
- 4.3.2.3.4 Indonesia
- 4.3.2.3.5 Japan
- 4.3.2.3.6 Malaysia
- 4.3.2.3.7 New Zealand
- 4.3.2.3.8 South Korea
- 4.3.2.3.9 Thailand
- 4.3.2.3.10 Vietnam
- 4.3.2.3.11 Rest of Asia-Pacific
- 4.3.3 Europe
- 4.3.3.1 By Form
- 4.3.3.2 By End User
- 4.3.3.3 By Country
- 4.3.3.3.1 Belgium
- 4.3.3.3.2 France
- 4.3.3.3.3 Germany
- 4.3.3.3.4 Italy
- 4.3.3.3.5 Netherlands
- 4.3.3.3.6 Russia
- 4.3.3.3.7 Spain
- 4.3.3.3.8 Turkey
- 4.3.3.3.9 United Kingdom
- 4.3.3.3.10 Rest of Europe
- 4.3.4 Middle East
- 4.3.4.1 By Form
- 4.3.4.2 By End User
- 4.3.4.3 By Country
- 4.3.4.3.1 Iran
- 4.3.4.3.2 Saudi Arabia
- 4.3.4.3.3 United Arab Emirates
- 4.3.4.3.4 Rest of Middle East
- 4.3.5 North America
- 4.3.5.1 By Form
- 4.3.5.2 By End User
- 4.3.5.3 By Country
- 4.3.5.3.1 Canada
- 4.3.5.3.2 Mexico
- 4.3.5.3.3 United States
- 4.3.5.3.4 Rest of North America
- 4.3.6 South America
- 4.3.6.1 By Form
- 4.3.6.2 By End User
- 4.3.6.3 By Country
- 4.3.6.3.1 Argentina
- 4.3.6.3.2 Brazil
- 4.3.6.3.3 Rest of South America
- 4.3.1 Africa
5 COMPETITIVE LANDSCAPE
- 5.1 Key Strategic Moves
- 5.2 Market Share Analysis
- 5.3 Company Landscape
- 5.4 Company Profiles (includes Global Level Overview, Market Level Overview, Core Business Segments, Financials, Headcount, Key Information, Market Rank, Market Share, Products and Services, and Analysis of Recent Developments).
- 5.4.1 Agropur Dairy Cooperative
- 5.4.2 Arla Foods AMBA
- 5.4.3 Fonterra Co-operative Group Limited
- 5.4.4 Glanbia PLC
- 5.4.5 Groupe LACTALIS
- 5.4.6 Hilmar Cheese Company, Inc.
- 5.4.7 Kerry Group PLC
- 5.4.8 Lacto Japan Co., Ltd.
- 5.4.9 Royal FrieslandCampina NV
- 5.4.10 Saputo Inc
6 KEY STRATEGIC QUESTIONS FOR PROTEIN INGREDIENTS INDUSTRY CEOS
7 APPENDIX
- 7.1 Global Overview
- 7.1.1 Overview
- 7.1.2 Porter's Five Forces Framework
- 7.1.3 Global Value Chain Analysis
- 7.1.4 Market Dynamics (DROs)
- 7.2 Sources & References
- 7.3 List of Tables & Figures
- 7.4 Primary Insights
- 7.5 Data Pack
- 7.6 Glossary of Terms

