
インドの生物農薬:市場シェア分析、産業動向と統計、成長予測(2025年~2030年)
India Biopesticides - Market Share Analysis, Industry Trends & Statistics, Growth Forecasts (2025 - 2030)- 発行日
- ページ情報
- 英文 129 Pages
- 納期
- 2~3営業日
- 商品コード
- 1690954
- カスタマイズ可能 お客様のご希望に応じて、既存データの加工や未掲載情報(例:国別セグメント)の追加などの対応が可能です。詳細はお問い合わせください。
- 適宜更新あり 本レポートは最新情報反映のため適宜更新し、内容構成変更を行う場合があります。ご検討の際はお問い合わせください。
- 翻訳ツール提供対象 PDF対応AI翻訳ツールの無料貸し出しサービスのご利用が可能です
概要
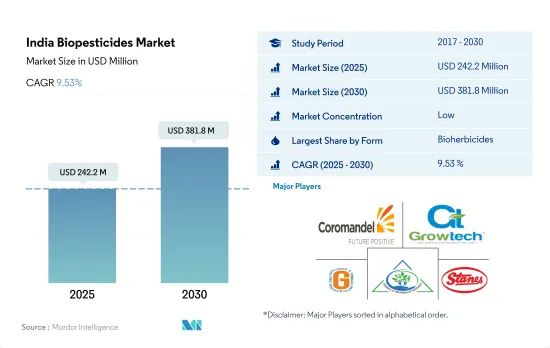
インドの生物農薬市場規模は2025年に2億4,220万米ドルと推定され、2030年には3億8,180万米ドルに達し、予測期間(2025~2030年)のCAGRは9.53%で成長すると予測されます。
- 合成植物保護剤の使用に伴う環境への悪影響に対する社会的懸念の高まりにより、害虫駆除のための生物学的プロセスによる技術や製品の探求が促されています。
- 227種類の生物農薬のうち、インドで登録されている農薬はわずか15種類です。ニームベースの農薬、バチルス・チューリンゲンシス、核多角体ウイルス、トリコデルマは、インドで生産・使用されている主要な生物農薬の一部です。
- 生物農薬は殺虫剤法(1968年)に該当します。中央殺虫剤委員会(CIB)と登録委員会(RC)は、この法律の下にある2つの「強力な」機関です。CIBは最高諮問機関です。CIBは関係するあらゆるセグメント・領域の著名な科学者で構成されています。RCは、配合を精査し、ヒトや動物に対する生物学的有効性と安全性の主張を検証した上で、殺虫剤の輸入や製造の登録を許可します。
- インドでは、農業・農業従事者福祉省、バイオテクノロジー局(DBT)、科学技術省など複数の政府機関が生物農薬の研究・開発・商業化を推進しています。
- インドにおける農薬の平均消費量は1ha当たり約570gmで、日本、タイ、ドイツなどの先進諸国ではそれぞれ11kg、17kg、3kgです。インドにおける農薬の平均使用量は少ないが、無差別使用や質の低い維持管理による被害は憂慮すべきものです。金額で見ると、農薬散布の多くは一部の作物で占められています。例えば、綿花、水稲、野菜がインドにおける農薬散布額の80%を占めています。
インドの生物農薬市場動向
有機生産者の増加が、主に連作作物における有機栽培面積の増加を後押し
- インドは、認証オーガニック生産者の総数では世界最大の国であり、2019年のオーガニック生産者数は130万人です。多くの有機生産者がいるにもかかわらず、同国の有機栽培面積は同国の農業総面積の2.0%程度です。2021年には、同国の有機栽培面積は71万1,094.0ヘクタールと記録され、2017年と比較して約3.4%増加しました。国内の有機農業は一部の州に集中しています。国内の有機農業上位10州が有機作物総面積の約80.0%を占めています。マディヤ・プラデシュ州、ラジャスタン州、マハラシュトラ州のように、有機農業の普及率向上でリードしている州は少数です。マディヤ・プラデシュ州だけで2019年のインドの有機栽培面積の約27.0%を占めています。
- 同国では連作作物の有機栽培が優勢で、2021年には有機作物総栽培面積の約59.7%を占めました。穀物生産は米、小麦、雑穀、トウモロコシが主です。ほとんどの穀類作物はカリフ期(6月~9月)に栽培されます。この時期に栽培される作物は、主に雨に左右されるか、稲、トウモロコシ、綿花、大豆のように多くの水を必要とします。
- 有機換金作物全体の栽培面積は、2017年の27万ヘクタールから2021年には28万ヘクタールに増加します。同国で生産される主要換金作物は、綿花、サトウキビ、紅茶、スパイスです。同国では現在、有機園芸作物の成長は限られています。有機製品に対する需要の高まりとインド政府の有機栽培への取り組みにより、2023~2029年にかけて有機作物の栽培面積が増加すると予想されます。
需要の高まりとeコマース・チャネルによる入手の容易さにより、有機食品への1人当たり支出が増加
- インドのオーガニック製品に対する1人当たり支出は0.23米ドルと、アジア太平洋のオーガニック製品に対する1人当たり支出の平均と比べると比較的低いです。しかし近年は、オーガニック製品は免疫力が高く、品質が高く、eコマース・チャネルを通じて入手しやすいと認識する顧客が増えたため、消費者の需要がオーガニック製品へとシフトしています。インドは有機食品と飲食品の有望な市場です。インド国内の有機飲食品産業は、2019~2024年にかけてCAGR13%で上昇し、2024年までに1億3,800万米ドルの規模になると予想されています。
- 2022年に国内で消費された有機飲食品の合計は1億800万米ドル相当でした。同国における有機製品の消費額は、2016年の4,500万米ドルから2021年には9,600万米ドルに増加しました。オーガニック食品の販売動向は、主に消費者意識の高まりにより増加傾向にあり、高所得の消費者がオーガニック飲食品の消費を促進しています。最も需要を獲得したカテゴリーには、有機卵、乳製品、果物・野菜などの必須食品が含まれます。
- 有機飲料消費が市場を独占し、2022年の有機食品と有機飲料の合計市場金額の約85.2%を占めました。有機飲料セグメントには、承認された認証機関によって認証された有機包装飲食品が含まれます。有機飲料の消費額は2020~2022年にかけてCAGR 14%で増加しました。有機製品に関連する価格プレミアムは、低所得層の消費者のアクセスを妨げ、有機食品消費の主要制限要因となっています。しかし、有機製品の積極的なプロモーションと利点が、予測期間中の有機食品市場を牽引します。
インドの生物農薬産業概要
インドの生物農薬市場はセグメント化されており、上位5社で9.83%を占めています。
その他の特典
- エクセル形式の市場予測(ME)シート
- 3ヶ月のアナリストサポート
目次
第1章 エグゼクティブサマリーと主要調査結果
第2章 レポートのオファー
第3章 イントロダクション
- 調査の前提条件と市場定義
- 調査範囲
- 調査手法
第4章 主要産業動向
- 有機栽培面積
- 一人当たりのオーガニック製品への支出
- 規制の枠組み
- インド
- バリューチェーンと流通チャネル分析
第5章 市場セグメンテーション
- 形態
- バイオ殺菌剤
- バイオ除草剤
- バイオ殺虫剤
- その他の生物農薬
- 作物タイプ
- 換金作物
- 園芸作物
- 耕作作物
第6章 競争情勢
- 主要な戦略的動き
- 市場シェア分析
- 企業情勢
- 企業プロファイル
- Andermatt Group AG
- Central BIoTech Private Limited
- Coromandel International Ltd
- GrowTech Agri Science Private Limited
- Gujarat State Fertilizers & Chemicals Ltd
- IPL Biologicals Limited
- Jaipur Bio Fertilizers
- Samriddhi Crops India Pvt. Ltd
- T.Stanes and Company Limited
- Volkschem Crop Science Private Limited
第7章 CEOへの主要戦略的質問
第8章 付録
- 世界概要
- 概要
- ファイブフォース分析フレームワーク
- 世界のバリューチェーン分析
- 市場力学(DROs)
- 情報源と参考文献
- 図表一覧
- 主要な洞察
- データパック
- 用語集
目次
Product Code: 72612
The India Biopesticides Market size is estimated at 242.2 million USD in 2025, and is expected to reach 381.8 million USD by 2030, growing at a CAGR of 9.53% during the forecast period (2025-2030).
- The increased public concerns about the probable adverse environmental effects associated with the use of synthetic plant protection products prompt the search for technologies and products based on biological processes to control pests.
- Out of 227 types of biopesticides, only 15 are pesticides registered in India. Neem-based pesticides, Bacillus thuringiensis, Nuclear Polyhedrosis virus, and Trichoderma are some of the major biopesticides produced and used in India.
- Biopesticides fall under the Insecticide Act (1968). Central Insecticides Board (CIB) and the Registration Committee (RC) are two "high-powered" bodies under this Act. CIB is the apex advisory. It comprises eminent scientists of all disciplines/fields concerned. The RC grants registrations to import or manufacture insecticides after scrutinizing the formulae and verifying claims of bio-efficacy and safety to human beings and animals.
- In India, several government agencies, such as the Ministry of Agriculture and Farmers Welfare, the Department of Biotechnology (DBT), and the Ministry of Science and Technology, have been promoting the research, development, and commercialization of biopesticides.
- The average consumption of pesticides in India is about 570 gm per ha. as compared to developed countries, like Japan, Thailand, and Germany, where the consumption rate is 11 kg, 17 kg, and 3 kg per ha, respectively. Though the average quantum of pesticide usage in India is low, the damage caused due to their indiscriminate usage and poor quality maintenance is alarming. In terms of value, much of the pesticide application is accounted for by a few crops. For example, cotton, paddy and vegetable crops account for 80% of the value of pesticides applied in India.
India Biopesticides Market Trends
Growing number of organic producers helping the increase in area under organic cultivation, primarily in row crops
- India is the largest country, in terms of the total number of certified organic producers in the world, with 1.3 million organic producers in 2019. Despite having a large number of organic producers, organic cultivation areas in the country account for around 2.0% of the total agriculture area in the country. In 2021, the organic area in the country was recorded as 711,094.0 hectares, which increased by about 3.4% compared to 2017. Organic farming in the country is concentrated in only a few states. The top ten organic farming states in the country account for about 80.0% of the total organic crop area. A few states have taken the lead in improving organic farming coverage, like Madhya Pradesh, Rajasthan, and Maharashtra, which are the top three organic farming states in the country. Madhya Pradesh alone accounted for about 27.0% of India's total organic cultivation area in 2019.
- Organic cultivation of row crops is dominant in the country, which accounted for about 59.7% of the total organic crop area in 2021. Cereal crop production is dominant rice, wheat, millet, and maize are the major cereals produced. Most cereal crops are grown in the kharif season (June - September). The crops grown in this season are mainly rain dependent or require more water, like rice, maize, cotton, and soybean.
- The overall organic cash crop cultivation area increased from 0.27 million hectares in 2017 to 0.28 million hectares in 2021. The major cash crops produced in the country are cotton, sugarcane, tea, and spices. There is a limited growth of organic horticultural crops currently in the country. The increasing demand for organic products and Indian government initiatives to go organic are anticipated to increase organic crop area between 2023 and 2029.
Growing demand and their easy accessibility through e-commerce channels, rising the per capita spending on organic food
- India's per capita spending on organic products is relatively low at USD 0.23 compared to the average per capita spending on organic products in Asia-Pacific. However, in recent years, shifting consumer demand has increased toward organic products as more customers perceive these items offer better immunity, higher quality, and more accessibility through e-commerce channels. India is a promising and developing market for organic foods and beverages. India's domestic organic food and beverage industry is expected to be worth USD 138.0 million by 2024, rising at a compound annual growth rate of 13% between 2019 to 2024.
- In 2022, the total combined organic food and beverages worth USD 108.0 million consumed in the country. The consumption value of organic products in the country increased from USD 45 million in 2016 to USD 96.0 million in 2021. Organic food sales have seen an increasing trend mainly due to increasing consumer awareness, and high-income consumers are propelling organic food and beverage consumption. Categories that gained the most demand included essential foods, such as organic eggs, dairy, and fruits and vegetables.
- Organic beverage consumption dominated the market and accounted for about 85.2% of the total combined organic food and beverages market value in 2022. The organic beverages segment includes organic packaged food and beverages that are certified by the approved certification body. Organic beverage consumption value increased at a CAGR of 14% between 2020 to 2022. The price premium associated with organic products hampers lower-income consumer access and is the major limiting factor for organic food consumption. However, organic products' active promotion and advantages drive the organic food market during the forecast period.
India Biopesticides Industry Overview
The India Biopesticides Market is fragmented, with the top five companies occupying 9.83%. The major players in this market are Coromandel International Ltd, GrowTech Agri Science Private Limited, Gujarat State Fertilizers & Chemicals Ltd, IPL Biologicals Limited and T.Stanes and Company Limited (sorted alphabetically).
Additional Benefits:
- The market estimate (ME) sheet in Excel format
- 3 months of analyst support
TABLE OF CONTENTS
1 EXECUTIVE SUMMARY & KEY FINDINGS
2 REPORT OFFERS
3 INTRODUCTION
- 3.1 Study Assumptions & Market Definition
- 3.2 Scope of the Study
- 3.3 Research Methodology
4 KEY INDUSTRY TRENDS
- 4.1 Area Under Organic Cultivation
- 4.2 Per Capita Spending On Organic Products
- 4.3 Regulatory Framework
- 4.3.1 India
- 4.4 Value Chain & Distribution Channel Analysis
5 MARKET SEGMENTATION (includes market size in Value in USD and Volume, Forecasts up to 2030 and analysis of growth prospects)
- 5.1 Form
- 5.1.1 Biofungicides
- 5.1.2 Bioherbicides
- 5.1.3 Bioinsecticides
- 5.1.4 Other Biopesticides
- 5.2 Crop Type
- 5.2.1 Cash Crops
- 5.2.2 Horticultural Crops
- 5.2.3 Row Crops
6 COMPETITIVE LANDSCAPE
- 6.1 Key Strategic Moves
- 6.2 Market Share Analysis
- 6.3 Company Landscape
- 6.4 Company Profiles (includes Global Level Overview, Market Level Overview, Core Business Segments, Financials, Headcount, Key Information, Market Rank, Market Share, Products and Services, and Analysis of Recent Developments).
- 6.4.1 Andermatt Group AG
- 6.4.2 Central Biotech Private Limited
- 6.4.3 Coromandel International Ltd
- 6.4.4 GrowTech Agri Science Private Limited
- 6.4.5 Gujarat State Fertilizers & Chemicals Ltd
- 6.4.6 IPL Biologicals Limited
- 6.4.7 Jaipur Bio Fertilizers
- 6.4.8 Samriddhi Crops India Pvt. Ltd
- 6.4.9 T.Stanes and Company Limited
- 6.4.10 Volkschem Crop Science Private Limited
7 KEY STRATEGIC QUESTIONS FOR AGRICULTURAL BIOLOGICALS CEOS
8 APPENDIX
- 8.1 Global Overview
- 8.1.1 Overview
- 8.1.2 Porter's Five Forces Framework
- 8.1.3 Global Value Chain Analysis
- 8.1.4 Market Dynamics (DROs)
- 8.2 Sources & References
- 8.3 List of Tables & Figures
- 8.4 Primary Insights
- 8.5 Data Pack
- 8.6 Glossary of Terms
インドの生物農薬:市場シェア分析、産業動向と統計、成長予測(2025年~2030年)
- 発行日
- 発行
- Mordor Intelligence
- ページ情報
- 英文 129 Pages
- 納期
- 2~3営業日