
|
市場調査レポート
商品コード
1687295
アジア太平洋地域のチョコレート:市場シェア分析、産業動向・統計、成長予測(2025年~2030年)Asia Pacific Chocolate - Market Share Analysis, Industry Trends & Statistics, Growth Forecasts (2025 - 2030) |
||||||
カスタマイズ可能
適宜更新あり
|
|||||||
| アジア太平洋地域のチョコレート:市場シェア分析、産業動向・統計、成長予測(2025年~2030年) |
|
出版日: 2025年03月18日
発行: Mordor Intelligence
ページ情報: 英文 215 Pages
納期: 2~3営業日
|

全表示
- 概要
- 目次
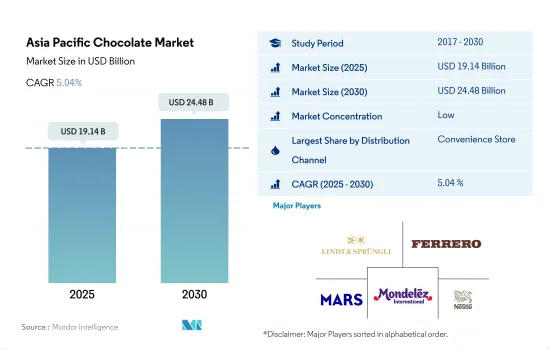
アジア太平洋地域のチョコレート市場規模は2025年に191億4,000万米ドルと推定・予測され、2030年には244億8,000万米ドルに達し、予測期間(2025-2030年)のCAGRは5.04%で成長すると予測されます。
コンビニエンス・ショッピング志向の高まりにより、スーパーマーケット/ハイパーマーケットとコンビニエンス・ストアが2023年に70%のシェアを占め、セグメント価値が上昇しました。
- アジア太平洋地域地域では、小売事業全体が2023年に2022年比で数量ベースで4.59%の成長を維持しました。この成長は、消費者のコンビニエンス・ショッピング施設に対する志向の高まりによって予想されます。小売業全体では、コンビニエンスストアが2023年に数量ベースで最大の小売部門となりました。中国の有名店には、Easy Joy、uSmile、MYJなどがあります。2025年までに、アジア太平洋地域のコンビニエンスストア部門は数量ベースで4.48%の成長を記録すると推定されます。
- スーパーマーケットとハイパーマーケットは、アジア太平洋地域のチョコレート市場で2番目に大きな小売業者です。これらの店舗は、革新的なオファーとともに幅広いチョコレート製品を顧客に提供する傾向があります。スーパーマーケットとハイパーマーケットにおけるチョコレート製品の販売量は、2021年と比較して2022年には4.22%増加したと報告されています。アジア太平洋地域では2023年から2029年にかけて19.7%のCAGRが見込まれています。チョコレートは、2023年にスーパーマーケットとハイパーマーケットを通じて販売される菓子類全体の中で58.8%の最大シェアを占めており、プレミアム化への需要の高まりが予想されます。
- オンライン小売またはeコマース小売は、アジア太平洋地域で最も急成長している小売セグメントと考えられています。eコマース事業の2023年のCAGRは5.92%です。この地域全体のインターネット利用者数の増加が、eコマース・ウェブサイトの成長加速に影響を与えている主な要因です。
- 予測期間中、アジア太平洋地域地域のこれらの小売部門は数量シェアで8.21%の成長を記録すると推定されます。菓子類におけるエーテル系フレーバーの利用可能性の高まりと、ディスカウント・オファーへの需要が小売業界を牽引すると思われます。
日本とインドは、革新的なプレミアムチョコレートへの注目の高まりとともに、金額ベースでほぼ50%のシェアを占め、同地域のチョコレート消費を牽引しました。
- レビュー期間中、市場のプレミアムおよびスーパープレミアム・セグメントは、透明性の高い調達や、特別感を提供する希少な原料の採用といった動向により成長してきました。さらに、ユニークなプレミアム・チョコレート製品の革新に注力してきたチョコレート製造業者の数が増加していることと、新しい製品を試したいという消費者の欲求が高まっていることも、市場のこのセグメントの成長を牽引しています。金額ベースでは、アジア太平洋地域チョコレート市場は2021年と比較して2022年には4.16%の成長を観察しました。
- 日本と中国がこの地域の主要市場であり、インドとオーストラリアがこれに続きます。日本と中国は合計で2022年のチョコレート販売額の52.02%を占めています。これらの国の消費者は、チョコレートをエキゾチックな珍味とみなしており、旧正月には贅沢なお菓子として贈答品としても持参されます。そのため、チョコレートの消費は増加しています。中国は2021年に約6億7,330万米ドル相当のチョコレート菓子類を輸入するが、2020年には4億8,577万米ドルでした。
- マレーシアはアジア太平洋地域で最も急成長しているチョコレート市場です。同市場は、金額ベースで2024年から2030年にかけて8.53%の成長率が見込まれています。同国では、蜂蜜、砂糖、アーモンド、クルミ、結晶化した果物などの材料を組み合わせたレシピで菓子類を消費する伝統的なアプローチがあります。糖尿病人口の一貫した増加により、砂糖不使用やグルテン不使用のチョコレートなど、健康志向の消費者にアピールするチョコレートが全国的に人気を集めています。2021年、マレーシアの糖尿病有病率は19.2%(20~79歳人口の割合)に達しました。
アジア太平洋地域チョコレート市場動向
伝統的なお菓子よりもチョコレートへの消費者の傾倒が、アジア諸国におけるチョコレートの売上を増加させる主な要因の一つである
- アジア太平洋地域におけるチョコレート消費は、欧米のチョコレート消費習慣と比較すると限定的です。しかし、特にアジア太平洋地域、中国、インドは、欧米のライフスタイルの影響力の増大とチョコレートの健康効果に対する意識の高まりにより、市場で最も急成長している国のひとつになる可能性が高いです。
- フェアトレードチョコレートの需要と風味の革新は、長年にわたって市場を押し進める主要動向となることが予想されます。ミルク・チョコレートは市場で絶大な人気を誇るが、ダーク・チョコレートやコンパウンド・チョコレートの販売も大きく伸びています。
- 伝統的に、この地域の一部のチョコレートは、市場では高級でプレミアムな菓子類とみなされています。チョコレートの製造に使用される原材料のコストが高いため、この地域のチョコレート全体の価格が高くなっています。市場の平均的なチョコレート・バーの価格は2~20米ドルです。
- チョコレート、特にダークチョコレートには健康上の利点があるため、消費者は菓子類でもより健康的な代替品を求めています。インドは、この地域でも有数のチョコレート消費国です。2022年には、インド人の44%近くが、より健康的なチョコレートにプレミアムを支払うことを望んでいます。
アジア太平洋地域チョコレート産業の概要
アジア太平洋地域チョコレート市場は断片化されており、上位5社で38.91%を占めています。この市場の主要企業は以下の通り。 Chocoladefabriken Lindt & Sprungli AG, Ferrero International SA, Mars Incorporated, Mondelez International Inc. and Nestle SA(sorted alphabetically).
その他の特典
- エクセル形式の市場予測(ME)シート
- 3ヶ月間のアナリストサポート
目次
第1章 エグゼクティブサマリーと主な調査結果
第2章 レポートのオファー
第3章 イントロダクション
- 調査の前提条件と市場定義
- 調査範囲
- 調査手法
第4章 主要産業動向
- 規制の枠組み
- 消費者の購買行動
- 成分分析
- バリューチェーンと流通チャネル分析
第5章 市場セグメンテーション
- 菓子類
- ダークチョコレート
- ミルクチョコレートとホワイトチョコレート
- 流通チャネル
- コンビニエンスストア
- オンラインストア
- スーパーマーケット/ハイパーマーケット
- その他
- 国
- オーストラリア
- 中国
- インド
- インドネシア
- 日本
- マレーシア
- ニュージーランド
- 韓国
- その他アジア太平洋地域地域
第6章 競合情勢
- 主要な戦略動向
- 市場シェア分析
- 企業情勢
- 企業プロファイル
- Atypic Chocolate Pty Ltd
- Barry callebaut AG
- Chocoladefabriken Lindt & Sprungli AG
- Ferrero International SA
- Gujarat Co-operative Milk Marketing Federation Ltd.
- ITC Limited
- Mars Incorporated
- Meiji Holdings Company Ltd
- Mondelez International Inc.
- Morinaga & Co. LTD
- Nestle SA
- Reliance Industries Ltd
- ROYCE'Confect Co. Ltd
- The Hershey Company
- Yuraku Confectionery Co. Ltd
- YIldIz Holding AS
第7章 CEOへの主な戦略的質問
第8章 付録
- 世界概要
- 概要
- ファイブフォース分析フレームワーク
- 世界のバリューチェーン分析
- 市場力学(DROs)
- 情報源と参考文献
- 図表一覧
- 主要洞察
- データパック
- 用語集
The Asia Pacific Chocolate Market size is estimated at 19.14 billion USD in 2025, and is expected to reach 24.48 billion USD by 2030, growing at a CAGR of 5.04% during the forecast period (2025-2030).
Growing inclination toward convenience shopping inclined the segmental value with supermarket/ hypermarkets and convenience stores holding 70% share in 2023
- In the Asia-Pacific region, the overall retailing segment maintained a growth of 4.59% by volume in 2023 as compared to 2022. The growth is anticipated with the consumers' growing inclination for convenience shopping facilities. Under the overall retailing segment, the convenience store segment was considered the largest retailing unit by volume in 2023. Some of the famous stores in China are Easy Joy, uSmile, MYJ, and others. By 2025, the convenience store segment in Asia-Pacific is estimated to register a growth of 4.48% by volume.
- Supermarkets and hypermarkets are the second-largest retailers in the Asia-Pacific chocolate market. These stores tend to offer their customers a wide range of chocolate products with innovative offers. It is reported that the sales volume of chocolate products in supermarkets and hypermarkets grew by 4.22% in 2022 compared to 2021. A CAGR of 19.7% is anticipated to be registered in Asia-Pacific during 2023-2029. Chocolate holds the largest share of 58.8% among all the confectionery products sold through supermarkets and hypermarkets in 2023, anticipated with growing demand for premiumization.
- Online retailing or e-commerce retailing is considered the fastest-growing retailing segment in Asia-Pacific. The e-commerce business was holding a CAGR of 5.92% in 2023. The growing number of internet users across the region is the major factor influencing the acceleration of the growth of e-commerce websites.
- During the forecast period, it is estimated that these retailing units in Asia-Pacific will mark growth of 8.21% by volume share. The rising availability of ethenic flavors for confectionery products and demand for discount offers will likely drive the retail industry.
Japan and India drove the chocolate consumption in the region with the share of almost 50% by value with increasing focus on innovative premium chocolates
- Over the review period, the premium and super-premium segments of the market have been growing due to trends such as transparent sourcing and the incorporation of rare ingredients that offer a sense of exclusivity. Additionally, the growth of this segment of the market is being driven by the growing number of chocolate producers that have been focused on innovating unique premium chocolate products, coupled with increased consumer desire to try new products. By value, the Asia-Pacific chocolate market observed a growth of 4.16% in 2022 as compared to 2021.
- Japan and China are identified as the major markets in the region, followed by India and Australia. Japan and China collectively accounted for 52.02% of the chocolate value sales in 2022. Consumers across these countries consider chocolate an exotic delicacy, which is also brought as a luxury gift during the Lunar New Year as a luxurious treat. Thus, the consumption of chocolate has increased. China imported approximately USD 673.3 million worth of chocolate confectionery in 2021, while it was USD 485.77 million in 2020.
- Malaysia is identified as the fastest-growing chocolate market in Asia-Pacific. The market is anticipated to grow at a rate of 8.53% from 2024-2030 in terms of value. The country has a traditional approach toward the consumption of confectionery, where the recipes combine ingredients such as honey, sugar, almonds, walnuts, or crystallized fruits. Chocolates that appeal to health-oriented consumers, such as sugar-free or gluten-free chocolates, are becoming popular across the country due to the consistently increasing diabetic population. In 2021, diabetes prevalence in the country reached 19.2% (% of the population ages 20 to 79) in Malaysia.
Asia Pacific Chocolate Market Trends
Consumer inclination toward chocolates over traditional sweets is one of the major factors that increase the sales of chocolates in Asian countries
- Chocolate consumption in Asia-Pacific is limited when compared to Western chocolate consumption practices. However, Asia Pacific, China, and India, in particular, are likely to be some of the fastest-growing countries in the market due to the increased influence of the Western lifestyle and rising awareness of the health benefits of chocolate.
- The demand for fair trade chocolates and innovations in flavor is expected to be the key trends that push the market forward over the years. Although milk chocolate is hugely popular in the market, there is also a significant growth in the sale of dark and compound chocolate because of its longer flavor release, making it the first choice for many nowadays.
- Traditionally, chocolates in some parts of the region are considered luxury and premium confectionery in the market. The high cost of the raw materials used in the production of chocolate increases the overall price of the chocolates in the region. An average chocolate bar in the market costs between USD 2 and USD 20.
- Due to the health benefits associated with chocolates, especially dark chocolates, consumers are seeking healthier alternatives even in confectionery products. India is one of the leading chocolate-consuming countries in the region. In 2022, nearly 44% of Indians are willing to pay a premium for healthier chocolates.
Asia Pacific Chocolate Industry Overview
The Asia Pacific Chocolate Market is fragmented, with the top five companies occupying 38.91%. The major players in this market are Chocoladefabriken Lindt & Sprungli AG, Ferrero International SA, Mars Incorporated, Mondelez International Inc. and Nestle SA (sorted alphabetically).
Additional Benefits:
- The market estimate (ME) sheet in Excel format
- 3 months of analyst support
TABLE OF CONTENTS
1 EXECUTIVE SUMMARY & KEY FINDINGS
2 REPORT OFFERS
3 INTRODUCTION
- 3.1 Study Assumptions & Market Definition
- 3.2 Scope of the Study
- 3.3 Research Methodology
4 KEY INDUSTRY TRENDS
- 4.1 Regulatory Framework
- 4.2 Consumer Buying Behavior
- 4.3 Ingredient Analysis
- 4.4 Value Chain & Distribution Channel Analysis
5 MARKET SEGMENTATION (includes market size in Value in USD and Volume, Forecasts up to 2030 and analysis of growth prospects)
- 5.1 Confectionery Variant
- 5.1.1 Dark Chocolate
- 5.1.2 Milk and White Chocolate
- 5.2 Distribution Channel
- 5.2.1 Convenience Store
- 5.2.2 Online Retail Store
- 5.2.3 Supermarket/Hypermarket
- 5.2.4 Others
- 5.3 Country
- 5.3.1 Australia
- 5.3.2 China
- 5.3.3 India
- 5.3.4 Indonesia
- 5.3.5 Japan
- 5.3.6 Malaysia
- 5.3.7 New Zealand
- 5.3.8 South Korea
- 5.3.9 Rest of Asia-Pacific
6 COMPETITIVE LANDSCAPE
- 6.1 Key Strategic Moves
- 6.2 Market Share Analysis
- 6.3 Company Landscape
- 6.4 Company Profiles
- 6.4.1 Atypic Chocolate Pty Ltd
- 6.4.2 Barry callebaut AG
- 6.4.3 Chocoladefabriken Lindt & Sprungli AG
- 6.4.4 Ferrero International SA
- 6.4.5 Gujarat Co-operative Milk Marketing Federation Ltd.
- 6.4.6 ITC Limited
- 6.4.7 Mars Incorporated
- 6.4.8 Meiji Holdings Company Ltd
- 6.4.9 Mondelez International Inc.
- 6.4.10 Morinaga & Co. LTD
- 6.4.11 Nestle SA
- 6.4.12 Reliance Industries Ltd
- 6.4.13 ROYCE' Confect Co. Ltd
- 6.4.14 The Hershey Company
- 6.4.15 Yuraku Confectionery Co. Ltd
- 6.4.16 YIldIz Holding AS
7 KEY STRATEGIC QUESTIONS FOR CONFECTIONERY CEOS
8 APPENDIX
- 8.1 Global Overview
- 8.1.1 Overview
- 8.1.2 Porter's Five Forces Framework
- 8.1.3 Global Value Chain Analysis
- 8.1.4 Market Dynamics (DROs)
- 8.2 Sources & References
- 8.3 List of Tables & Figures
- 8.4 Primary Insights
- 8.5 Data Pack
- 8.6 Glossary of Terms

