
|
市場調査レポート
商品コード
1910446
レディーミクストコンクリート:市場シェア分析、業界動向と統計、成長予測(2026年~2031年)Ready Mix Concrete - Market Share Analysis, Industry Trends & Statistics, Growth Forecasts (2026 - 2031) |
||||||
カスタマイズ可能
適宜更新あり
|
|||||||
| レディーミクストコンクリート:市場シェア分析、業界動向と統計、成長予測(2026年~2031年) |
|
出版日: 2026年01月12日
発行: Mordor Intelligence
ページ情報: 英文 120 Pages
納期: 2~3営業日
|

概要
レディーミクストコンクリート市場は、2025年に54億7,000万立方メートルと評価され、2026年の57億3,000万立方メートルから2031年までに72億2,000万立方メートルに達すると予測されています。
予測期間(2026-2031年)におけるCAGRは4.73%と見込まれます。
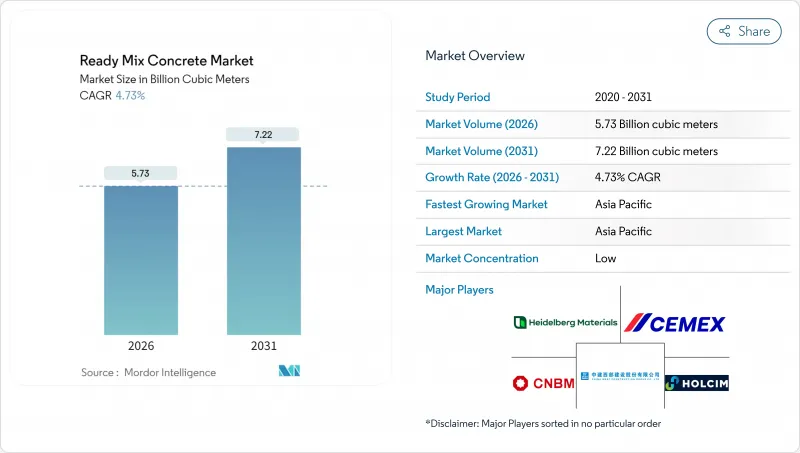
アジア太平洋地域および北米における堅調な公共セクターのパイプラインがこの数量成長を支えております。一方、デジタル配車プラットフォームとテレマティクス技術は、車両の生産性向上、配送のばらつきの低減、サプライヤーの利益率強化に寄与しております。インフラ支出に政府がコンプライアンス要件を課すことから、クリンカーをセメント補助材で代替する低炭素配合設計が注目を集めております。2019年以降の原材料価格高騰により生産者の利益幅は縮小しましたが、骨材やセメントへの遡及統合(バックワード・インテグレーション)を実施し、リアルタイム品質監視を導入するサプライヤーはより健全な収益を維持しています。同時に、クイークリート・サミット(Quikrete-Summit)やCRHの地域資産買収などの合併は、規模の経済と地理的密度がレディーミクストコンクリート市場において依然として重要な要素であることを示しています。
世界のレディーミクストコンクリート市場の動向と洞察
急速な都市化と住宅需要
インド、インドネシア、ベトナムにおける急速な都市人口増加は、依然として大規模な住宅供給不足を引き起こしています。開発業者は、強度均一性、進化する建築基準への適合性、プロジェクトサイクルの短縮化から、オフサイトバッチコンクリートを好んで採用しています。中国の不動産セクターには過剰供給が存在しますが、工場建設や物流ハブは依然として相当量のコンクリートを消費しており、地域の変動を緩和しています。これらの要因が相まって、レディーミクストコンクリート市場の需要拡大は、今後10年間にわたって持続すると見込まれます。
政府による大規模インフラ計画
複数年にわたる予算の確約により、生産者は生産能力の増強を承認できる見通しが得られます。米国は2024年に交通インフラ建設に2,140億米ドルを割り当て、インドの国家インフラ計画では高速道路から再生可能エネルギー発電まで7,400件のプロジェクトをカバーしています。インドネシアやオーストラリアでも同様の計画が長期的な需要を確保しており、住宅市場の低迷期においてもプラント稼働率が損益分岐点以上を維持することを保証しています。
原材料価格の変動性
2019年以降、セメント価格は38%、骨材は31%上昇し、契約構造による転嫁遅延でマージンが圧迫されています。地政学的エネルギーショックやトラック不足がコストの不確実性を増幅させ、生産者は調達先の多様化や指数連動価格の導入を迫られています。しかし顧客は固定価格契約を要求する傾向が強まり、リスクが供給側に転嫁されることでレディーミクストコンクリート市場の成長が抑制されています。
セグメント分析
2025年時点で、輸送用混合コンクリートはレディーミクストコンクリート市場の72.65%を占めました。これは大規模なトラック車両群、確立された発注体制、競争力のある納入コストに支えられたものです。一方、現場混合コンクリートは数量的にはごく一部ですが、建設業者が長距離輸送や現場での打設時間の制約に直面する中、5.66%のCAGRで拡大が見込まれます。交通渋滞によりスケジュールに余裕がなくなるラテンアメリカの都市部では、採用が増加しています。ダムや原子力プロジェクトなど、ピーク時の均一性が求められる案件では、中央混合コンクリートが依然として好まれますが、そのシェアがわずかに上昇するのは、地域のメガプロジェクトが入札段階に入った場合に限られます。
収縮混合コンクリート市場規模は、最大3時間スランプを維持する性能混和剤の普及により、2030年までに拡大が見込まれます。生産者は収縮混合・輸送混合両対応のデュアルドラムプラントへ投資し、ダウンタイムを最小限に抑えつつ変化する需要に対応しています。
レディーミクストコンクリート市場レポートは、製品タイプ(セントラルミキシング、シュリンクミキシング、トランジットミキシング)、最終用途セクター(商業、産業・公共施設、インフラ、住宅)、地域(アジア太平洋、北米、欧州、南米、中東・アフリカ)別に分類されています。市場予測は数量(立方メートル)で提供されます。
地域別分析
アジア太平洋地域は2025年に76.55%のシェアでレディーミクストコンクリート市場を牽引し、2031年までCAGR5.06%が見込まれます。インドの1兆4,000億米ドル規模の国家インフラ計画には、高速道路、専用貨物回廊、5,000万戸の低価格住宅が含まれ、複数年にわたる需要の見通しが確保されています。インドネシアの4,120億米ドル規模の交通網整備計画、ベトナムの製造業ブーム、そして中国の公共事業支出の継続が、本土の住宅セクターの軟調さを相殺しています。高生産量メーカーは、デリー・ムンバイ高速道路などの経済回廊沿いに追加プラントを設置し、輸送距離の短縮とカーボン目標の達成を図っています。
北米では、連邦資金による橋梁建設、港湾浚渫、電気自動車充電回廊整備が進み、安定した成長が見込まれます。米国は2023年に約4億立方ヤード(640億米ドル)を投入し、2025~2026年には中単一桁の数量増加が見込まれます。カナダでは都市交通が推進され、メキシコではニアショアリングの波が国境沿いの工業団地開発を促進しています。
欧州ではエネルギーショックにより2024年の生産量は減少しましたが、改修工事や陸上風力発電プラットフォームを中心とした政策刺激策がベースライン需要を支えています。CBAM(EU域内排出量取引制度)下での炭素価格上昇は、低クリンカー混合コンクリートへの移行を加速させ、建設業界全体の縮小にもかかわらず、環境面で差別化されたサプライヤーがシェアを拡大することを可能にしています。東欧市場では、EUの結束基金を活用して鉄道や廃水処理施設のアップグレードが進められており、長期的なトン数潜在力を高め、レディーミクストコンクリート市場に地域全体で新たな勢いをもたらしています。
その他の特典:
- エクセル形式の市場予測(ME)シート
- アナリストによる3か月間のサポート
よくあるご質問
目次
第1章 イントロダクション
- 調査の前提条件と市場の定義
- 調査範囲
第2章 調査手法
第3章 エグゼクティブサマリー
第4章 市場情勢
- 市場概要
- 市場促進要因
- 急速な都市化と住宅需要
- 政府による大規模インフラ計画
- 品質管理されたオフサイトバッチングへの選好
- 環境面からの材料効率化の推進
- デジタル配車とテレマティクスによる配送の最適化
- 市場抑制要因
- 原材料価格の変動性
- 短い作業可能期間/物流リスク
- 現場設置型容積式ミキサーの普及
- バリューチェーン分析
- ポーターのファイブフォース
- 供給企業の交渉力
- 買い手の交渉力
- 代替品の脅威
- 新規参入業者の脅威
- 競争企業間の敵対関係
第5章 市場規模と成長予測
- 製品タイプ別
- セントラルミクスト
- シュリンクミクスト
- トランジットミクスト
- 最終用途別
- 商業
- 産業・公共施設向け
- インフラ
- 住宅
- 地域別
- アジア太平洋地域
- 中国
- インド
- 日本
- 韓国
- オーストラリア
- インドネシア
- ベトナム
- その他アジア太平洋地域
- 北米
- 米国
- カナダ
- メキシコ
- 欧州
- ドイツ
- フランス
- 英国
- イタリア
- スペイン
- ロシア
- その他欧州地域
- 南米
- ブラジル
- アルゼンチン
- その他南米
- 中東・アフリカ
- サウジアラビア
- アラブ首長国連邦
- その他の中東・アフリカ
- アジア太平洋地域
第6章 競合情勢
- 市場集中度
- 戦略的動向
- 市場シェア(%)/ランキング分析
- 企業プロファイル
- Adani Group
- BBMG Corporation
- Boral Limited
- Buzzi S.p.A
- CEMEX SAB de CV
- China National Building Material Group Corporation
- China West Construction Group
- CRH
- Foshan Huijiang Concrete Co., Ltd.
- Heidelberg Materials
- Holcim
- Martin Marietta Materials
- OYAK Cimento
- SAMPYO Group
- Titan Cement
- UltraTech Cement Ltd.
- Vicat SA
- Votorantim Cimentos
