
|
市場調査レポート
商品コード
1687187
米国のエンジニアリングプラスチックス:市場シェア分析、産業動向、成長予測(2024~2029年)United States Engineering Plastics - Market Share Analysis, Industry Trends & Statistics, Growth Forecasts (2024 - 2029) |
||||||
カスタマイズ可能
適宜更新あり
|
|||||||
| 米国のエンジニアリングプラスチックス:市場シェア分析、産業動向、成長予測(2024~2029年) |
|
出版日: 2025年03月18日
発行: Mordor Intelligence
ページ情報: 英文 279 Pages
納期: 2~3営業日
|

全表示
- 概要
- 目次
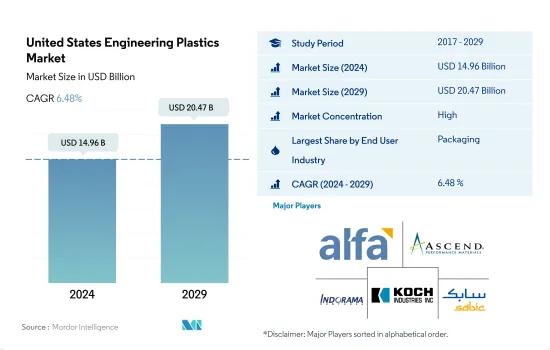
米国のエンジニアリングプラスチック市場規模は2024年に149億6,000万米ドルと推定され、2029年には204億7,000万米ドルに達し、予測期間中(2024~2029年)のCAGRは6.48%で成長すると予測されています。
エンジニアリングプラスチックの需要を牽引する先端材料の採用増加
- エンジニアリングプラスチックの用途は、航空宇宙セグメントの内装壁パネルやドアから、硬質包装や軟質包装まで多岐にわたります。エンジニアリングプラスチックは軽量で、強度、低疲労性、低燃焼性などの点で高品質であるため、多くの産業で普及しています。米国のエンジニアリングプラスチック市場は、包装、電気・電子、自動車などの産業が牽引しています。
- 米国では、包装産業が最大の市場収益シェアを占めており、予測期間中に5.93%の成長が見込まれています。プラスチック包装の需要は、主に飲食品産業から増加しています。さらに、調理済み食品の需要増加、オンライン食品購入などが、同国の包装産業を活性化させています。米国のプラスチック包装の生産量は、2022年には17万8,000トンでした。包装産業におけるエンジニアリングプラスチックの需要は、2022年には2021年と比較して金額ベースで7.71%の割合で増加しました。
- 米国の電気・電子産業はエンジニアリングプラスチックの2番目に有望な市場であり、予測期間(2023~2029年)のCAGRは金額ベースで8.41%と予想されます。この背景には、スマートホームデバイス、ウェアラブルヘルスモニター、エンターテインメント機器など、遠隔地との交流、エンターテインメント、生産性を促進する民生用電子機器製品の利用が広がっていることがあります。
- 電気自動車需要の増加と貿易施策の前向きな変化が、米国の自動車用エンジニアリングプラスチック市場成長の最大の促進要因になると予想されます。自動車産業からのエンジニアリングプラスチック需要は、予測期間中に金額ベースで5.31%のCAGRで推移すると予想されます。
米国のエンジニアリングプラスチック市場動向
民生用電子機器の増加で電気・電子製品の生産収入が増加
- 技術革新の急速なペース、可処分所得の増加、高級製品に対する需要の増加、生活水準の向上は、電気・電子市場の成長を促進する主要要因の一部です。2017年、米国は北米の電気・電子機器生産市場の約85.9%を占めました。
- 2020年、同国の電気・電子機器生産は、政府によって実施された広範なロックダウンと、これらのロックダウンによって引き起こされたサプライチェーンの混乱により、前年比約3.3%の減収となりました。パンデミックの結果、2020年の国内の電子機器・民生用電子機器製品の売上は9.9%減少しました。しかし、2021年には、米国の民生用電子機器産業の売上高は、前年比9%増の約1,270億米ドルに達しました。その結果、2021年の同国の電気・電子機器生産は、前年比17.1%の増収となりました。
- スマートフォン、ノートパソコン、パソコン、テレビなど、技術的に先進的民生用電子機器・電子機器に対する需要の急増が、予測期間中の民生用電子機器需要を押し上げると予想されます。同国の消費者向け電子機器の市場規模は、2023年の1,551億米ドルから2027年には約1,613億米ドルになると予測されます。既存の民生用電子機器製品の調査や技術進歩の増加、新モデルの革新が、エレクトロニクス市場の成長を促進しています。その結果、同国における電気・電子製品の生産は伸びると予想されます。
米国のエンジニアリングプラスチックス産業概要
米国のエンジニアリングプラスチックス市場はかなり統合されており、上位5社で66.72%を占めています。この市場の主要企業は、 Alfa S.A.B. de C.V.、Ascend Performance Materials、Indorama Ventures Public Company Limited、Koch Industries, Inc.、SABICなどです。
その他の特典
- エクセル形式の市場予測(ME)シート
- 3ヶ月のアナリストサポート
目次
第1章 エグゼクティブサマリーと主要調査結果
第2章 レポートのオファー
第3章 イントロダクション
- 調査の前提条件と市場定義
- 調査範囲
- 調査手法
第4章 主要産業動向
- エンドユーザー動向
- 航空宇宙
- 自動車
- 建築・建設
- 電気・電子
- 包装
- 輸出入動向
- 価格動向
- リサイクル概要
- ポリアミド(PA)のリサイクル動向
- ポリカーボネート(PC)のリサイクル動向
- ポリエチレンテレフタレート(PET)のリサイクル動向
- スチレン系共重合体(ABS、SAN)のリサイクル動向
- 規制の枠組み
- 米国
- バリューチェーンと流通チャネル分析
第5章 市場セグメンテーション
- エンドユーザー産業
- 航空宇宙
- 自動車
- 建築・建設
- 電気・電子
- 工業・機械
- 包装
- その他
- 樹脂タイプ
- フッ素樹脂
- サブタイプ別
- エチレンテトラフルオロエチレン(ETFE)
- フッ素化エチレンプロピレン(FEP)
- ポリテトラフルオロエチレン(PTFE)
- ポリフッ化ビニル(PVF)
- ポリフッ化ビニリデン(PVDF)
- その他のサブレジンタイプ
- 液晶ポリマー(LCP)
- ポリアミド(PA)
- サブレジンタイプ別
- アラミド
- ポリアミド(PA)6
- ポリアミド(PA)66
- ポリフタルアミド
- ポリブチレンテレフタレート(PBT)
- ポリカーボネート(PC)
- ポリエーテルエーテルケトン(PEEK)
- ポリエチレンテレフタレート(PET)
- ポリイミド(PI)
- ポリメチルメタクリレート(PMMA)
- ポリオキシメチレン(POM)
- スチレン共重合体(ABSとSAN)
- フッ素樹脂
第6章 競合情勢
- 主要な戦略動向
- 市場シェア分析
- 企業情勢
- 企業プロファイル.
- Alfa S.A.B. de C.V.
- Arkema
- Ascend Performance Materials
- BASF SE
- Celanese Corporation
- Covestro AG
- DuPont
- Formosa Plastics Group
- Indorama Ventures Public Company Limited
- INEOS
- Koch Industries, Inc.
- RTP Company
- SABIC
- Solvay
- The Chemours Company
第7章 CEOへの主要戦略的質問
第8章 付録
- 世界概要
- 概要
- ファイブフォース分析フレームワーク(産業魅力度分析)
- 世界のバリューチェーン分析
- 市場力学(DROs)
- 情報源と参考文献
- 図表一覧
- 主要洞察
- データパック
- 用語集
The United States Engineering Plastics Market size is estimated at 14.96 billion USD in 2024, and is expected to reach 20.47 billion USD by 2029, growing at a CAGR of 6.48% during the forecast period (2024-2029).
Rising adoption of advanced materials to drive the demand for engineering plastics
- Engineering plastics have applications ranging from interior wall panels and doors in aerospace to rigid and flexible packaging. Engineering plastics are popular in many industries due to their lightweight and high quality in terms of strength, low fatigue, and low flammability. The US engineering plastics market is led by industries such as packaging, electrical and electronics, and automotive.
- In the United States, the packaging industry holds the largest market revenue share, which is expected to grow by 5.93% over the forecast period. The demand for plastic packaging is increasing mainly from the food and beverages industry. Moreover, increasing demand for ready-to-eat meals, online food purchasing, etc., has triggered the packaging industry in the country. United States plastic packaging production had a volume of 178 thousand tons in 2022. The demand for engineering plastics in the packaging industry increased at a rate of 7.71% by value in 2022 compared to 2021.
- The electrical and electronics industry in the United States is the second most promising market for engineering plastics, with an expected CAGR of 8.41% by value during the forecast period (2023-2029). This is due to the wider use of consumer electronics products such as smart home devices, wearable health monitors, and entertainment devices to facilitate remote interaction, entertainment, and productivity.
- The rise in demand for electric vehicles and positive changes in trade policies are expected to be the biggest driving factors in the growth of the market for US automotive engineering plastics. The demand for engineering plastic from the automotive industry is expected to record a CAGR of 5.31% by value during the forecast period.
United States Engineering Plastics Market Trends
Rising consumer electronics to augment the electrical & electronics production revenue
- The rapid pace of technological innovation, rising disposable income, increased demand for luxury products, and improving living standards are some of the major factors driving the growth of the electrical and electronics market. In 2017, the United States accounted for around 85.9% of the North American electrical and electronics production market.
- In 2020, the electrical and electronics production in the country decreased by around 3.3% in revenue compared to the previous year, owing to widespread lockdowns implemented by the government and supply chain disruptions caused by these lockdowns. The pandemic resulted in a decline in sales of electronics and appliances in the country by 9.9% in 2020. However, in 2021, consumer electronics industry sales in the United States reached around USD 127 billion, a 9% increase compared to the previous year. Consequently, in 2021, electrical & electronics production in the country grew by a rate of 17.1% in revenue compared to the previous year.
- The surge in demand for technologically advanced consumer electronics and appliances, such as smartphones, laptops, computers, televisions, and others, is expected to boost consumer electronics demand during the forecast period. Consumer electronics in the country are projected to generate a market volume of approximately USD 161.3 billion in 2027, up from USD 155.10 billion in 2023. The increasing research and technological advancements in existing appliances, as well as the innovation of new models, are driving the growth of the electronics market. As a result, the electrical and electronic production in the country is expected to grow.
United States Engineering Plastics Industry Overview
The United States Engineering Plastics Market is fairly consolidated, with the top five companies occupying 66.72%. The major players in this market are Alfa S.A.B. de C.V., Ascend Performance Materials, Indorama Ventures Public Company Limited, Koch Industries, Inc. and SABIC (sorted alphabetically).
Additional Benefits:
- The market estimate (ME) sheet in Excel format
- 3 months of analyst support
TABLE OF CONTENTS
1 EXECUTIVE SUMMARY & KEY FINDINGS
2 REPORT OFFERS
3 INTRODUCTION
- 3.1 Study Assumptions & Market Definition
- 3.2 Scope of the Study
- 3.3 Research Methodology
4 KEY INDUSTRY TRENDS
- 4.1 End User Trends
- 4.1.1 Aerospace
- 4.1.2 Automotive
- 4.1.3 Building and Construction
- 4.1.4 Electrical and Electronics
- 4.1.5 Packaging
- 4.2 Import And Export Trends
- 4.3 Price Trends
- 4.4 Recycling Overview
- 4.4.1 Polyamide (PA) Recycling Trends
- 4.4.2 Polycarbonate (PC) Recycling Trends
- 4.4.3 Polyethylene Terephthalate (PET) Recycling Trends
- 4.4.4 Styrene Copolymers (ABS and SAN) Recycling Trends
- 4.5 Regulatory Framework
- 4.5.1 United States
- 4.6 Value Chain & Distribution Channel Analysis
5 MARKET SEGMENTATION (includes market size in Value in USD and Volume, Forecasts up to 2029 and analysis of growth prospects)
- 5.1 End User Industry
- 5.1.1 Aerospace
- 5.1.2 Automotive
- 5.1.3 Building and Construction
- 5.1.4 Electrical and Electronics
- 5.1.5 Industrial and Machinery
- 5.1.6 Packaging
- 5.1.7 Other End-user Industries
- 5.2 Resin Type
- 5.2.1 Fluoropolymer
- 5.2.1.1 By Sub Resin Type
- 5.2.1.1.1 Ethylenetetrafluoroethylene (ETFE)
- 5.2.1.1.2 Fluorinated Ethylene-propylene (FEP)
- 5.2.1.1.3 Polytetrafluoroethylene (PTFE)
- 5.2.1.1.4 Polyvinylfluoride (PVF)
- 5.2.1.1.5 Polyvinylidene Fluoride (PVDF)
- 5.2.1.1.6 Other Sub Resin Types
- 5.2.2 Liquid Crystal Polymer (LCP)
- 5.2.3 Polyamide (PA)
- 5.2.3.1 By Sub Resin Type
- 5.2.3.1.1 Aramid
- 5.2.3.1.2 Polyamide (PA) 6
- 5.2.3.1.3 Polyamide (PA) 66
- 5.2.3.1.4 Polyphthalamide
- 5.2.4 Polybutylene Terephthalate (PBT)
- 5.2.5 Polycarbonate (PC)
- 5.2.6 Polyether Ether Ketone (PEEK)
- 5.2.7 Polyethylene Terephthalate (PET)
- 5.2.8 Polyimide (PI)
- 5.2.9 Polymethyl Methacrylate (PMMA)
- 5.2.10 Polyoxymethylene (POM)
- 5.2.11 Styrene Copolymers (ABS and SAN)
- 5.2.1 Fluoropolymer
6 COMPETITIVE LANDSCAPE
- 6.1 Key Strategic Moves
- 6.2 Market Share Analysis
- 6.3 Company Landscape
- 6.4 Company Profiles (includes Global Level Overview, Market Level Overview, Core Business Segments, Financials, Headcount, Key Information, Market Rank, Market Share, Products and Services, and Analysis of Recent Developments).
- 6.4.1 Alfa S.A.B. de C.V.
- 6.4.2 Arkema
- 6.4.3 Ascend Performance Materials
- 6.4.4 BASF SE
- 6.4.5 Celanese Corporation
- 6.4.6 Covestro AG
- 6.4.7 DuPont
- 6.4.8 Formosa Plastics Group
- 6.4.9 Indorama Ventures Public Company Limited
- 6.4.10 INEOS
- 6.4.11 Koch Industries, Inc.
- 6.4.12 RTP Company
- 6.4.13 SABIC
- 6.4.14 Solvay
- 6.4.15 The Chemours Company
7 KEY STRATEGIC QUESTIONS FOR ENGINEERING PLASTICS CEOS
8 APPENDIX
- 8.1 Global Overview
- 8.1.1 Overview
- 8.1.2 Porter's Five Forces Framework (Industry Attractiveness Analysis)
- 8.1.3 Global Value Chain Analysis
- 8.1.4 Market Dynamics (DROs)
- 8.2 Sources & References
- 8.3 List of Tables & Figures
- 8.4 Primary Insights
- 8.5 Data Pack
- 8.6 Glossary of Terms

