
|
市場調査レポート
商品コード
1683973
米国の屋内用LED照明:市場シェア分析、産業動向・統計、成長予測(2025年~2030年)US Indoor LED Lighting - Market Share Analysis, Industry Trends & Statistics, Growth Forecasts (2025 - 2030) |
||||||
カスタマイズ可能
適宜更新あり
|
|||||||
| 米国の屋内用LED照明:市場シェア分析、産業動向・統計、成長予測(2025年~2030年) |
|
出版日: 2025年03月18日
発行: Mordor Intelligence
ページ情報: 英文 170 Pages
納期: 2~3営業日
|

全表示
- 概要
- 目次
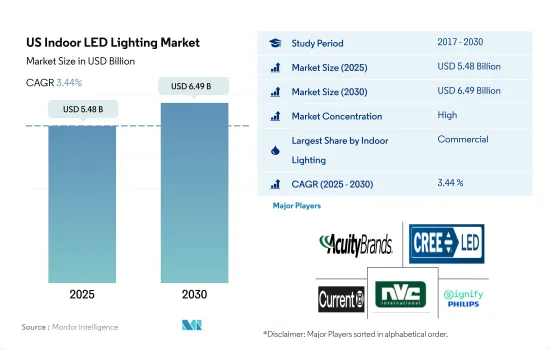
米国の屋内用LED照明市場規模は、2025年に54億8,000万米ドルと推定され、2030年には64億9,000万米ドルに達すると予測され、予測期間(2025-2030)のCAGRは3.44%で成長します。
可処分所得の増加、政府投資、同地域における商業建築の増加などが、LED照明市場の成長を牽引しています。
- 金額シェアでは、2023年に商業施設がシェアの大半を占め、工業・倉庫、住宅が続きます。産業部門の回復力の成長に寄与する主な要因は、中国における労働力レベルの変化、米国の生産に対する規制負担の少なさ、米国の国内総生産に対する製造所得の活力の高さです。
- 2023年の数量シェアでは、商業部門が大半を占め、住宅部門、産業・倉庫部門がそれに続きます。アメリカの保管スペースに対するニーズは、明るい未来に向かって進んでいます。eコマースの加速に伴い、倉庫業界はこれまで以上の成長機会を見ることになるかもしれないです。2020年第3四半期の米国の小売eコマース売上高は2,095億米ドルと推定されています。これは2019年第3四半期に比べて36.7%の増加です。
- 建設業界はあらゆる分野で成長産業です。民間および商業セクターの建設業者、請負業者、土木技師などが含まれます。建設・鉱業部門の雇用は2019年から2029年にかけて4%増加すると予想され、これは全雇用の平均とほぼ同じ割合です。この成長の原動力の一部は、人口増加による新しい建物、道路、その他の構造物に対する需要の増加です。
- 2022年、米国の中小企業は3,320万社。急成長している新興企業5社の本社はサンフランシスコにあります。米国の新興企業の40%は、少なくとも1人の女性がリーダーシップを取っています。2022年には65%以上の中小企業が利益を計上。上記のような事例から、今後数年間は屋内LEDの需要が高まると予想されます。
米国の屋内用LED照明市場動向
個人所有住宅数の増加と政府規制がLED市場を牽引
- 2021年現在、米国の世帯数は約1億2,400万世帯。2017年から2021年までの1世帯当たりの人口は2.6人で、2022年までに登録された住宅総数は1億4,370万戸となりました。さらに、2020年の人口は3億3,140万人で、2022年には3億3,320万人に増加し、0.6%の伸びを示します。また、持ち家率は64.6%と高くなっています。上記の事例を考慮すると、世帯規模が小さくなり、新しい住宅を必要とすること、人口が増加していることが示唆されます。このような事例から、国内の照明ニーズに対してLEDの普及が進むと予想されます。米国では、可処分所得が増加しており、その結果、新しい居住スペースにより多くの支出をすることができる個人の消費力が上昇しています。米国の一人当たり所得は、2020年12月の33,740.8米ドルに比べ、2021年12月には3万6,430米ドルに達します。他の開発途上国に比べ、米国はより多くの所得を得ています。例えば、メキシコの一人当たり所得は2020年時点で2,639.7米ドル、カナダは2万9,330米ドルであり、それより低いです。
- 5月の個人住宅着工件数は年間ベースで163万1,000件です。これは2022年5月の154.3万戸を5.7%上回り、2023年4月改定値の134.0万戸を21.7%上回る。エネルギー政策法(EPAct)第179D条により、2023年の新規制下では、最大税額控除額はアップグレードされたスペース1平方フィート当たり5米ドルに跳ね上がりました。2022年には1平方フィート当たり1.88米ドルが控除されていた(しかし、1平方フィート当たり2米ドルに上昇する予定である)。対象となるプロジェクトは、室内照明、空調、建物外壁に関するものです。このような事例により、国内でのLED照明の需要がさらに急増すると予想されます。
2025年までに商業ビルで72%、住宅で56%、産業で83%のLED設置が増加し、LED市場の成長を牽引へ
- 米国の住宅および商業照明の合計消費量は、およそ2,130億kWhでした。2017年におよそ14億台設置されたLED照明が、2035年には79億台以上に増加します。2025年までに、商業施設の72%、住宅の56%、工業施設の83%にLED照明が設置されると予想されています。2021年の米国の住宅戸数は1億4,200万戸で、前年から20万戸増加しました。住宅ストック全体が1億4,080万戸だった2020年と比較すると、100万戸近く増加しています。LEDの成長は、住宅ストックの増加に影響されると思われます。
- 商業部門の電力需要は、営業時間中に最も高くなる傾向があります。通常、1日で8~10時間程度です。産業部門の電力使用量は、1日や1年を通して変動しない傾向があります。住宅部門の電力需要は、約7~9時間変動します。さらに、シカゴ市は2022年2月に「シカゴ・スマート照明プログラム」を完了し、28万本以上の古くなった街灯を高効率のLED照明に交換することで、夜間の視認性を向上させ、シカゴの納税者が今後10年間で1億米ドルの電気代を節約すると推定しています。
- ミシガン州運輸省とMotorway Lighting Partner LLCは、既存のトンネル照明システムと高速道路の照明システムの保守と改良のための資金提供、建設、設計を共同で行う15年間の契約を締結しました。LEDはエネルギー効率と省エネルギーに役立ち、国民が電気使用料を節約するのに役立ちます。
米国の屋内用LED照明産業概要
米国の屋内用LED照明市場はかなり統合されており、上位5社で79.54%を占めています。この市場の主要企業は以下の通りです。ACUITY BRANDS, INC., Cree LED(SMART Global Holdings, Inc.), Current Lighting Solutions, LLC., NVC INTERNATIONAL HOLDINGS LIMITED and Signify(Philips)(sorted alphabetically).
その他の特典
- エクセル形式の市場予測(ME)シート
- 3ヶ月のアナリストサポート
目次
第1章 エグゼクティブサマリーと主な調査結果
第2章 レポートのオファー
第3章 イントロダクション
- 調査の前提条件と市場定義
- 調査範囲
- 調査手法
第4章 主要産業動向
- 人口
- 一人当たり所得
- LEDの総輸入量
- 照明の電力消費量
- 世帯数
- LED普及率
- 園芸面積
- 規制の枠組み
- 米国
- バリューチェーンと流通チャネル分析
第5章 市場セグメンテーション
- 屋内照明
- 農業用照明
- 商業用照明
- オフィス
- 小売
- その他
- 産業・倉庫
- 住宅
第6章 競合情勢
- 主要な戦略動向
- 市場シェア分析
- 企業情勢
- 企業プロファイル(世界レベルの概要、市場レベルの概要、主要な事業セグメント、財務、従業員数、主要情報、市場ランク、市場シェア、製品・サービス、最近の動向分析を含む)
- ACUITY BRANDS, INC.
- ams-OSRAM AG
- Cree LED(SMART Global Holdings, Inc.)
- Current Lighting Solutions, LLC.
- Dialight
- EGLO Leuchten GmbH
- Feit Electric Company, Inc.
- LEDVANCE GmbH(MLS Co Ltd)
- NVC INTERNATIONAL HOLDINGS LIMITED
- Signify(Philips)
第7章 CEOへの主な戦略的質問
第8章 付録
- 世界の概要
- 概要
- ファイブフォース分析フレームワーク
- 世界のバリューチェーン分析
- 市場力学(DROs)
- 情報源と参考文献
- 図表一覧
- 主要洞察
- データパック
- 用語集
The US Indoor LED Lighting Market size is estimated at 5.48 billion USD in 2025, and is expected to reach 6.49 billion USD by 2030, growing at a CAGR of 3.44% during the forecast period (2025-2030).
The increasing disposable income, government investments, and rising commercial construction in the region drive the growth of led lighting market
- In terms of value share, in 2023, commercial accounted for the majority of the share, followed by industrial and warehouse, and residential. The main factors contributing to the growth of the industrial sector's resilience are changes in labor force levels in China, less regulatory burden for US production than European counterparts, and greater vitality of manufacturing income relative to the United States Gross Domestic Product.
- In terms of volume share, in 2023, commercial accounted for the majority of the share, followed by the residential sector and industrial and warehouse sector. America's need for storage space is advancing toward a brighter future. With the acceleration of e-commerce, the warehousing industry may see more growth opportunities than ever. The US retail e-commerce sales in Q3 2020 are estimated at USD 209.5 billion. This is a 36.7% increase over Q3 2019.
- The construction industry is a growth industry in all areas. These include builders, contractors, and civil engineers in the private and commercial sectors. Employment in the construction and mining sector is expected to increase by 4% from 2019 to 2029, about the same rate as the average for all jobs. Part of the driver of this growth is the increasing demand for new buildings, roads, and other structures due to population growth.
- In 2022, there were 33.2 million small businesses in the United States. The five fast-growing startups are headquartered in San Francisco. 40% of US startups have at least one woman in leadership. Over 65% of small businesses reported profits in 2022. The above instances are expected to create more demand for Indoor LEDs in the coming years.
US Indoor LED Lighting Market Trends
Increase in the number of private-owned dwellings and government regulations to drive the market for LEDs
- As of 2021, there were around 124 million households in the United States. Person per household between 2017 and 2021 was 2.6 persons, and the total housing units registered were 143.7 million by 2022. Furthermore, the population in 2020 was 331.4 million, which increased to 333.2 million by 2022, representing 0.6% growth. The owner-occupied housing unit rate was 64.6%, which is higher. Considering the above instances, it suggested that the household size is smaller and requires new housing units, and the population is growing, which also represents the same. Such instances are expected to create more LED penetration for the need for illumination in the country. In the United States, disposable income is growing, resulting in the rising spending power of individuals who can spend more on new residential spaces. The United States per Capita income reached USD 36,430 in December 2021, compared with USD 33,740.8 in December 2020. Compared to other developing nations, the US is getting more. For instance, Mexico had a per capita income of USD 2,639.7 as of 2020, and Canada had USD 29,330, which is lower.
- The number of privately owned home starts in May was 1,631,000 on an annual basis. This is 5.7% above the May 2022 rate of 1,543,000 and is 21.7% higher than the revised April 2023 estimate of 1,340,000. As per the Energy Policy Act (EPAct) section 179D, the maximum tax deduction jumped to USD 5 per sq. ft. of upgraded space in 2023 under the new regulations. Which had USD 1.88 per sq. ft. deductions in 2022 (but is set to rise to USD 2.00 per sq. ft.). Eligible projects include those related to interior lighting, HVAC, and building envelopes. Such instances are further expected to surge the demand for LED lighting in the country.
Increase in LED installation by 72% in commercial buildings, 56% in residential houses, and 83% in industries by 2025 to drive the growth of the LED market
- The combined consumption of residential and commercial lighting in the United States was roughly 213 billion kWh. From roughly 1.4 billion units installed in 2017 to over 7.9 billion units in 2035, the number of LED light installations in the US is rising. By 2025, 72% of commercial, 56% of residential, and 83% of industrial structures are expected to have LED lighting installed. There were 142 million housing units in the US in 2021, an increase of 200,000 from the previous year. In comparison to 2020, when the entire housing stock stood at 140.8 million units, there represented an increase of nearly one million. The growth of LED will be influenced by the rise in housing stock.
- Electricity demand in the commercial sector tends to be highest during operating business hours. Usually, in a day, it is around 8-10 hours. Electricity use in the industrial sector tends not to fluctuate through the day or year. Electricity demand in the residential sector varies for about 7 to 9 hours. In addition, the City of Chicago completed the Chicago Smart Lighting Programme in February 2022, which replaced more than 280,000 outdated streetlights with high-efficiency LED lights to improve visibility at night and save Chicago taxpayers an estimated USD 100 million in electricity costs over the next ten years.
- The Michigan Department of Transportation and Motorway Lighting Partner LLC entered a 15-year deal to jointly fund, construct, and design upgrades to existing tunnel lighting systems and motorways for the maintenance of the existing and improved lighting systems. LEDs can help with energy efficiency and conservation, which helps the nation's citizens save money on electricity use.
US Indoor LED Lighting Industry Overview
The US Indoor LED Lighting Market is fairly consolidated, with the top five companies occupying 79.54%. The major players in this market are ACUITY BRANDS, INC., Cree LED (SMART Global Holdings, Inc.), Current Lighting Solutions, LLC., NVC INTERNATIONAL HOLDINGS LIMITED and Signify (Philips) (sorted alphabetically).
Additional Benefits:
- The market estimate (ME) sheet in Excel format
- 3 months of analyst support
TABLE OF CONTENTS
1 EXECUTIVE SUMMARY & KEY FINDINGS
2 REPORT OFFERS
3 INTRODUCTION
- 3.1 Study Assumptions & Market Definition
- 3.2 Scope of the Study
- 3.3 Research Methodology
4 KEY INDUSTRY TRENDS
- 4.1 Population
- 4.2 Per Capita Income
- 4.3 Total Import Of Leds
- 4.4 Lighting Electricity Consumption
- 4.5 # Of Households
- 4.6 Led Penetration
- 4.7 Horticulture Area
- 4.8 Regulatory Framework
- 4.8.1 United States
- 4.9 Value Chain & Distribution Channel Analysis
5 MARKET SEGMENTATION (includes market size in Value in USD and Volume, Forecasts up to 2030 and analysis of growth prospects)
- 5.1 Indoor Lighting
- 5.1.1 Agricultural Lighting
- 5.1.2 Commercial
- 5.1.2.1 Office
- 5.1.2.2 Retail
- 5.1.2.3 Others
- 5.1.3 Industrial and Warehouse
- 5.1.4 Residential
6 COMPETITIVE LANDSCAPE
- 6.1 Key Strategic Moves
- 6.2 Market Share Analysis
- 6.3 Company Landscape
- 6.4 Company Profiles (includes Global level Overview, Market level overview, Core Business Segments, Financials, Headcount, Key Information, Market Rank, Market Share, Products and Services, and analysis of Recent Developments)
- 6.4.1 ACUITY BRANDS, INC.
- 6.4.2 ams-OSRAM AG
- 6.4.3 Cree LED (SMART Global Holdings, Inc.)
- 6.4.4 Current Lighting Solutions, LLC.
- 6.4.5 Dialight
- 6.4.6 EGLO Leuchten GmbH
- 6.4.7 Feit Electric Company, Inc.
- 6.4.8 LEDVANCE GmbH (MLS Co Ltd)
- 6.4.9 NVC INTERNATIONAL HOLDINGS LIMITED
- 6.4.10 Signify (Philips)
7 KEY STRATEGIC QUESTIONS FOR LED CEOS
8 APPENDIX
- 8.1 Global Overview
- 8.1.1 Overview
- 8.1.2 Porter's Five Forces Framework
- 8.1.3 Global Value Chain Analysis
- 8.1.4 Market Dynamics (DROs)
- 8.2 Sources & References
- 8.3 List of Tables & Figures
- 8.4 Primary Insights
- 8.5 Data Pack
- 8.6 Glossary of Terms
