
|
市場調査レポート
商品コード
1683507
コラーゲン:市場シェア分析、産業動向・統計、成長予測(2025年~2030年)Collagen - Market Share Analysis, Industry Trends & Statistics, Growth Forecasts (2025 - 2030) |
||||||
カスタマイズ可能
適宜更新あり
|
|||||||
| コラーゲン:市場シェア分析、産業動向・統計、成長予測(2025年~2030年) |
|
出版日: 2025年03月18日
発行: Mordor Intelligence
ページ情報: 英文 376 Pages
納期: 2~3営業日
|

全表示
- 概要
- 目次
概要
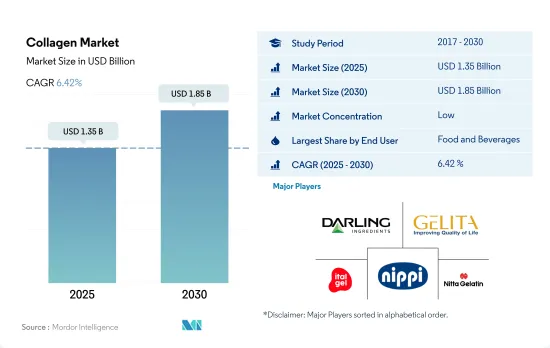
コラーゲン市場規模は2025年に13億5,000万米ドルと推計され、2030年には18億5,000万米ドルに達すると予測され、予測期間中(2025-2030年)のCAGRは6.42%で成長する見込みです。
パーソナルケアと化粧品分野は、コラーゲンベースの美容製品、すなわち肌に有益な製品に対する消費者の嗜好の高まりにより、予測期間中に売上高が増加すると予想されます。
- エンドユーザー別では、飲料、ベーカリー、スナック菓子のサブセグメントでの用途が大半を占め、F&Bが最大のセグメントを維持しています。また、このセグメントは予測期間中、数量ベースでCAGR 5.99%を記録し、市場を牽引すると予測されています。この需要の背景には、その多機能性と栄養面での利点があります。
- しかし、予測期間においては、パーソナルケアおよび化粧品セグメントにおけるコラーゲンの用途が、数量ベースで最も速いCAGR 7.02%を示し、他のセグメントを凌駕すると予測されます。この分野では、皮膚刺激や感作性、光毒性がほとんどないことから、加水分解された形態のコラーゲンが使用されています。タンパク質強化は、健康への関心の高まりとともに、世界の消費者の間で大きな関心事となっています。例えば2021年には、世界の消費者の75%がタンパク質強化食品と飲食品に高い価格を支払い、半数以上が10%のプレミアムを支払い、15%の消費者は25%のプレミアムを支払うことを望んでいます。
- 飲料サブセグメントは、コラーゲン市場で最大のエンドユーザー・セグメントであり、2023年には総消費量の44.2%以上を占める。コラーゲンドリンク市場は開発の初期段階にあります。消費者が摂取する飲料の健康効果に対する意識が高まるにつれ、コラーゲンドリンク市場全体の拡大が期待されます。コラーゲン飲料は、ヒドロキシプロリン、アミノ酸のグリシン、アルギニン、プロリンを多く含み、これらはエネルギー供給、細胞再生、代謝に関連します。コラーゲンは多くのホット飲料に使用することができ、健康上の利点を持つ革新的な製品への道を開きます。したがって、コーヒーやホットチョコレートなど、コラーゲンを強化したホット飲料の消費は高いペースで増加しています。
アジア太平洋は、コラーゲンベースの製品の人気の高まりと様々な製造ユニットの強力なプレゼンスにより、2022年にシェアの大半を占めました。
- アジア太平洋地域のコラーゲン市場は、主に中国とインドにおける原材料の生産量の増加により、最大規模となっています。中国では、コラーゲンのサプリメントへの応用は、肌の美容のためだけでなく、免疫、関節の健康、スポーツのパフォーマンスにも有益です。この地域におけるコラーゲンの売上は、人口の高齢化と、コラーゲンをベースとした成分を製品ラインに順次追加している企業によって牽引されています。東南アジアでは、60歳以上の高齢者の割合は2017年には9.8%であったが、2030年には13.7%に上昇すると予測されています。
- 欧州は同市場にとって2番目に大きな地域セグメントであり、予測期間中に金額ベースで6.48%という最も速いCAGRで推移すると予測されています。これは、パーソナルケアや化粧品のような潜在性の高いエンドユーザー・セグメント向けに絶え間ない製品革新のような明確な戦略を採用することで、急増する需要に対応する地域プレーヤーの増加に起因しています。ドイツでは、SanotactやBeautyHackerの美容コラーゲンドリンクのような、コラーゲンベースの美容ドリンクやコラーゲンペプチドベースの飲料の人気が高まっていることが、この成長に寄与しています。
- 中東・アフリカはもう一つの有望市場です。消費者の多くがイスラム教の原則に従っているため、同地域の市場プレーヤーはハラール由来のコラーゲンや海洋由来のコラーゲンを供給する機会を得ています。宗教に基づく政策の導入と実施に伴い、主にコラーゲンベースの製品を使用するための柔軟性を提供するために、需要は増加すると予想されます。中東およびアフリカ地域の海洋由来コラーゲン市場は、予測期間中にそれぞれ7.47%、8.21%のCAGRで推移すると予測されます。
世界のコラーゲン市場動向
健康的な間食の嗜好とオンラインプラットフォームの成長が市場成長を支える
- 世界の消費者は、健康志向の高まりとともに間食のライフスタイルをますます受け入れています。この変化は、従来のスナック菓子よりも栄養価の高い代替品を好むことからも明らかです。例えば2021年6月、英国ではZ世代(16~24歳)の25%が「低カロリー」と表示されたスナックを好み、ミレニアル世代(25~34歳)の18%が高タンパク質の選択肢を求めていました。さらに、55歳以上の36%が「低糖質」または「糖質ゼロ」のスナックを積極的に求めています。その結果、業界大手各社は、低脂肪・低カロリーのさまざまな商品を投入することで対応しています。
- さらに、食の動向やインスピレーションを得るためにソーシャルメディアに依存するユーザーが増え、インスタグラムやユーチューブといったプラットフォームが、新しいスナックを発見するための重要なツールとして台頭しています。世界の消費者の70%以上、特にZ世代とミレニアル世代は、2022年に新しいスナックを発見した理由をソーシャルメディアに求めています。オンライン・プラットフォームの台頭により、そのプロセスはさらに合理化され、消費者は自宅にいながらにして多様なスナックを探索・購入できるようになりました。
- また、プレミアム化がスナック菓子分野の技術革新を促進し、新鮮で体に良く、機能的なスナック菓子が重視されています。大胆でスパイシーなフレーバーやエキゾチックな食材が人気を集め、世界の多様な味覚にアピールし、地域市場の成長を後押ししています。間食は単なる栄養補給を超え、現代文化に深く浸透しています。仕事をしながら、あるいは自宅で娯楽を楽しみながら、間食をとるのが一般的になっています。例えば、Godrej Yummiezが2022年11月に発表したレポートでは、インドの消費者の45%がパーティーやお祝いの席での間食を好んでいることが強調されています。このような文化的変化は、間食が個人の選択から社会の期待へと変化していることを浮き彫りにしています。
肉はコラーゲン製造の原材料として主に使用されている
- 肉は世界中の人々にとって重要な栄養源です。食肉に対する世界の需要は過去50年間に拡大し、食肉生産量は3倍に増加しました。現在、世界の食肉生産量は毎年3億5,000万トンを超えています。地域的には、アジア太平洋が最大の食肉生産国であり、世界の食肉生産量のかなりの部分を占めています。これは過去数十年からの大きな転換を意味します。欧州の食肉生産量も近年倍増しています。中国が食肉生産増加の大半を占め、米国、ブラジル、インドがそれに続くと予測されます。
- 牛肉とバッファロー肉の生産量は米国がトップで、ブラジルと中国がこれに続きます。アルゼンチン、オーストラリア、インドの貢献も注目に値します。鶏肉の分野では、米国がトップで、中国とブラジルが重要な役割を果たしています。総体として、欧州は米国に匹敵するほどの鶏肉生産量を誇っています。しかし、一人当たりの食肉消費量がすでに高い高所得国では、需要の停滞、あるいは減少が予測されます。このような変化は、人口の高齢化と、より幅広いタンパク質を重視するようになった食生活の嗜好の変化に起因しています。
- 特に中国を中心とした牛群や群れの拡大が、世界の食肉生産の上昇基調を支えています。この動向は、特に低・中所得国での畜産と技術の進歩と相俟って、生産性を高めることになります。特に鶏肉は、世界の食肉生産の急増を牽引しています。
コラーゲン産業の概要
コラーゲン市場は断片化されており、上位5社で11.59%を占めています。この市場の主要企業は以下の通りです。Darling Ingredients Inc., GELITA AG, Italgelatine SpA, Nippi. Inc. and Nitta Gelatin Inc.(sorted alphabetically).
その他の特典
- エクセル形式の市場予測(ME)シート
- 3ヶ月のアナリストサポート
目次
第1章 エグゼクティブサマリーと主な調査結果
第2章 イントロダクション
- 調査の前提条件と市場定義
- 調査範囲
- 調査手法
第3章 主要産業動向
- エンドユーザー市場規模
- ベビーフードおよび乳児用調製粉乳
- ベーカリー
- 飲料
- 朝食用シリアル
- 調味料/ソース
- 菓子類
- 乳製品および乳製品代替製品
- 高齢者栄養・医療栄養
- 肉・鶏肉・魚介類および肉代替製品
- RTE/RTC食品
- スナック
- スポーツ/パフォーマンス栄養
- 動物飼料
- パーソナルケアと化粧品
- タンパク質消費動向
- 動物
- 生産動向
- 動物
- 規制の枠組み
- 中国
- フランス
- ドイツ
- インド
- イタリア
- 日本
- 英国
- 米国
- バリューチェーンと流通チャネル分析
第4章 市場セグメンテーション
- 形態
- 動物ベース
- 海洋ベース
- エンドユーザー
- 動物飼料
- 飲食品
- サブエンドユーザー別
- ベーカリー
- 飲料
- 朝食用シリアル
- スナック
- パーソナルケアと化粧品
- サプリメント
- サブエンドユーザー別
- 高齢者栄養と医療栄養
- スポーツ/パフォーマンス栄養
- 地域別
- アフリカ
- 形態別
- エンドユーザー別
- 国別
- ナイジェリア
- 南アフリカ
- その他のアフリカ
- アジア太平洋
- 形態別
- エンドユーザー別
- 国別
- オーストラリア
- 中国
- インド
- インドネシア
- 日本
- マレーシア
- ニュージーランド
- 韓国
- タイ
- ベトナム
- その他アジア太平洋地域
- 欧州
- 形態別
- エンドユーザー別
- 国別
- ベルギー
- フランス
- ドイツ
- イタリア
- オランダ
- ロシア
- スペイン
- トルコ
- 英国
- その他欧州
- 中東
- 形態別
- エンドユーザー別
- 国別
- イラン
- サウジアラビア
- アラブ首長国連邦
- その他中東
- 北米
- 形態別
- エンドユーザー別
- 国別
- カナダ
- メキシコ
- 米国
- その他北米
- 南米
- 形態別
- エンドユーザー別
- 国別
- アルゼンチン
- ブラジル
- その他南米地域
- アフリカ
第5章 競合情勢
- 主要な戦略動向
- 市場シェア分析
- 企業情勢
- 企業プロファイル(世界レベルの概要、市場レベルの概要、主要事業セグメント、財務、従業員数、主要情報、市場ランク、市場シェア、製品・サービス、最近の動向分析を含む)
- ASAHI GELATINE INDUSTRIAL Co.,Ltd.
- Darling Ingredients Inc.
- Ewald-Gelatine GmbH
- Foodchem International Corporation
- GELITA AG
- Italgelatine SpA
- Jellice Pioneer Private Limited
- Nippi. Inc.
- Nitta Gelatin Inc.
第6章 CEOへの主な戦略的質問
第7章 付録
- 世界概要
- 概要
- ファイブフォース分析フレームワーク
- 世界のバリューチェーン分析
- 市場力学(DROs)
- 情報源と参考文献
- 図表一覧
- 主要洞察
- データパック
- 用語集
目次
Product Code: 90227
The Collagen Market size is estimated at 1.35 billion USD in 2025, and is expected to reach 1.85 billion USD by 2030, growing at a CAGR of 6.42% during the forecast period (2025-2030).
Personal care and cosmetic segment is expected to gain higher sales in forecast period due to growing consumer preferences for collagen-based beauty products i.e. beneficial for skin
- By end user, F&B remained the largest segment, with the majority of applications in the beverage, bakery, and snacks sub-segments. The segment is also anticipated to drive the market with a CAGR of 5.99%, by volume, in the forecast period. This demand can be attributed to its multi-functionality and nutritional benefits.
- However, in the forecast period, collagen application in the personal care and cosmetics segment is projected to outpace other segments with the fastest CAGR of 7.02% by volume. The segment uses collagen in the hydrolyzed form, owing to its negligible skin irritation, sensitization, or indication of phototoxicity. Protein fortification has become a major interest among global consumers, with a rise in their health concerns. For example, in 2021, 75% of global consumers paid a higher price for protein-fortified food and beverages, while more than half paid a 10% premium, and 15% of consumers would be willing to pay a 25% premium.
- The beverages sub-segment is the largest end-user segment in the collagen market and represents over 44.2% of the total consumption volume in 2023. The collagen drinks market is in its early stages of development. As consumers become increasingly aware of the health benefits of the beverages they consume, it is expected to increase the overall market for collagen drinks. Collagen-based drinks are high in hydroxyproline, amino acids glycine, arginine, and proline, which are associated with energy supply, cell regeneration, and metabolism. Collagen can be used in many hot beverages, which paves the way for innovative products with health benefits. Hence, the consumption of collagen-enhanced hot beverages such as coffee and hot chocolate is increasing at a high pace.
Asia-pacific accounted majority of share in 2022 due to growing popularity of collagen based products coupled with strong presence of various manufacturing units
- The Asia-Pacific collagen market is the largest, owing to the higher production of raw materials in the region, mainly in China and India. In China, collagen application in supplements is not only used for skin beauty but also beneficial for immune, joint health, and sports performance. Collagen sales in the region are being driven by the aging population and companies that are progressively adding collagen-based ingredients to their product lines. In Southeast Asia, the proportion of individuals aged 60 years and older was 9.8% in 2017, which is projected to rise to 13.7% by 2030.
- Europe is the second-largest regional segment for the market and is also projected to record the fastest CAGR of 6.48%, by value, during the forecast period, attributed to a rise in regional players catering to the surging demand by adopting distinct strategies like constant product innovation for highly potential end-user segments, like personal care and cosmetics. The growing popularity of collagen-based beauty drinks and collagen peptide-based beverages like Sanotact and BeautyHacker beauty collagen drinks in Germany contributes to this growth.
- Middle East & Africa is another promising market, as most consumers follow Islamic principles, thus creating opportunities for market players in the region to supply collagen sourced from halal sources or marine-based collagen/ With the introduction and implementation of religion-based policies, the demand is anticipated to increase, primarily to render flexibility for using collagen-based products. The marine-sourced collagen market in the Middle East and African regions is projected to record a CAGR of 7.47% and 8.21%, respectively, during the forecast period.
Global Collagen Market Trends
Healthy snacking preferences with growth in online platforms are supporting market growth
- Consumers worldwide increasingly embrace a snacking lifestyle with a heightened focus on health. This shift is evident in their preference for nutritious alternatives over traditional snacks. For instance, in June 2021, 25% of Gen Zs (16 to 24 years old) in the United Kingdom favored snacks labeled "low in calories," while 18% of millennials (25 to 34 years old) sought out high-protein options. Additionally, 36% of those over 55 actively sought snacks with "low" or "no sugar" content. Consequently, leading industry players have responded by introducing a variety of low-fat and low-calorie offerings.
- Furthermore, with users increasingly relying on social media for food trends and inspiration, platforms like Instagram and YouTube have emerged as crucial tools for discovering new snacks. Over 70% of global consumers, particularly Gen Zs and millennials, attributed their discovery of new snacks in 2022 to social media. The rise of online platforms has further streamlined the process, allowing consumers to explore and purchase a diverse range of snacks from the comfort of their homes.
- Also, premiumization is driving innovation innovation in the snacks segment, emphasizing fresh, better-for-you, and functional snacks. Bold, spicy flavors and exotic ingredients are gaining traction, appealing to a diverse global palate and fueling growth in regional markets. Snacking has transcended mere sustenance, becoming deeply ingrained in modern culture. It has become common to snack while working or enjoying entertainment at home. For example, a November 2022 report from Godrej Yummiez highlighted that 45% of Indian consumers favored snacking during parties and celebrations. This cultural shift highlights the transformation of snacking from a personal choice to a societal expectation.
Meat is majorly used as a raw material by collagen manufacturers
- Meat is an important source of nutrition for people around the world. Global demand for meat has grown over the past 50 years, with meat production tripling. Global produce presently stands at more than 350 million tonnes each year. Regionally, Asia-Pacific holds the position of being the largest meat producer, contributing a substantial portion of the total global meat production. This represents a significant shift from previous decades. Europe's meat output has also doubled in recent years. China is projected to account for most of the total increase in meat production, followed by the United States, Brazil, and India.
- The United States takes the crown as the top producer of beef and buffalo meat, with Brazil and China following suit. Noteworthy contributions also come from Argentina, Australia, and India. In the poultry realm, the United States leads the pack, with China and Brazil playing pivotal roles. As a collective, Europe matches the United States in its substantial poultry output. However, in high-income nations, where per capita meat consumption is already high, a plateau or even a decline in demand is foreseen. This shift is attributed to aging populations and evolving dietary preferences, emphasizing a broader protein palette.
- Expanding herds and flocks, especially in China, are underpinning global meat production's upward trajectory. This trend is set to bolster productivity, coupled with advancements in animal breeding and technology, particularly in low and middle-income nations. Poultry meat, in particular, is driving this surge in global meat production.
Collagen Industry Overview
The Collagen Market is fragmented, with the top five companies occupying 11.59%. The major players in this market are Darling Ingredients Inc., GELITA AG, Italgelatine SpA, Nippi. Inc. and Nitta Gelatin Inc. (sorted alphabetically).
Additional Benefits:
- The market estimate (ME) sheet in Excel format
- 3 months of analyst support
TABLE OF CONTENTS
1 EXECUTIVE SUMMARY & KEY FINDINGS
2 INTRODUCTION
- 2.1 Study Assumptions & Market Definition
- 2.2 Scope of the Study
- 2.3 Research Methodology
3 KEY INDUSTRY TRENDS
- 3.1 End User Market Volume
- 3.1.1 Baby Food and Infant Formula
- 3.1.2 Bakery
- 3.1.3 Beverages
- 3.1.4 Breakfast Cereals
- 3.1.5 Condiments/Sauces
- 3.1.6 Confectionery
- 3.1.7 Dairy and Dairy Alternative Products
- 3.1.8 Elderly Nutrition and Medical Nutrition
- 3.1.9 Meat/Poultry/Seafood and Meat Alternative Products
- 3.1.10 RTE/RTC Food Products
- 3.1.11 Snacks
- 3.1.12 Sport/Performance Nutrition
- 3.1.13 Animal Feed
- 3.1.14 Personal Care and Cosmetics
- 3.2 Protein Consumption Trends
- 3.2.1 Animal
- 3.3 Production Trends
- 3.3.1 Animal
- 3.4 Regulatory Framework
- 3.4.1 China
- 3.4.2 France
- 3.4.3 Germany
- 3.4.4 India
- 3.4.5 Italy
- 3.4.6 Japan
- 3.4.7 United Kingdom
- 3.4.8 United States
- 3.5 Value Chain & Distribution Channel Analysis
4 MARKET SEGMENTATION (includes market size in Value in USD and Volume, Forecasts up to 2030 and analysis of growth prospects)
- 4.1 Form
- 4.1.1 Animal Based
- 4.1.2 Marine Based
- 4.2 End User
- 4.2.1 Animal Feed
- 4.2.2 Food and Beverages
- 4.2.2.1 By Sub End User
- 4.2.2.1.1 Bakery
- 4.2.2.1.2 Beverages
- 4.2.2.1.3 Breakfast Cereals
- 4.2.2.1.4 Snacks
- 4.2.3 Personal Care and Cosmetics
- 4.2.4 Supplements
- 4.2.4.1 By Sub End User
- 4.2.4.1.1 Elderly Nutrition and Medical Nutrition
- 4.2.4.1.2 Sport/Performance Nutrition
- 4.3 Region
- 4.3.1 Africa
- 4.3.1.1 By Form
- 4.3.1.2 By End User
- 4.3.1.3 By Country
- 4.3.1.3.1 Nigeria
- 4.3.1.3.2 South Africa
- 4.3.1.3.3 Rest of Africa
- 4.3.2 Asia-Pacific
- 4.3.2.1 By Form
- 4.3.2.2 By End User
- 4.3.2.3 By Country
- 4.3.2.3.1 Australia
- 4.3.2.3.2 China
- 4.3.2.3.3 India
- 4.3.2.3.4 Indonesia
- 4.3.2.3.5 Japan
- 4.3.2.3.6 Malaysia
- 4.3.2.3.7 New Zealand
- 4.3.2.3.8 South Korea
- 4.3.2.3.9 Thailand
- 4.3.2.3.10 Vietnam
- 4.3.2.3.11 Rest of Asia-Pacific
- 4.3.3 Europe
- 4.3.3.1 By Form
- 4.3.3.2 By End User
- 4.3.3.3 By Country
- 4.3.3.3.1 Belgium
- 4.3.3.3.2 France
- 4.3.3.3.3 Germany
- 4.3.3.3.4 Italy
- 4.3.3.3.5 Netherlands
- 4.3.3.3.6 Russia
- 4.3.3.3.7 Spain
- 4.3.3.3.8 Turkey
- 4.3.3.3.9 United Kingdom
- 4.3.3.3.10 Rest of Europe
- 4.3.4 Middle East
- 4.3.4.1 By Form
- 4.3.4.2 By End User
- 4.3.4.3 By Country
- 4.3.4.3.1 Iran
- 4.3.4.3.2 Saudi Arabia
- 4.3.4.3.3 United Arab Emirates
- 4.3.4.3.4 Rest of Middle East
- 4.3.5 North America
- 4.3.5.1 By Form
- 4.3.5.2 By End User
- 4.3.5.3 By Country
- 4.3.5.3.1 Canada
- 4.3.5.3.2 Mexico
- 4.3.5.3.3 United States
- 4.3.5.3.4 Rest of North America
- 4.3.6 South America
- 4.3.6.1 By Form
- 4.3.6.2 By End User
- 4.3.6.3 By Country
- 4.3.6.3.1 Argentina
- 4.3.6.3.2 Brazil
- 4.3.6.3.3 Rest of South America
- 4.3.1 Africa
5 COMPETITIVE LANDSCAPE
- 5.1 Key Strategic Moves
- 5.2 Market Share Analysis
- 5.3 Company Landscape
- 5.4 Company Profiles (includes Global Level Overview, Market Level Overview, Core Business Segments, Financials, Headcount, Key Information, Market Rank, Market Share, Products and Services, and Analysis of Recent Developments).
- 5.4.1 ASAHI GELATINE INDUSTRIAL Co.,Ltd.
- 5.4.2 Darling Ingredients Inc.
- 5.4.3 Ewald-Gelatine GmbH
- 5.4.4 Foodchem International Corporation
- 5.4.5 GELITA AG
- 5.4.6 Italgelatine SpA
- 5.4.7 Jellice Pioneer Private Limited
- 5.4.8 Nippi. Inc.
- 5.4.9 Nitta Gelatin Inc.
6 KEY STRATEGIC QUESTIONS FOR PROTEIN INGREDIENTS INDUSTRY CEOS
7 APPENDIX
- 7.1 Global Overview
- 7.1.1 Overview
- 7.1.2 Porter's Five Forces Framework
- 7.1.3 Global Value Chain Analysis
- 7.1.4 Market Dynamics (DROs)
- 7.2 Sources & References
- 7.3 List of Tables & Figures
- 7.4 Primary Insights
- 7.5 Data Pack
- 7.6 Glossary of Terms
