
データ可視化:市場シェア分析、産業動向、統計、成長予測(2025~2030年)
Data Visualization - Market Share Analysis, Industry Trends & Statistics, Growth Forecasts (2025 - 2030)- 発行日
- ページ情報
- 英文 120 Pages
- 納期
- 2~3営業日
- 商品コード
- 1629796
- カスタマイズ可能 お客様のご希望に応じて、既存データの加工や未掲載情報(例:国別セグメント)の追加などの対応が可能です。詳細はお問い合わせください。
- 適宜更新あり 本レポートは最新情報反映のため適宜更新し、内容構成変更を行う場合があります。ご検討の際はお問い合わせください。
- 翻訳ツール提供対象 PDF対応AI翻訳ツールの無料貸し出しサービスのご利用が可能です
概要
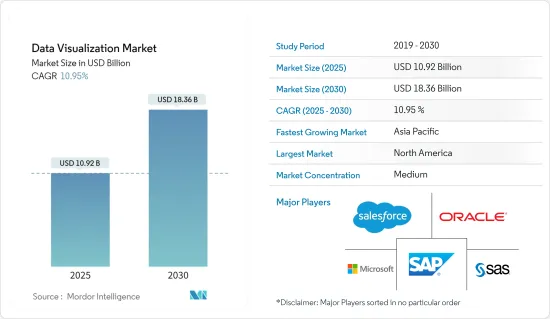
データ可視化市場規模は2025年に109億2,000万米ドルと推定され、予測期間(2025-2030年)のCAGRは10.95%で、2030年には183億6,000万米ドルに達すると予測されます。
データ可視化の新たな性質は、分析主導型ビジネスへのシフトを促し、ユーザーは、当初は表形式のレポートでしか利用できなかったデータを、さまざまな形式のグラフ表現で探索できるようになります。
主なハイライト
- 多くの業界において、企業はデータ主導の意思決定がもたらすメリットを実感しています。巨大で複雑なデータベースから有用な情報を抽出することの重要性はますます高まっています。データ可視化は、複雑な情報を解明し、理解・分析しやすい視覚的に魅力的な方法で提示するために不可欠です。企業がデータから価値ある洞察を引き出す方法を模索するにつれ、データ可視化ツールの市場は拡大し続けると思われます。意思決定者は、データを効率的に視覚化することで、パターン、動向、相関関係を見つけることができ、より十分な情報に基づいた戦略的意思決定を行うことができます。
- 拡張現実」という言葉は、ビジュアライゼーションなどのデジタルデータを物理的環境に重ねる技術を指します。市場を一変させる可能性を秘めた新たな開発は、データ可視化ツールにARを組み込むことです。ARは、現実世界の物体や環境にデータの可視化を重ね合わせることで、斬新な方法でデータを探索・分析できる没入的で魅力的な体験を消費者に与えることができます。この技術は、製造、ヘルスケア、小売を含むいくつかの分野で使用することができ、地理的コンテキストにおけるリアルタイムのデータ可視化は、判断、トレーニング、消費者との対話を改善することができます。
- 自然言語処理と会話型インターフェースの組み合わせは、データ可視化のもう一つの特徴的な市場促進要因です。自然言語処理により、コンピュータは人間の言葉を理解し、翻訳し、生成することができるため、ユーザーは自然言語による指示やクエリを使用してデータ可視化ツールとコミュニケーションすることができます。システムとの対話を通じて、ユーザーは質問したり、特定の可視化を要求したり、NLPを活用してデータを調べたりすることができます。従来のグラフィカルユーザーインターフェイスに比べて学習曲線が低いため、データ可視化をより多くの人に親しみやすくする可能性があります。さらに、スマートスピーカーやバーチャルアシスタントのような音声対応ガジェットを介したデータ主導の意思決定の可能性も生まれます。
- データのプライバシーとセキュリティは、生成・分析されるデータ量が増加し続ける中で、大きな関心事となっています。推論によると、組織や個人は、データ侵害や機密情報への不正アクセスに関連する潜在的なリスクに対する認識を深めています。このような意識の高まりが、欧州連合(EU)の一般データ保護規則(GDPR)や米国のカリフォルニア州消費者プライバシー法(CCPA)などの規制強化につながっています。これらの規制は、組織が個人データを収集、保存、処理する方法に制限を課しています。
- COVID-19は前例のない課題をもたらし、組織は危機管理と事業継続に注力する必要があった。データ可視化は、企業が主要な指標を監視し、潜在的なリスクを特定し、パンデミックの影響を軽減するための戦略を策定する上で重要な役割を果たしました。可視化によって、企業はサプライチェーンの混乱を追跡し、顧客行動の変化を分析し、事業の財務状況を監視することができました。こうした重要な洞察を可視化することで、組織は危機により効果的に対応し、事業継続性を確保するために業務を適応させることができました。また、ロシア・ウクライナ戦争がパッケージング・エコシステム全体に与えた影響もあります。
データ可視化市場の動向
小売セグメントが大きな成長を遂げる
- データ可視化により、小売業者は顧客の行動、嗜好、購買パターンについてより深い洞察を得ることができるようになった。顧客データを可視化することで、小売企業は動向を把握し、顧客のセグメンテーションを理解し、マーケティング戦略をパーソナライズすることができます。データを視覚的に表現することで、小売企業はデータに基づいた意思決定を行い、在庫管理を最適化し、顧客の需要に合った商品を提供できるようになります。このような顧客分析の改善により、よりターゲットを絞ったマーケティング・キャンペーン、より良い顧客体験、売上の増加がもたらされています。
- データ可視化は、小売企業のサプライチェーンマネジメントを強化する上で重要な役割を果たします。在庫レベル、ロジスティクス、注文処理などのサプライチェーンデータを可視化することで、小売業者はボトルネックを特定し、プロセスを最適化し、全体的な効率を向上させることができます。サプライチェーンデータをリアルタイムで可視化することで、小売業者は在庫の動きを追跡し、商品の供給状況を監視し、潜在的な混乱を特定することができます。これは、在庫管理の改善、在庫切れの削減、予測精度の向上につながります。
- データ可視化ツールを利用することで、小売業者は販売実績をリアルタイムで監視することができます。インタラクティブなダッシュボードを通じて、売上収益、コンバージョン率、平均取引額などの主要業績評価指標(KPI)を追跡することができます。販売データをリアルタイムで可視化することで、小売企業は販売動向を把握し、価格設定やプロモーションをタイムリーに調整し、問題や機会が発生したときに対処することができます。これにより、小売企業は競争市場において機敏に対応し、販売実績を向上させることができます。
- データ可視化により、小売企業は個人の嗜好や行動を理解することで、パーソナライズされた顧客体験を生み出すことができます。小売企業は、購入履歴、閲覧パターン、人口統計情報などの顧客データを可視化することで、ターゲットを絞ったレコメンデーション、パーソナライズされたオファー、カスタマイズされたマーケティングキャンペーンを提供できます。データ主導のパーソナライゼーションは、顧客満足度を高め、ロイヤルティを向上させ、リピート購入を促進します。
北米が最大の市場シェアを占める
- 北米は、同地域のエンドユーザー産業による先端技術の採用が拡大していることから、突出した市場となっています。さらに、この地域はベンダーの足場が強固であり、市場の成長に寄与しています。北米におけるデータ可視化アプリケーションは、ビッグデータの増加や小売業における分析の必要性などの要因によって牽引されています。
- 米国のデータ可視化市場は、中小規模企業で生成されるデータ量の増加により健全な成長を遂げています。例えば、デジタル情報プラットフォーム上では日々大量のデータが開発されています。IBM Corporationによると、毎日2.5億バイトのデータが生成されています。
- 2021年7月、米国沿岸警備隊はCOVID-19データ可視化ツールを採用し、ワクチン配布から作戦準備態勢まで、指揮官が情報に基づいた意思決定を行うのを支援し、新技術が警備員のプライバシーとセキュリティを損なわないことを保証するための予防措置を講じた。このプログラムは状況認識と展望を教えることを目的としており、個人に直接影響を与えるものではないはずです。
- データ主導の意思決定の導入は、カナダ市場でも様々な分野で増加しています。クラウドビジネス管理ソリューションベンダーのセージは、2021年3月に米国とカナダ市場で、Sage 300とSage 100向けのクラウド初となるSage Data and Analyticsサービス統合を開始しました。そのビジネス・インテリジェンス・ツールキットは、AIと機械学習アルゴリズムの助けを借りて、ユーザーにライブの営業ダッシュボードと詳細な損益計算書を提供することができます。このような技術革新は、調査された市場を牽引すると予想されます。
- 北米はテクノロジーベースのソリューションの重要な市場であるため、さまざまなソースからのデータを追跡し、さまざまなデータ表現にまとめて重要なビジネス上の意思決定を行う必要性が高まっています。
データ可視化産業の概要
データ可視化市場の競争は中程度です。同市場の企業は、市場での存在感と顧客基盤を拡大するために、戦略的ソリューションを提供することで革新を図っています。これにより、新たな契約を獲得し、新たな市場を開拓することができます。
- 2023年4月-Custom Charts for JiraおよびCustom Charts for Confluenceアプリケーションで有名なJiraおよびConfluenceを簡素化するアトラシアン・マーケットプレース・パートナーのAmovos SROは、製品開発組織向けポートフォリオ管理ソリューションの大手プロバイダーであるTempo Softwareによる買収に合意しました。この買収により、使いやすくカスタマイズ可能なJiraデータ可視化により、Tempoのアトラシアンベースの製品群は成長し、チームは煩雑な企業レポーティングツールに煩わされることなく、迅速にタスクを完了することに集中できるようになります。
- 2022年9月:GrafanaをAzureクラウドプラットフォームとネイティブに互換性を持たせるため、MicrosoftとGrafana Labsは戦略的契約を締結。Azure MonitorとAzure Data Explorerは、Microsoftの新しいAzure Managed Grafanaサービスがネイティブ接続を提供する2つのクラウドサービスに過ぎないです。MicrosoftのAzure Managed Grafanaのバージョン9.0には、潜在的な技術的困難をIT管理者に知らせるためのより良いアラート機能が含まれています。ゾーンの冗長性とAPIキーのサポートもこのエディションに含まれています。
その他の特典:
- エクセル形式の市場予測(ME)シート
- 3ヶ月間のアナリストサポート
目次
第1章 イントロダクション
- 調査の成果
- 調査の前提
- 調査範囲
第2章 調査手法
第3章 エグゼクティブサマリー
第4章 市場力学
- 市場概要
- 業界の魅力度-ポーターのファイブフォース分析
- 新規参入業者の脅威
- 買い手/消費者の交渉力
- 供給企業の交渉力
- 代替品の脅威
- 競争企業間の敵対関係の強さ
- バリューチェーン分析
- 市場促進要因と市場抑制要因のイントロダクション
- 市場促進要因
- データ可視化ソリューションのクラウド展開
- 迅速な意思決定へのニーズの高まり
- 市場抑制要因
- 技術に精通した熟練労働者の不足/能力不足
第5章 技術ロードマップ
第6章 市場セグメンテーション
- 組織部門別
- 経営幹部
- マーケティング
- オペレーション
- 財務
- 営業部門
- その他の組織部門
- 展開別
- オンプレミス
- クラウド/オンデマンド
- エンドユーザー別
- BFSI
- IT・通信
- 小売/eコマース
- 教育
- 製造業
- 政府機関
- その他エンドユーザー
- 地域別
- 北米
- 欧州
- アジア太平洋
- ラテンアメリカ
- 中東・アフリカ
第7章 競合情勢
- 企業プロファイル
- Salesforce.com Inc.(Tableau Software Inc.)
- SAP SE
- SAS Institute Inc.
- Microsoft Corporation
- Oracle Corporation
- TIBCO Software Inc.
- IBM Corporation
- Information Builders
- Dundas Data Visualization Inc.
- Pentaho Corporation
- InetSoft Technology Corporation
- MicroStrategy Inc.
第8章 投資分析
第9章 市場機会と今後の動向
目次
The Data Visualization Market size is estimated at USD 10.92 billion in 2025, and is expected to reach USD 18.36 billion by 2030, at a CAGR of 10.95% during the forecast period (2025-2030).
The emerging nature of data visualization encourages a shift toward analytically driven businesses, where users can explore data in various forms of graphical representation, initially only available in tabular reports.
Key Highlights
- Across many industries, businesses are realizing the benefits of data-driven decision-making. Extracting useful information from big, complicated databases is becoming increasingly important. Data visualization is essential for demystifying complex information and presenting it in a visually appealing manner that is simple to comprehend and analyze. As companies look for ways to extract valuable insights from their data, inference implies that the market for data visualization tools will keep growing. Decision-makers may find patterns, trends, and correlations by efficiently visualizing data, which helps them make more well-informed strategic decisions.
- The term "augmented reality" refers to a technology that overlays digital data, such as visualizations, on the physical environment. A new development that has the potential to change the market completely is the incorporation of AR with data visualization tools. AR can give consumers an immersive and engaging experience that enables them to explore and analyze data in novel ways by superimposing data visualizations onto real-world objects or environments. This technology can be used in several fields, including manufacturing, healthcare, and retail, where real-time data visualization in a geographical context can improve judgment, training, and consumer interaction.
- The combination of natural language processing and conversational interfaces is another distinctive market driver for data visualization. NLP enables computers to comprehend, translate, and produce human language, allowing users to communicate with data visualization tools using natural language instructions or queries. Through dialogues with the system, users can ask questions, request certain visualizations, or examine data by utilizing NLP. Due to its lower learning curve than conventional graphical user interfaces, this driver may make data visualization more approachable to a wider audience. Additionally, it creates possibilities for data-driven decision-making via voice-enabled gadgets like smart speakers and virtual assistants.
- Data privacy and security have become major concerns as the volume of data being generated and analyzed continues to increase. Inference suggests that organizations and individuals are becoming more aware of the potential risks associated with data breaches and unauthorized access to sensitive information. This heightened awareness has led to stricter regulations, such as the General Data Protection Regulation (GDPR) in the European Union and the California Consumer Privacy Act (CCPA) in the United States. These regulations impose limitations on how organizations collect, store, and process personal data.
- COVID-19 brought about unprecedented challenges, requiring organizations to focus on crisis management and business continuity. Data visualization played a vital role in helping businesses monitor key metrics, identify potential risks, and develop strategies to mitigate the impact of the pandemic. Visualizations enabled organizations to track supply chain disruptions, analyze customer behavior shifts, and monitor the financial health of their businesses. By visualizing these critical insights, organizations could respond more effectively to the crisis and adapt their operations to ensure business continuity. There has also been an impact of the Russia-Ukraine war on the overall packaging ecosystem.
Data Visualization Market Trends
Retail Segment to Witness Significant Growth
- Data visualization has enabled retailers to gain deeper insights into customer behavior, preferences, and purchasing patterns. By visualizing customer data, retailers can identify trends, understand customer segmentation, and personalize their marketing strategies. Visual representations of data help retailers make data-driven decisions, optimize inventory management, and tailor their product offerings to meet customer demands. This improved customer analytics has resulted in more targeted marketing campaigns, better customer experiences, and increased sales.
- Data visualization plays a crucial role in enhancing supply chain management for retailers. By visualizing supply chain data, including inventory levels, logistics, and order fulfillment, retailers can identify bottlenecks, optimize processes, and improve overall efficiency. Real-time visualization of supply chain data enables retailers to track inventory movement, monitor product availability, and identify potential disruptions. This leads to improved inventory management, reduced stockouts, and better forecasting accuracy.
- With the help of data visualization tools, retailers can monitor sales performance in real time. Through interactive dashboards, they can track key performance indicators (KPIs), such as sales revenue, conversion rates, and average transaction value. Real-time visualization of sales data enables retailers to identify sales trends, make timely adjustments to pricing and promotions, and address issues or opportunities as they arise. This helps retailers stay agile and responsive in a competitive market, improving sales performance.
- Data visualization empowers retailers to create personalized customer experiences by understanding individual preferences and behavior. Retailers can deliver targeted recommendations, personalized offers, and customized marketing campaigns by visualizing customer data, such as purchase history, browsing patterns, and demographic information. Data-driven personalization enhances customer satisfaction, increases loyalty, and drives repeat purchases.
North America to Hold Largest Market Share
- North America is a prominent market owing to the growing adoption of advanced technologies by end-user industries across the region. Moreover, the area has a strong foothold of vendors, contributing to the market's growth. Data visualization applications in North America are driven by factors such as growth in big data and the need for analytics in the retail sector.
- The United States data visualization market is witnessing healthy growth due to the increasing amount of data generated in small- and medium-scale firms. For instance, a massive amount of data is being developed on digital information platforms every day. According to IBM Corporation, 2.5 quintillion bytes of data are generated daily.
- In July 2021, the United States Coast Guard adopted COVID-19 data visualization tools to assist commanders in making informed decisions on everything from vaccine distribution to operational readiness and has taken precautions to guarantee that the new technologies do not compromise guardsmen's privacy and security. The program aims to teach situational awareness and perspective, and it should not directly impact individuals.
- The implementation of data-driven decision-making is also rising in Canadian markets across various sectors. Cloud business management solutions vendor Sage launched its cloud-first Sage Data and Analytics service integration for Sage 300 and Sage 100 in the US and Canadian markets in March 2021. Its business intelligence toolkit can provide users with live sales dashboards and detailed P&L reports with the help of AI and machine learning algorithms. Such innovations are expected to drive the studied market.
- An increasing need to track data from various sources and compile it into different data representations to make critical business decisions can be observed in North America, as this region is a significant market for technology-based solutions.
Data Visualization Industry Overview
The data visualization market is moderately competitive. The players in the market are innovating in providing strategic solutions to increase their market presence and customer base. This enables them to secure new contracts and tap new markets.
- April 2023 - Amovos SRO, an Atlassian Marketplace Partner that simplifies Jira and Confluence with its well-known Custom Charts for Jira and Custom Charts for Confluence apps, had agreed to be acquired by Tempo Software, a leading provider of portfolio management solutions for product development organizations. With Jira data visualizations that are simple to use and customizable thanks to the purchase, Tempo's Atlassian-based product suite will grow, allowing teams to concentrate on finishing tasks swiftly rather than fumbling with cumbersome corporate reporting tools.
- September 2022: To make Grafana natively compatible with the Azure cloud platform, Microsoft and Grafana Labs established a strategic agreement. Azure Monitor and Azure Data Explorer are just two cloud services that Microsoft's new Azure Managed Grafana service offers native connections. Version 9.0 of Microsoft's Azure Managed Grafana includes a better alerting feature to inform IT administrators of potential technical difficulties. Zone redundancy and support for an API key are also included in this edition.
Additional Benefits:
- The market estimate (ME) sheet in Excel format
- 3 months of analyst support
TABLE OF CONTENTS
1 INTRODUCTION
- 1.1 Study Deliverables
- 1.2 Study Assumptions
- 1.3 Scope of the Study
2 RESEARCH METHODOLOGY
3 EXECUTIVE SUMMARY
4 MARKET DYNAMICS
- 4.1 Market Overview
- 4.2 Industry Attractiveness - Porter's Five Forces Analysis
- 4.2.1 Threat of New Entrants
- 4.2.2 Bargaining Power of Buyers/Consumers
- 4.2.3 Bargaining Power of Suppliers
- 4.2.4 Threat of Substitute Products
- 4.2.5 Intensity of Competitive Rivalry
- 4.3 Value Chain Analysis
- 4.4 Introduction to Market Drivers and Restraints
- 4.5 Market Drivers
- 4.5.1 Cloud Deployment of Data Visualization Solutions
- 4.5.2 Increasing Need for Quick Decision Making
- 4.6 Market Restraints
- 4.6.1 Lack of Tech Savvy and Skilled Workforce/Inability
5 TECHNOLOGY ROADMAP
6 MARKET SEGMENTATION
- 6.1 Organizational Department
- 6.1.1 Executive Management
- 6.1.2 Marketing
- 6.1.3 Operations
- 6.1.4 Finance
- 6.1.5 Sales
- 6.1.6 Other Organizational Departments
- 6.2 Deployment Mode
- 6.2.1 On-premise
- 6.2.2 Cloud/On-demand
- 6.3 End User
- 6.3.1 BFSI
- 6.3.2 IT and Telecommunication
- 6.3.3 Retail/E-commerce
- 6.3.4 Education
- 6.3.5 Manufacturing
- 6.3.6 Government
- 6.3.7 Other End Users
- 6.4 Geography
- 6.4.1 North America
- 6.4.2 Europe
- 6.4.3 Asia-Pacific
- 6.4.4 Latin America
- 6.4.5 Middle East and Africa
7 COMPETITIVE LANDSCAPE
- 7.1 Company Profiles
- 7.1.1 Salesforce.com Inc. (Tableau Software Inc.)
- 7.1.2 SAP SE
- 7.1.3 SAS Institute Inc.
- 7.1.4 Microsoft Corporation
- 7.1.5 Oracle Corporation
- 7.1.6 TIBCO Software Inc.
- 7.1.7 IBM Corporation
- 7.1.8 Information Builders
- 7.1.9 Dundas Data Visualization Inc.
- 7.1.10 Pentaho Corporation
- 7.1.11 InetSoft Technology Corporation
- 7.1.12 MicroStrategy Inc.
8 INVESTMENT ANALYSIS
9 MARKET OPPORTUNITIES AND FUTURE TRENDS
- 発行日
- 発行
- Mordor Intelligence
- ページ情報
- 英文 120 Pages
- 納期
- 2~3営業日


