
エンタープライズデータ可視化プラットフォームの市場機会、成長促進要因、産業動向分析、2025年~2034年予測
Enterprise Data Visualization Platform Market Opportunity, Growth Drivers, Industry Trend Analysis, and Forecast 2025 - 2034- 発行日
- ページ情報
- 英文 170 Pages
- 納期
- 2~3営業日
- 商品コード
- 1755246
- カスタマイズ可能 お客様のご希望に応じて、既存データの加工や未掲載情報(例:国別セグメント)の追加などの対応が可能です。詳細はお問い合わせください。
- 翻訳ツール提供対象 PDF対応AI翻訳ツールの無料貸し出しサービスのご利用が可能です
概要
エンタープライズデータ可視化プラットフォームの世界市場規模は、2024年に88億米ドルとなり、デジタルトランスフォーメーションへの取り組みの加速とクラウドベースのアナリティクスに対する需要の高まりにより、CAGR 14.1%で成長し、2034年には277億米ドルに達すると推定されます。
組織がデータ中心主義をますます重視するようになるにつれ、リアルタイムで実用的な洞察を可能にするツールへのシフトが顕著になっています。企業は静的なレポーティングから脱却し、俊敏性、コラボレーション、情報に基づく意思決定を促進する動的なプラットフォームを採用しつつあります。可視化ツールに人工知能と機械学習機能が統合されたことで、可視化ツールは予測的洞察と異常検知のエンジンへとさらに変貌を遂げつつあります。これらの進歩により、企業は市場環境の変化に迅速に対応できるようになりました。一元化されたシステムは、断片化されたデータソースの橋渡しをし、部門間の可視性を向上させ、戦略的イニシアチブを促進します。スケーラブルでコスト効率の高いソリューションを提供するクラウドネイティブツールにより、企業は進化するビジネス環境に適応できるようになり、データの可視化は卓越したオペレーションと競合成長の要となっています。
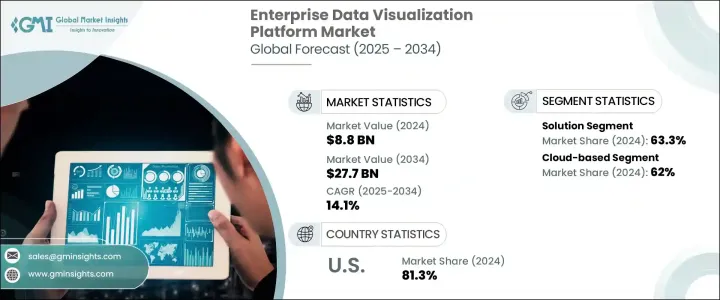
2024年には、クラウドベースのプラットフォームが62%のシェアを占め、2025年から2034年にかけてCAGR 14.9%で成長すると予測されています。これらのプラットフォームは比類のない柔軟性を提供し、分散したチームやダイナミックなビジネスニーズをサポートします。さまざまなシステムと迅速に統合し、オンデマンドで洞察を提供できることから、拡張性の高いリアルタイム分析を求める企業に選ばれています。組み込みアナリティクス、AIによる探索機能、自動スケーリングなどの機能により、従来のインフラストラクチャのような複雑さを伴うことなく、強力なパフォーマンスを実現します。
| 市場範囲 | |
|---|---|
| 開始年 | 2024 |
| 予測年 | 2025-2034 |
| 開始金額 | 88億米ドル |
| 予測金額 | 277億米ドル |
| CAGR | 14.1% |
ソリューション分野のシェアは63.3%で、2034年までのCAGRは15%で成長します。これらのプラットフォームは、深いアナリティクス機能と直感的なデザインを融合させ、ユーザーが戦略上と業務上の意思決定を行えるようにします。デジタルトランスフォーメーションプロジェクトに導入されることが多いこれらのソリューションにより、企業はインタラクティブなモデルや事前に構築されたテンプレートを使用して、レポートの合理化、オペレーションの監視、顧客インサイトの獲得を行うことができます。ローコードおよびノーコード機能により、幅広いユーザーによる導入が可能になり、部門を超えたチームによるダッシュボードの作成、ITへの依存度の低減、データファースト文化の醸成を支援します。
北米のエンタープライズデータ可視化プラットフォーム市場は81.3%のシェアを占め、2024年には105億米ドルを生み出します。同市場の成長を支えているのは、高度にデジタル化されたエコシステム、インテリジェンスツールの普及、テクノロジーイノベーターの存在感です。企業は高度なアナリティクスとクラウドプラットフォームへの投資を続け、業務の俊敏性と戦略的な連携を推進しています。成熟したインフラと豊富なデータ人材が、最先端の可視化技術を開発・展開するための最重要拠点となっています。
世界のエンタープライズデータ可視化プラットフォーム市場でイノベーションを推進している主な企業は、Salesforce, MicroStrategy, Qlik, Amazon Web Services (AWS), Google, IBM Corporation, SAP SE, Microsoft Corporation, Domo, and Oracle Corporation.などです。エンタープライズデータ可視化プラットフォーム市場の主要企業は、イノベーション、クラウドの拡大、AIの統合に注力し、市場での地位を固めています。その多くは、予測分析、自然言語処理、自動異常検知といったAI主導の機能で自社のプラットフォームを強化し、ユーザーエクスペリエンスと意思決定能力を向上させています。ベンダーは、クラウドネイティブアーキテクチャと組み込みアナリティクスに投資しています。組織は、ローコードによるカスタマイズや直感的なインターフェイスを提供することで使いやすさを優先し、事業部門全体への幅広い採用を可能にしています。
目次
第1章 調査手法と範囲
第2章 エグゼクティブサマリー
第3章 業界考察
- エコシステム分析
- サプライヤーの情勢
- テクノロジープロバイダー
- システムインテグレーター
- クラウドおよびインフラストラクチャプロバイダー
- 最終用途
- トランプ政権による関税への影響
- 貿易への影響
- 貿易量の混乱
- 報復措置
- 業界への影響
- 供給側の影響(原材料)
- 主要原材料の価格変動
- サプライチェーンの再構築
- 生産コストへの影響
- 需要側の影響(顧客へのコスト)
- 最終市場への価格伝達
- 市場シェアの動向
- 消費者の反応パターン
- 供給側の影響(原材料)
- 影響を受ける主要企業
- 戦略的な業界対応
- サプライチェーンの再構成
- 価格設定と製品戦略
- 政策関与
- 展望と今後の検討事項
- 貿易への影響
- 利益率分析
- テクノロジーとイノベーションの情勢
- 特許分析
- ユースケース
- 主なニュースと取り組み
- 規制情勢
- 影響要因
- 促進要因
- 急速なデジタル変革
- ビジネスプロセスにおけるAIと機械学習の統合
- ロボティック・プロセス・オートメーション(RPA)の導入拡大
- クラウドの導入とSaaSの拡張
- 業界の潜在的リスク&課題
- 高い導入コスト
- データのプライバシーとセキュリティに関する懸念
- 促進要因
- 成長可能性分析
- ポーター分析
- PESTEL分析
第4章 競合情勢
- イントロダクション
- 企業の市場シェア分析
- 競合ポジショニングマトリックス
- 戦略的展望マトリックス
第5章 市場推計・予測:コンポーネント別、2021年~2034年
- 主要動向
- ソリューション
- サービス
- 専門サービス
- マネージドサービス
第6章 市場推計・予測:展開モデル別、2021年~2034年
- 主要動向
- クラウドベース
- オンプレミス
第7章 市場推計・予測:組織規模別、2021年~2034年
- 主要動向
- 大企業
- 中小企業
第8章 市場推計・予測:用途別、2021年~2034年
- 主要動向
- ビジネスインテリジェンス
- パフォーマンス監視
- リスクとコンプライアンス
- 販売およびマーケティング分析
- 運用管理
第9章 市場推計・予測:最終用途別、2021年~2034年
- 主要動向
- BFSI
- ヘルスケア
- 小売り
- ITおよび通信
- 教育
- 製造業
- 運輸・物流
- その他
第10章 市場推計・予測:地域別、2021年~2034年
- 主要動向
- 北米
- 米国
- カナダ
- 欧州
- 英国
- ドイツ
- フランス
- イタリア
- スペイン
- ロシア
- 北欧諸国
- アジア太平洋地域
- 中国
- インド
- 日本
- 韓国
- オーストラリア・ニュージーランド
- 東南アジア
- ラテンアメリカ
- ブラジル
- メキシコ
- アルゼンチン
- 中東・アフリカ
- アラブ首長国連邦
- サウジアラビア
- 南アフリカ
第11章 企業プロファイル
- Amazon Web Services(AWS)
- Alteryx
- Board International
- Domo
- Dundas BI
- IBM Corporation
- InetSoft Technology
- Infor Birst
- Microsoft Corporation
- MicroStrategy
- Oracle Corporation
- Qlik
- Salesforce
- SAP SE
- Sisense
- ThoughtSpot
- TIBCO Software
- Yellowfin
- Zoho Analytics
目次
The Global Enterprise Data Visualization Platform Market was valued at USD 8.8 billion in 2024 and is estimated to grow at a CAGR of 14.1% to reach USD 27.7 billion by 2034, driven by the acceleration of digital transformation efforts and a rising demand for cloud-based analytics. As organizations increasingly focus on becoming data-centric, there's a notable shift toward tools that enable real-time, actionable insights. Businesses are moving away from static reporting and adopting dynamic platforms that foster agility, collaboration and informed decision-making. The integration of artificial intelligence and machine learning capabilities into visualization tools is further transforming them into engines of predictive insights and anomaly detection. These advancements allow enterprises to respond swiftly to shifting market conditions. Centralized systems now bridge fragmented data sources, improving visibility across departments and facilitating strategic initiatives. With cloud-native tools offering scalable and cost-effective solutions, enterprises are better equipped to adapt to evolving business environments, making data visualization a cornerstone of operational excellence and competitive growth.
In 2024, cloud-based platforms held 62% share and is forecasted to grow at a CAGR of 14.9% between 2025 and 2034. These platforms offer unmatched flexibility, supporting decentralized teams and dynamic business needs. Their ability to integrate quickly with various systems and provide on-demand insights make them the preferred choice for organizations seeking scalable, real-time analytics. With features like embedded analytics, AI-enhanced exploration, and auto-scaling, they deliver powerful performance without the complexity of traditional infrastructure.
| Market Scope | |
|---|---|
| Start Year | 2024 |
| Forecast Year | 2025-2034 |
| Start Value | $8.8 Billion |
| Forecast Value | $27.7 Billion |
| CAGR | 14.1% |
The solution segment held 63.3% share and will grow at 15% CAGR through 2034. These platforms blend deep analytics functionality with intuitive design, enabling users to drive both strategic and operational decisions. Often deployed in digital transformation projects, these solutions allow enterprises to streamline reporting, monitor operations, and gain customer insights using interactive models and pre-built templates. Low-code and no-code features enable broader user adoption, helping teams across departments create their dashboards, reduce IT dependency, and foster a data-first culture.
North America Enterprise Data Visualization Platform Market held 81.3% share and generated USD 10.5 billion in 2024. The market's growth is supported by a highly digitized ecosystem, widespread use of intelligence tools, and a strong presence of technology innovators. Companies continue to invest in advanced analytics and cloud platforms to drive operational agility and strategic alignment. The mature infrastructure and abundant data talent make it a prime hub for developing and deploying cutting-edge visualization technologies.
Key players driving innovation in the Global Enterprise Data Visualization Platform Market include Salesforce, MicroStrategy, Qlik, Amazon Web Services (AWS), Google, IBM Corporation, SAP SE, Microsoft Corporation, Domo, and Oracle Corporation. Leading companies in the enterprise data visualization platform market focus on innovation, cloud expansion, and AI integration to solidify their market position. Many are enhancing their platforms with AI-driven features such as predictive analytics, natural language processing, and automated anomaly detection to improve user experience and decision-making capabilities. Vendors are investing in cloud-native architectures and embedded analytics. Organizations prioritize ease of use by offering low-code customization and intuitive interfaces, enabling broader adoption across business units.
Table of Contents
Chapter 1 Methodology & Scope
- 1.1 Research design
- 1.1.1 Research approach
- 1.1.2 Data collection methods
- 1.2 Base estimates and calculations
- 1.2.1 Base year calculation
- 1.2.2 Key trends for market estimates
- 1.3 Forecast model
- 1.4 Primary research & validation
- 1.4.1 Primary sources
- 1.4.2 Data mining sources
- 1.5 Market definitions
Chapter 2 Executive Summary
- 2.1 Industry 3600 synopsis, 2021 - 2034
Chapter 3 Industry Insights
- 3.1 Industry ecosystem analysis
- 3.2 Supplier landscape
- 3.2.1 Technology providers
- 3.2.2 System integrators
- 3.2.3 Cloud and infrastructure providers
- 3.2.4 End use
- 3.3 Impact of Trump administration tariffs
- 3.3.1 Trade impact
- 3.3.1.1 Trade volume disruptions
- 3.3.1.2 Retaliatory measures
- 3.3.2 Impact on industry
- 3.3.2.1 Supply-side impact (raw materials)
- 3.3.2.1.1 Price volatility in key materials
- 3.3.2.1.2 Supply chain restructuring
- 3.3.2.1.3 Production cost implications
- 3.3.2.2 Demand-side impact (Cost to customers)
- 3.3.2.2.1 Price transmission to end markets
- 3.3.2.2.2 Market share dynamics
- 3.3.2.2.3 Consumer response patterns
- 3.3.2.1 Supply-side impact (raw materials)
- 3.3.3 Key companies impacted
- 3.3.4 Strategic industry responses
- 3.3.4.1 Supply chain reconfiguration
- 3.3.4.2 Pricing and product strategies
- 3.3.4.3 Policy engagement
- 3.3.5 Outlook & future considerations
- 3.3.1 Trade impact
- 3.4 Profit margin analysis
- 3.5 Technology & innovation landscape
- 3.6 Patent analysis
- 3.7 Use cases
- 3.8 Key news & initiatives
- 3.9 Regulatory landscape
- 3.10 Impact forces
- 3.10.1 Growth drivers
- 3.10.1.1 Rapid digital transformation
- 3.10.1.2 Integration of AI and machine learning in business processes
- 3.10.1.3 Growing adoption of Robotic Process Automation (RPA)
- 3.10.1.4 Cloud adoption and SaaS expansion
- 3.10.2 Industry pitfalls & challenges
- 3.10.2.1 High implementation costs
- 3.10.2.2 Data privacy and security concerns
- 3.10.1 Growth drivers
- 3.11 Growth potential analysis
- 3.12 Porter's analysis
- 3.13 PESTEL analysis
Chapter 4 Competitive Landscape, 2024
- 4.1 Introduction
- 4.2 Company market share analysis
- 4.3 Competitive positioning matrix
- 4.4 Strategic outlook matrix
Chapter 5 Market Estimates & Forecast, By Component, 2021 - 2034 ($Mn)
- 5.1 Key trends
- 5.2 Solution
- 5.3 Services
- 5.3.1 Professional services
- 5.3.2 Managed services
Chapter 6 Market Estimates & Forecast, By Deployment Model, 2021 - 2034 ($Mn)
- 6.1 Key trends
- 6.2 Cloud-based
- 6.3 On-premises
Chapter 7 Market Estimates & Forecast, By Organization Size, 2021 - 2034 ($Mn)
- 7.1 Key trends
- 7.2 Large Enterprise
- 7.3 SME
Chapter 8 Market Estimates & Forecast, By Application, 2021 - 2034 ($Mn)
- 8.1 Key trends
- 8.2 Business intelligence
- 8.3 Performance monitoring
- 8.4 Risk and compliance
- 8.5 Sales and marketing analytics
- 8.6 Operations management
Chapter 9 Market Estimates & Forecast, By End Use, 2021 - 2034 ($Mn)
- 9.1 Key trends
- 9.2 BFSI
- 9.3 Healthcare
- 9.4 Retail
- 9.5 IT & telecom
- 9.6 Education
- 9.7 Manufacturing
- 9.8 Transportation & logistics
- 9.9 Others
Chapter 10 Market Estimates & Forecast, By Region, 2021 - 2034 ($Mn)
- 10.1 Key trends
- 10.2 North America
- 10.2.1 U.S.
- 10.2.2 Canada
- 10.3 Europe
- 10.3.1 UK
- 10.3.2 Germany
- 10.3.3 France
- 10.3.4 Italy
- 10.3.5 Spain
- 10.3.6 Russia
- 10.3.7 Nordics
- 10.4 Asia Pacific
- 10.4.1 China
- 10.4.2 India
- 10.4.3 Japan
- 10.4.4 South Korea
- 10.4.5 ANZ
- 10.4.6 Southeast Asia
- 10.5 Latin America
- 10.5.1 Brazil
- 10.5.2 Mexico
- 10.5.3 Argentina
- 10.6 MEA
- 10.6.1 UAE
- 10.6.2 Saudi Arabia
- 10.6.3 South Africa
Chapter 11 Company Profiles
- 11.1 Amazon Web Services (AWS)
- 11.2 Alteryx
- 11.3 Board International
- 11.4 Domo
- 11.5 Dundas BI
- 11.6 Google
- 11.7 IBM Corporation
- 11.8 InetSoft Technology
- 11.9 Infor Birst
- 11.10 Microsoft Corporation
- 11.11 MicroStrategy
- 11.12 Oracle Corporation
- 11.13 Qlik
- 11.14 Salesforce
- 11.15 SAP SE
- 11.16 Sisense
- 11.17 ThoughtSpot
- 11.18 TIBCO Software
- 11.19 Yellowfin
- 11.20 Zoho Analytics
- 発行日
- 発行
- Global Market Insights Inc.
- ページ情報
- 英文 170 Pages
- 納期
- 2~3営業日