
|
市場調査レポート
商品コード
1906888
食品添加物:市場シェア分析、業界動向と統計、成長予測(2026年~2031年)Food Additives - Market Share Analysis, Industry Trends & Statistics, Growth Forecasts (2026 - 2031) |
||||||
カスタマイズ可能
適宜更新あり
|
|||||||
| 食品添加物:市場シェア分析、業界動向と統計、成長予測(2026年~2031年) |
|
出版日: 2026年01月12日
発行: Mordor Intelligence
ページ情報: 英文 256 Pages
納期: 2~3営業日
|

概要
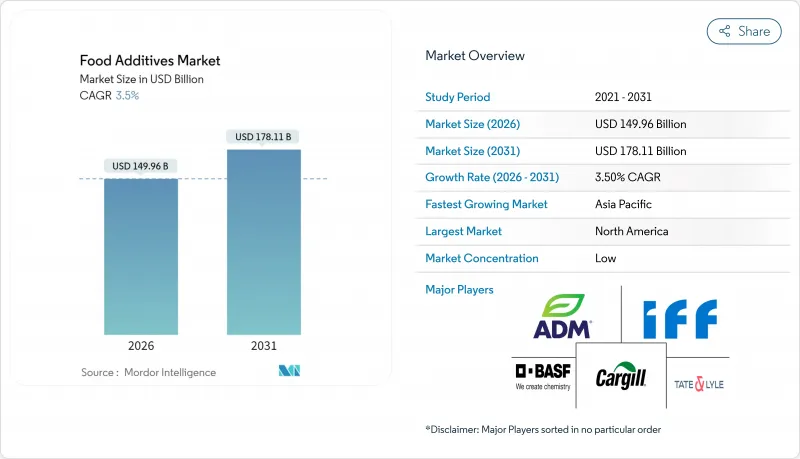
世界の食品添加物市場は、2025年の1,448億9,000万米ドルから2026年には1,499億6,000万米ドルへ成長し、2026年から2031年にかけてCAGR 3.5%で推移し、2031年には1,781億1,000万米ドルに達すると予測されています。
この着実な成長は、業界の成熟度と、天然素材を求める消費者需要と現代食品加工の技術的要件との複雑な相互作用を反映しています。市場の動向は、量重視の拡大から価値志向の革新への根本的な転換を示しており、メーカーは純粋なコスト最適化よりも、素材の機能性と消費者受容性を優先しています。業界では、クリーンラベル原料や天然食品添加物への大幅な移行が進んでおり、これは変化する消費者嗜好と規制要件を反映しています。メーカーは、非遺伝子組み換え(GMOフリー)、天然保存料、有機と表示可能な添加物の開発に注力しており、天然代替品の市場成長を大きく牽引しています。この動向は、着色料、酸味料、水溶性多糖類などのカテゴリーで特に顕著です。
世界の食品添加物市場の動向と洞察
加工食品・コンビニエンスフードの需要増加
都市化の進展と中産階級人口の増加に伴い、世界中の先進国・発展途上地域において加工食品・包装食品への需要が高まっており、これが世界の食品添加物需要の増加につながっています。製品革新と商品魅力の向上により、消費者の間でベーカリー製品、菓子類、飲料などの加工製品の消費が増加しています。若年層消費者や働く世代は、冷たい飲み物、エナジードリンクなどの加工飲料を好んで消費する傾向にあります。消費者は、レトルト食品や加工食品の食感、風味、そして総合的な感覚体験の向上に惹かれており、その結果、食品添加物、人工成分、砂糖、保存料などに対する需要が高まっています。世界保健機関(WHO)とインド国際経済関係研究評議会(ICRIER)による2023年の報告書では、インドにおいて過去10年間で超加工食品の販売が急激に増加していることが明らかになりました。これらの超加工食品には、保存期間延長のための糖分や脂肪、人工着色料や香料、人工甘味料が含まれており、全国的にレトルト食品や糖分を含む飲料の消費が増加していることから、今後数年間においても食品添加物の需要を支える可能性が高いと考えられます。
天然素材・クリーンラベル製品への需要増加
認識可能な原材料への需要の高まりは、製品開発を変革しています。メーカーは合成添加物から天然由来の代替品へと移行しており、この変化には製品の機能性を維持しつつ原材料の透明性を確保するための包括的な再設計戦略が求められます。企業は原材料調達から製造パラメータの調整に至るまで、生産プロセス全体を見直す必要があります。植物由来および微生物由来の保存料が有望な選択肢として台頭しており、Galactic社などの企業は、保存期間の延長と食品安全性の確保、規制要件の遵守を同時に実現するソリューションを開発しています。これらの天然保存料は、様々な食品マトリックスや保存条件における有効性を検証するため、広範な試験を経ています。クリーンラベルの動向は、バイオテクノロジー企業にとって、天然性と機能性の両方の要件を満たす発酵由来成分を生産する機会を生み出しており、合成添加物のプレミアム代替品としての地位を確立しています。これらの発酵プロセスは、製品の安定性と安全性を維持しながら、従来の化学保存料を効果的に代替できる、一貫した高品質の成分を生産するよう最適化されています。
厳格な規制枠組み
規制の複雑さは、管轄区域ごとに異なる承認プロセスを通じて市場参入企業に影響を与え、世界の製品発売の障壁となり、コンプライアンスコストを増加させます。企業は事業を展開する各市場において、様々な規制枠組み、文書化要件、安全基準に対応しなければなりません。米国食品医薬品局(FDA)による食品添加物エリスロシン(赤色3号)の認可取り消しは、食品添加物に対する監視強化を示しており、企業には包括的な安全性データベースと規制専門知識の維持が求められます。企業は規制変更を継続的に監視し、コンプライアンス手順を更新するとともに、製品の安全性主張を裏付ける科学的な調査への投資が必要です。カリフォルニア州における学校での特定化学添加物使用禁止など、州レベルの規制は、製品の処方設計や市場参入戦略に影響を与える複数のコンプライアンス要件を生み出しています。こうした多様な要件により、地域ごとの製品改良や別個のサプライチェーン管理システムが必要となります。この規制環境は、企業が研究開発ではなくコンプライアンスに多大なリソースを割くことを余儀なくされるため、運営コストと複雑性を増大させると同時に、添加物開発の革新を制約しています。
セグメント分析
バルク甘味料は2025年に54.62%の市場シェアを占め、焼き菓子や加工食品を含む飲食品調合において必須成分として機能しております。食品着色料は2026年から2031年にかけて6.65%のCAGRで最も高い成長率を示しており、これは視覚的に魅力的な製品への消費者嗜好の高まりと、合成品から天然代替品への移行が要因となっております。これらの着色料は、科学的検証と定められた1日当たりの許容摂取量を通じて、確立された安全基準を維持しております。保存料は、食品安全要件と抗菌保護を必要とする延長されたサプライチェーンにより、安定した需要を維持しております。乳化剤は、高度な食感制御を必要とする植物由来食品や加工食品の拡大に伴い、重要性を増しております。
天然着色料は、コストや加工上の課題があるにもかかわらず、合成化学物質を含まない製品を好む消費者が増加していることから、市場価値を高めています。酵素は製品ポートフォリオにおいて強い成長可能性を示しています。抗結剤および酸味料は粉末食品や加工食品用途で特定の機能を果たしており、二酸化ケイ素とリン酸カルシウムは食品カテゴリーを問わず広く認可された抗結剤として使用されています。ハイドロコロイドは食感改良において重要性を増しており、特に低脂肪製品や植物由来製品において、メーカーが改良された口当たりと安定性を追求する中でその需要が高まっています。
乾燥形態添加物は、優れた貯蔵安定性、輸送効率、工業的食品加工工程における取り扱い容易さから、2025年には62.95%の市場シェアを占めます。液体添加物は、精密な投与量管理、即時溶解性、液体食品システムへの統合を必要とする用途に牽引され、2026年から2031年にかけてCAGR5.95%で成長が見込まれます。乾燥添加剤の優位性は、製造上の実用的な観点に起因します。粉末形態は液体形態と比較し、長期保存性、輸送コストの低減、在庫管理の簡素化を実現します。固結防止剤は水分による固結を抑制し粉末の流動性を維持し、特に炭酸カルシウム系溶液は過酷な条件下での固結低減に潜在性を示しています。
液体添加剤は、即時の分散性と均一な分布が製品品質に不可欠な飲料用途や特殊食品加工分野で採用が増加しています。機能性飲料や液体栄養製品の拡大に伴い、味・外観・安定性に影響を与えずに効果的に統合できる液体添加剤形態の需要が高まっています。レシチンなどの乳化剤は、水系と油性原料の結合に重要な役割を果たし、乳児用調製粉乳から焼き菓子、スプレッドに至る製品群で均一な食感を維持します。カプセル化技術や徐放システムの進歩により、乾燥添加剤は粉末形態の取り扱い利点を維持しつつ液体のような性能を実現し、機能性と操業効率のバランスが取れたハイブリッドソリューションが生まれています。
食品添加物市場レポートでは、業界を製品タイプ(保存料、バルク甘味料、糖代替品、乳化剤など)、形態(乾燥・液体)、原料源(天然・合成)、用途(ベーカリー・菓子類、乳製品・デザート、飲料など)、地域(北米、欧州、アジア太平洋など)に分類しております。市場規模は、上記の全セグメントについて米ドル価値で提示されています。
地域別分析
北米地域は2025年に30.98%の市場シェアを占めており、これは先進的な食品加工インフラ、包括的な安全基準、そしてプレミアム添加物ソリューションに対する消費者の受容性によって牽引されています。同地域の確立された規制枠組みは製品開発を促進すると同時に、天然・機能性原料におけるイノベーションを奨励しています。FDAによる食品化学物質の市販後評価の強化は、同地域の安全への取り組みを示す一方で、新規合成添加物の参入を制限する可能性もあります。北米の食品メーカーは、カーギル社の高甘味度甘味料ポートフォリオ(エバースイート(R)、トゥルービア(R)、ビアテック(R)など)に代表されるクリーンラベル製剤に注力しています。バイオテクノロジーと精密発酵技術における同地域の専門性は、高コストや規制要件による市場参入の課題があるにもかかわらず、先進的な添加物開発を可能にしています。
アジア太平洋地域は2026年から2031年にかけてCAGR4.45%と最も高い成長率を示しており、都市化、中産階級の拡大、加工食品消費の増加がこれを支えています。中国国家衛生健康委員会が2024年に30の新規食品添加物を承認したことは、同地域主要市場における強力な規制支援を示しています。日本の食品加工業界は1,900億米ドル規模であり、調理済み食品への需要拡大や安全基準の強化といった地域的な動向を反映しています。製造効率の高さと原材料の安定供給により、同地域は国内外市場向けの戦略的生産拠点としての優位性を有しています。
欧州は厳格な規制、天然原料への嗜好、持続可能な食品生産手法により市場での差別化を維持しております。欧州委員会による各種発酵技術を含むバイオベースのイノベーション支援は、同地域の持続可能な添加物開発を強化しております。EU全域での規制調和は、厳格なコンプライアンス基準にもかかわらず市場アクセス上の利点を提供します。有機・天然製品への注力は、機能性要件と持続可能性基準の両方を満たす添加物に機会を生み出しております。
その他の特典:
- エクセル形式の市場予測(ME)シート
- アナリストによる3ヶ月間のサポート
よくあるご質問
目次
第1章 イントロダクション
- 調査の前提条件と市場の定義
- 調査範囲
第2章 調査手法
第3章 エグゼクティブサマリー
第4章 市場情勢
- 市場概要
- 市場促進要因
- 加工食品およびコンビニエンスフードに対する需要の高まり
- 自然派・クリーンラベル製品への需要増加
- 保存期間の延長と保存ニーズの高まり
- 食品加工における技術的進歩
- 強化・機能性飲料への需要拡大
- 味と食感に対する消費者の嗜好の変化
- 市場抑制要因
- 厳格な規制枠組み
- 高い研究開発費とイノベーションコスト
- 表示に関する課題と透明性への圧力
- 食品添加物の有害な影響
- サプライチェーン分析
- 規制の見通し
- ポーターのファイブフォース
- 新規参入業者の脅威
- 買い手の交渉力/消費者
- 供給企業の交渉力
- 代替品の脅威
- 競争企業間の敵対関係
第5章 市場規模と成長予測
- 製品タイプ別
- 保存料
- バルク甘味料
- 砂糖代替品
- 乳化剤
- 固結防止剤
- 酵素
- ハイドロコロイド
- 食品用香料および調味料
- 食品着色料
- 酸味料
- 形態別
- 乾燥
- 液体
- 由来別
- 天然
- 合成
- 用途別
- ベーカリーおよび菓子類
- 乳製品およびデザート
- 飲料
- 肉および肉製品
- スープ、ソース、ドレッシング
- その他の用途
- 地域別
- 北米
- 米国
- カナダ
- メキシコ
- その他北米地域
- 欧州
- 英国
- ドイツ
- スペイン
- フランス
- イタリア
- ロシア
- その他欧州地域
- アジア太平洋地域
- 中国
- インド
- 日本
- オーストラリア
- その他アジア太平洋地域
- 南米
- ブラジル
- アルゼンチン
- その他南米
- 中東・アフリカ
- サウジアラビア
- 南アフリカ
- その他中東・アフリカ地域
- 北米
第6章 競合情勢
- 市場集中度
- 戦略的動向
- 企業ランキング分析
- 企業プロファイル
- Cargill Incorporated
- Archer Daniels Midland Company
- BASF SE
- International Flavors and Fragrances Inc.
- Tate & Lyle PLC
- Kerry Group PLC
- Ajinomoto Co. Inc.
- Givaudan SA
- Corbion NV
- Eastman Chemical Company
- Ingredion Incorporated
- Chr. Hansen Holding A/S
- DSM-Firmenich
- Symrise AG
- Jungbunzlauer Suisse AG
- Roquette Freres S.A.
- Celanese Corporation
- Lycored Corp.
- Kemin Industries
- GNT Group

