|
|
市場調査レポート
商品コード
1690876
リモートセンシング衛星:市場シェア分析、産業動向・統計、成長予測(2025年~2030年)Remote Sensing Satellites - Market Share Analysis, Industry Trends & Statistics, Growth Forecasts (2025 - 2030) |
||||||
|
|||||||
カスタマイズ可能
適宜更新あり
|
|||||||

| リモートセンシング衛星:市場シェア分析、産業動向・統計、成長予測(2025年~2030年) |
|
出版日: 2025年03月18日
発行: Mordor Intelligence
ページ情報: 英文 203 Pages
納期: 2~3営業日
|

全表示
- 概要
- 目次
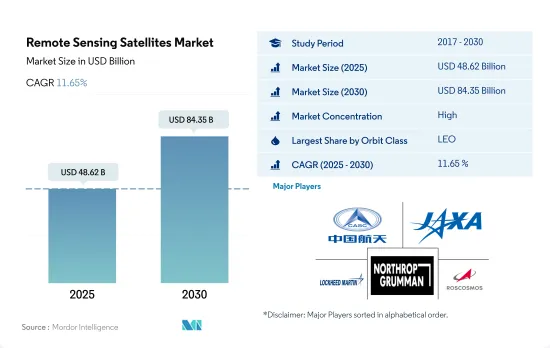
リモートセンシング衛星の市場規模は2025年に486億2,000万米ドルと推定・予測され、2030年には843億5,000万米ドルに達し、予測期間(2025-2030年)のCAGRは11.65%で成長すると予測されています。
LEO衛星の需要が市場を牽引し、2029年には79.5%のシェアを記録
- 様々なリモートセンシング衛星が、その設計や主な目的に応じて様々な距離で地球を周回しています。これらの衛星は、目的や用途に応じて打ち上げられたり、異なる軌道に投入されたりします。軌道に投入される衛星にはそれぞれ利点と課題があり、カバー範囲の拡大やエネルギー効率の低下などがあります。
- 2017年から2022年の間に打ち上げられたリモートセンシング衛星の約90%*は、地球観測や科学などの用途のために低軌道に配置されました。これは、この軌道が地球に近いため、空間的な高解像度画像を遅延なく送信するのに役立つからです。したがって、この軌道の利点の増加に伴い、LEO軌道に配備されるこれらの衛星の需要は予測期間中に増加すると予想されます。同様に、2017~2022年の間に、MEO軌道で打ち上げられた56機の衛星のうち、46機はナビゲーション/全地球測位目的で建設されました。GEO軌道の147衛星のうち、105衛星が通信用途に配備されています。
- 電子情報、地球科学/気象学、レーザーイメージング、光学イメージング、気象学などの目的でリモートセンシング衛星の利用が増加しており、予測期間中、リモートセンシング衛星市場の需要を牽引すると予想されます。
アジア太平洋地域は予測期間中最も高い成長が見込まれる
- 世界のリモートセンシング衛星市場は、高速インターネット、通信サービス、さまざまな業界におけるデータ転送の需要増加を背景に、今後数年間で大きく成長すると予想されます。北米、欧州、アジア太平洋は、市場シェアと収益創出において主要な地域です。2017-2022年の間に、合計147機のリモートセンシング衛星が製造・打ち上げられました。
- 北米は、ボーイング、ロッキード・マーチン、ノースロップ・グラマンなど複数の大手市場プレーヤが存在するため、世界のリモートセンシング衛星市場を独占すると予想されています。米国政府も先進衛星技術の開発に多額の投資を行っており、これが北米市場の成長を促進すると見られています。2017-2022年の間、この地域は製造されたリモートセンシング衛星全体の30%を占めています。
- 欧州のリモートセンシング衛星市場は、高速インターネットや通信サービスの需要増加により、大幅な成長が見込まれています。欧州宇宙機関(ESA)は、先進的な衛星技術の開発に多額の投資を行っており、同地域の市場成長を牽引すると期待されています。2017-2022年の間、この地域は製造されたリモートセンシング衛星全体の11%を占めています。
- アジア太平洋は、中国、インド、日本などの国々で衛星ベースの通信サービスやナビゲーションシステムの需要が増加しているため、リモートセンシング衛星市場で大きな成長が見込まれています。2017-2022年の間に、この地域は製造されたリモートセンシング衛星全体の59%を占めました。
世界のリモートセンシング衛星市場動向
全地域で衛星小型化需要の高まりが市場を牽引
- 小型衛星は従来の衛星のほぼすべての機能をわずかなコストで実行できるため、小型衛星コンステレーションの構築、打ち上げ、運用の実行可能性が高まっています。北米の需要は、毎年最も多くの小型衛星を製造している米国が主に牽引しています。北米では2017年から2022年にかけて、合計596機の超小型衛星が様々な地域のプレーヤーによって軌道に投入されました。NASAも現在、これらの衛星の開発を目的としたいくつかのプロジェクトに関与しています。
- 欧州の需要は主にドイツ、フランス、ロシア、英国が牽引しており、毎年最も多くの小型衛星を製造しています。2017年から2022年にかけて、50機以上の超小型・超小型衛星が様々な地域のプレーヤーによって軌道に投入されました。電子部品とシステムの小型化と商業化が市場参入企業を牽引し、その結果、現在の市場シナリオを活用し、強化することを目指す新たな市場プレーヤーが出現しています。例えば、英国を拠点とする新興企業Open CosmosはESAと提携し、約90%の競争力あるコスト削減を実現しながら、エンドユーザーに商業用超小型衛星打ち上げサービスを提供しています。
- アジア太平洋の需要は、主に中国、日本、インドが牽引しており、これらの国は年間最大数の小型衛星を製造しています。2017-2022年の間に、190機以上の超小型衛星が様々な地域のプレーヤーによって軌道に投入されました。中国は宇宙ベースの能力増強に向けて多大な資源を投入しています。同国はこれまでアジア太平洋で最も多くの超小型衛星を打ち上げてきました。
衛星製造への投資機会が市場を牽引
- 北米では、宇宙計画のための世界政府支出が2021年に過去最高の約1,030億米ドルに達しました。この地域は、世界最大の宇宙機関であるNASAが存在する、宇宙イノベーションと研究の震源地です。2022年、米国政府は宇宙プログラムに約620億米ドルを支出し、宇宙プログラムへの支出額が世界一となりました。米国では、連邦政府機関は毎年323億3,000万米ドル相当の資金を議会から得ています。
- 欧州諸国は、宇宙領域におけるさまざまな投資の重要性を認識しており、世界の宇宙産業で競合を維持するために、革新的な活動への支出を増やしています。2022年11月、ESAは、地球観測における欧州のリードを維持し、航法サービスを拡大し、米国との宇宙探査におけるパートナーであり続けることを目的として、今後3年間で宇宙資金を25%増額することを提案したと発表しました。欧州宇宙機関(ESA)は、2023年から2025年にかけての約185億ユーロの予算を支持するよう22カ国に求めています。ドイツ、フランス、イタリアが主な拠出国です。
- アジア太平洋地域における宇宙関連活動の増加に伴い、2022年、日本の予算案は宇宙予算の増額を記録し、その額は14億米ドルを超えました。これには、H3ロケット、技術試験衛星9号、情報収集衛星(IGS)計画の開発が含まれます。同様に、22年度のインドの宇宙開発予算案は18億3,000万米ドルでした。2022年、韓国の科学情報通信省は、人工衛星、ロケット、その他の主要な宇宙機器の製造のために6億1,900万米ドルの宇宙予算を発表しました。
リモートセンシング衛星産業の概要
リモートセンシング衛星市場はかなり統合されており、上位5社で85.94%を占めています。この市場の主要企業は以下の通りです。China Aerospace Science and Technology Corporation(CASC), Japan Aerospace Exploration Agency(JAXA), Lockheed Martin Corporation, Northrop Grumman Corporation and ROSCOSMOS(sorted alphabetically).
その他の特典
- エクセル形式の市場予測(ME)シート
- 3ヶ月間のアナリストサポート
目次
第1章 エグゼクティブサマリーと主な調査結果
第2章 レポートのオファー
第3章 イントロダクション
- 調査の前提条件と市場定義
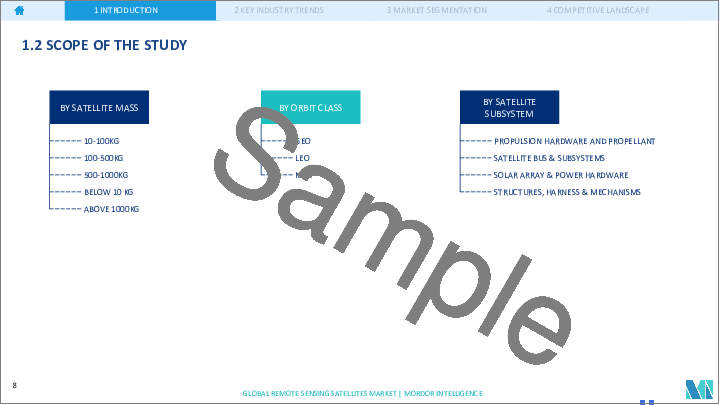
- 調査範囲
- 調査手法
第4章 主要産業動向
- 衛星の質量
- 衛星の小型化
- 宇宙開発への支出
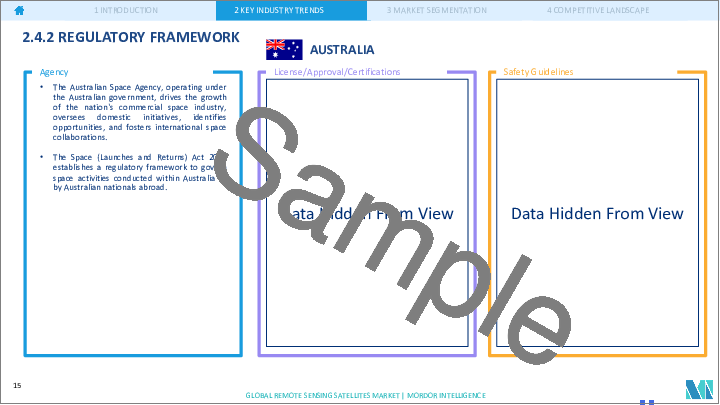
- 規制の枠組み
- 世界
- オーストラリア
- ブラジル
- カナダ
- 中国
- フランス
- ドイツ
- インド
- イラン
- 日本
- ニュージーランド
- ロシア
- シンガポール
- 韓国
- アラブ首長国連邦
- 英国
- 米国
- バリューチェーンと流通チャネル分析
第5章 市場セグメンテーション
- 衛星質量
- 10-100kg
- 100-500kg
- 500-1000kg
- 10kg未満
- 1000kg以上
- 軌道クラス
- ジオ
- LEO
- MEO
- 衛星サブシステム
- 推進ハードウェアと推進剤
- 衛星バスとサブシステム
- 太陽電池アレイと電源ハードウェア
- 構造、ハーネス、機構
- エンドユーザー
- 商業
- 軍事・政府
- その他
- 地域
- アジア太平洋
- 欧州
- 北米
- 世界のその他の地域
第6章 競合情勢
- 主要な戦略動向
- 市場シェア分析
- 企業情勢
- 企業プロファイル.
- Airbus SE
- Ball Corporation
- China Aerospace Science and Technology Corporation(CASC)
- ESRI
- GomSpaceApS
- IHI Corporation
- Indian Space Research Organisation(ISRO)
- Japan Aerospace Exploration Agency(JAXA)
- Lockheed Martin Corporation
- Maxar Technologies Inc.
- Northrop Grumman Corporation
- Planet Labs Inc.
- ROSCOSMOS
- Spire Global, Inc.
- Thales
第7章 CEOへの主な戦略的質問
第8章 付録
- 世界概要
- 概要
- ファイブフォース分析フレームワーク
- 世界のバリューチェーン分析
- 市場力学(DROs)
- 情報源と参考文献
- 図表一覧
- 主要洞察
- データパック
- 用語集
The Remote Sensing Satellites Market size is estimated at 48.62 billion USD in 2025, and is expected to reach 84.35 billion USD by 2030, growing at a CAGR of 11.65% during the forecast period (2025-2030).
Demand for LEO satellites is driving the market and registers a share of 79.5% in 2029
- Various remote sensing satellites orbit the Earth at varying distances depending on their design and primary purpose. These satellites are launched or placed into different orbits according to their purposes/applications. Each satellite deployed into orbit has its own benefits and challenges, which include increased coverage and decreased energy efficiency.
- Around 90% of the remote sensing satellites launched between 2017 and 2022* were placed in low Earth orbit for Earth observation and science, among other applications. This is because of the close proximity of this orbit to the Earth, which helps send spatial high-resolution images without any latency. Therefore, with the increased benefits of this orbit, the demand for these satellites to be deployed in the LEO orbit is expected to rise during the forecast period. Similarly, during 2017-2022, of the 56 satellites launched in the MEO orbit, 46 were built for Navigation/Global Positioning purposes. Of the 147 satellites in the GEO orbit, 105 satellites have been deployed for communication applications.
- The increasing use of remote sensing satellites for purposes such as electronic intelligence, Earth science/meteorology, laser imaging, optical imaging, and meteorology is expected to drive the demand for the remote sensing satellites market during the forecast period.
Asia-Pacific is expected to witness highest growth during the forecast period
- The global remote sensing satellite market is expected to grow significantly over the coming years, driven by increasing demand for high-speed internet, communication services, and data transfer across different industries. North America, Europe, and Asia-Pacific are the major regions in terms of market share and revenue generation. During 2017-2022, a total of 147 remote sensing satellites were manufactured and launched.
- North America is expected to dominate the global remote sensing satellite market due to the presence of several leading market players, such as Boeing, Lockheed Martin, and Northrop Grumman, in the region. The US government is also investing heavily in the development of advanced satellite technology, which is expected to drive the growth of the market in North America. During 2017-2022, the region accounted for 30% of the total remote sensing satellites manufactured.
- The remote sensing satellite market in Europe is expected to grow significantly due to the increasing demand for high-speed internet and communication services. The European Space Agency (ESA) has been investing heavily in the development of advanced satellite technology, which is expected to drive the growth of the market in the region. During 2017-2022, the region accounted for 11% of the total remote sensing satellites manufactured.
- Asia-Pacific is expected to witness significant growth in the remote sensing satellite market due to the increasing demand for satellite-based communication services and navigation systems in countries such as China, India, and Japan. During 2017-2022, the region accounted for 59% of the total remote sensing satellites manufactured.
Global Remote Sensing Satellites Market Trends
Rising demand for satellite miniaturization across all regions is driving the market
- The ability of small satellites to perform nearly all the functions of traditional satellites at a fraction of their cost has increased the viability of building, launching, and operating small satellite constellations. The demand from North America is primarily driven by the United States, which manufactures the largest number of small satellites each year. In North America, during 2017-2022, a total of 596 nanosatellites were placed into orbit by various regional players. NASA is also currently involved in several projects aimed at developing these satellites.
- The demand from Europe is primarily driven by Germany, France, Russia, and the United Kingdom, which manufacture the largest number of small satellites each year. During 2017-2022, more than 50 nano and microsatellites were placed into orbit by various regional players. The miniaturization and commercialization of electronic components and systems have driven market participation, resulting in the emergence of new market players who aim to capitalize on and enhance the current market scenario. For instance, UK-based startup Open Cosmos partnered with ESA to provide commercial nanosatellite launch services to end users while ensuring competitive cost savings of around 90%.
- The demand from Asia-Pacific is primarily driven by China, Japan, and India, which manufacture the largest number of small satellites annually. During 2017-2022, more than 190 nano and microsatellites were placed into orbit by various regional players. China is investing significant resources toward augmenting its space-based capabilities. The country has launched the most significant number of nano and microsatellites in Asia-Pacific to date.
Investment opportunities in satellite manufacturing is driving the market
- In North America, global government expenditure for space programs reached a record of approximately USD 103 billion in 2021. The region is the epicenter of space innovation and research, with the presence of the world's biggest space agency, NASA. In 2022, the US government spent nearly USD 62 billion on its space programs, making it the highest spender on space programs in the world. In the United States, federal agencies receive funding from Congress every year worth USD 32.33 billion for their subsidiaries.
- European countries are recognizing the importance of various investments in the space domain and are increasing their spending on innovative activities to remain competitive in the global space industry. In November 2022, ESA announced that it had proposed a 25% boost in space funding over the next three years designed to maintain Europe's lead in Earth observation, expand navigation services, and remain a partner in space exploration with the United States. The European Space Agency (ESA) is asking its 22 nations to back a budget of some EUR 18.5 billion for 2023-2025. Germany, France, and Italy are the major contributors.
- In line with the increase in space-related activities in the Asia-Pacific region, in 2022, Japan's draft budget registered a rise in its space budget, which amounted to over USD 1.4 billion. It included the development of the H3 rocket, Engineering Test Satellite-9, and the nation's Information Gathering Satellite (IGS) program. Similarly, the proposed budget for India's space programs for FY22 was USD 1.83 billion. In 2022, the South Korean Ministry of Science and ICT announced a space budget of USD 619 million for manufacturing satellites, rockets, and other key space equipment.
Remote Sensing Satellites Industry Overview
The Remote Sensing Satellites Market is fairly consolidated, with the top five companies occupying 85.94%. The major players in this market are China Aerospace Science and Technology Corporation (CASC), Japan Aerospace Exploration Agency (JAXA), Lockheed Martin Corporation, Northrop Grumman Corporation and ROSCOSMOS (sorted alphabetically).
Additional Benefits:
- The market estimate (ME) sheet in Excel format
- 3 months of analyst support
TABLE OF CONTENTS
1 EXECUTIVE SUMMARY & KEY FINDINGS
2 REPORT OFFERS
3 INTRODUCTION
- 3.1 Study Assumptions & Market Definition
- 3.2 Scope of the Study
- 3.3 Research Methodology
4 KEY INDUSTRY TRENDS
- 4.1 Satellite Mass
- 4.2 Satellite Miniaturization
- 4.3 Spending On Space Programs
- 4.4 Regulatory Framework
- 4.4.1 Global
- 4.4.2 Australia
- 4.4.3 Brazil
- 4.4.4 Canada
- 4.4.5 China
- 4.4.6 France
- 4.4.7 Germany
- 4.4.8 India
- 4.4.9 Iran
- 4.4.10 Japan
- 4.4.11 New Zealand
- 4.4.12 Russia
- 4.4.13 Singapore
- 4.4.14 South Korea
- 4.4.15 United Arab Emirates
- 4.4.16 United Kingdom
- 4.4.17 United States
- 4.5 Value Chain & Distribution Channel Analysis
5 MARKET SEGMENTATION (includes market size in Value in USD, Forecasts up to 2030 and analysis of growth prospects)
- 5.1 Satellite Mass
- 5.1.1 10-100kg
- 5.1.2 100-500kg
- 5.1.3 500-1000kg
- 5.1.4 Below 10 Kg
- 5.1.5 above 1000kg
- 5.2 Orbit Class
- 5.2.1 GEO
- 5.2.2 LEO
- 5.2.3 MEO
- 5.3 Satellite Subsystem
- 5.3.1 Propulsion Hardware and Propellant
- 5.3.2 Satellite Bus & Subsystems
- 5.3.3 Solar Array & Power Hardware
- 5.3.4 Structures, Harness & Mechanisms
- 5.4 End User
- 5.4.1 Commercial
- 5.4.2 Military & Government
- 5.4.3 Other
- 5.5 Region
- 5.5.1 Asia-Pacific
- 5.5.2 Europe
- 5.5.3 North America
- 5.5.4 Rest of World
6 COMPETITIVE LANDSCAPE
- 6.1 Key Strategic Moves
- 6.2 Market Share Analysis
- 6.3 Company Landscape
- 6.4 Company Profiles (includes Global Level Overview, Market Level Overview, Core Business Segments, Financials, Headcount, Key Information, Market Rank, Market Share, Products and Services, and Analysis of Recent Developments).
- 6.4.1 Airbus SE
- 6.4.2 Ball Corporation
- 6.4.3 China Aerospace Science and Technology Corporation (CASC)
- 6.4.4 ESRI
- 6.4.5 GomSpaceApS
- 6.4.6 IHI Corporation
- 6.4.7 Indian Space Research Organisation (ISRO)
- 6.4.8 Japan Aerospace Exploration Agency (JAXA)
- 6.4.9 Lockheed Martin Corporation
- 6.4.10 Maxar Technologies Inc.
- 6.4.11 Northrop Grumman Corporation
- 6.4.12 Planet Labs Inc.
- 6.4.13 ROSCOSMOS
- 6.4.14 Spire Global, Inc.
- 6.4.15 Thales
7 KEY STRATEGIC QUESTIONS FOR SATELLITE CEOS
8 APPENDIX
- 8.1 Global Overview
- 8.1.1 Overview
- 8.1.2 Porter's Five Forces Framework
- 8.1.3 Global Value Chain Analysis
- 8.1.4 Market Dynamics (DROs)
- 8.2 Sources & References
- 8.3 List of Tables & Figures
- 8.4 Primary Insights
- 8.5 Data Pack
- 8.6 Glossary of Terms

