
|
市場調査レポート
商品コード
1693920
衛星製造:市場シェア分析、産業動向と統計、成長予測(2025年~2030年)Satellite Manufacturing - Market Share Analysis, Industry Trends & Statistics, Growth Forecasts (2025 - 2030) |
||||||
カスタマイズ可能
適宜更新あり
|
|||||||
| 衛星製造:市場シェア分析、産業動向と統計、成長予測(2025年~2030年) |
|
出版日: 2025年03月18日
発行: Mordor Intelligence
ページ情報: 英文 271 Pages
納期: 2~3営業日
|

全表示
- 概要
- 目次
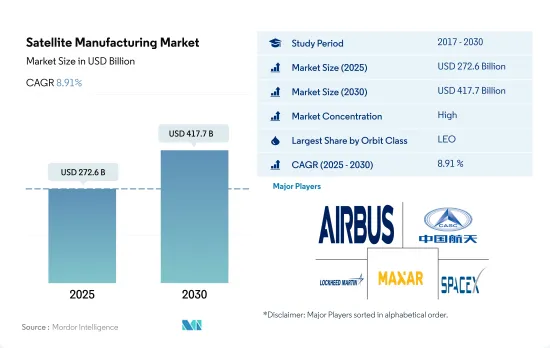
衛星製造市場規模は2025年に2,726億米ドルと推定され、2030年には4,177億米ドルに達すると予測され、予測期間中(2025~2030年)のCAGRは8.91%で成長します。
LEO衛星セグメントが市場をリードする見込み
- 衛星や宇宙船は通常、地球を周回する多くの特別な軌道の1つに配置されるか、衛星の用途に応じて惑星間の旅に打ち上げられます。低軌道(LEO)、静止軌道(GEO)、中軌道(MEO)という3つの軌道のうち、LEOは地球に近いため、広く選ばれていることが指摘されています。
- 多くの気象衛星や通信衛星は、地上から最も遠い地球高軌道をとる傾向があります。地球中周回軌道にある衛星には、特定の地域をモニタリングするために設計された航法衛星や特殊衛星が含まれます。NASAの地球観測システムを含むほとんどの科学衛星は、地球低軌道にあります。
- すべての地域で製造・打ち上げられる衛星は用途が異なります。例えば、2017~2022年にかけて、MEOで打ち上げられた56機の衛星のうち、ほとんどがナビゲーション/全地球測位を目的として製造されました。同様に、GEO軌道の133機の衛星のうち、ほとんどが通信と地球観測の目的で配備されました。製造・打ち上げられた約4,025機以上のLEO衛星は、世界中の様々な国によって所有されています。
- 電子情報、地球科学/気象学、レーザーイメージング、光学イメージング、気象学などのセグメントで衛星の利用が増加していることから、予測期間中は衛星の開発需要が高まると予想されます。
通信、ナビゲーション、地球観測などの衛星サービスへの需要の高まりが市場成長を後押し
- 世界の衛星製造市場は、現代社会において重要な役割を果たすダイナミックで変化の激しい産業です。この産業には、小型のキューブ型衛星から大型の地球観測衛星や通信衛星まで、幅広い種類の衛星を設計・製造・打ち上げている企業が含まれます。
- この産業は、通信、航法、地球観測などの衛星サービスに対する需要の高まりや、公的機関や民間機関による宇宙へのアクセスの増加など、さまざまな要因によって牽引されています。その結果、この産業は近年著しい成長を遂げており、新規参入企業や既存企業がその能力を拡大しています。
- 衛星製造は、先端材料、エレクトロニクス、ソフトウェアなど、多くの技術を駆使した複雑なプロセスです。このセグメントの企業は、これらの技術を深く理解し、宇宙の過酷な条件に耐える先進的システムに統合できなければならないです。主要衛星メーカーには、Airbus Defense and Space、Boeing社、Lockheed Martin社、タレスアレニア・スペース社などがあります。
- 北米と欧州はこの産業ではより確立された市場であり、アジア太平洋は成長機会のより有利な市場です。2017~2022年5月までに、世界全体で約4,300機の衛星が製造・打ち上げられました。世界の衛星製造市場は、衛星サービスへの需要が高まり、宇宙へのアクセスが拡大するにつれて、成長と革新が予測されます。
世界の衛星製造市場の動向
小型衛星の費用対効果と実行可能性の向上が衛星の小型化を促進
- 小型衛星は、従来の衛星の数分の一のコストで従来の衛星のほぼすべての機能を実行できるため、小型衛星コンステレーションの構築、打上げ、運用の実行可能性が高まっています。北米の需要は、主に米国が牽引しており、米国は毎年最も多くの小型衛星を製造しています。北米では、2017~2022年の間に、580機の超小型衛星が地域の様々な参入企業によって軌道に投入されました。現在、NASAはこれらの衛星の開発を目的としたいくつかのプロジェクトに関与しています。
- 欧州の需要は、主にドイツ、フランス、ロシア、英国が牽引しており、これらの国は毎年最も多くの小型衛星を製造しています。2017~2022年の間に、この地域の様々な参入企業によって50機以上の超小型・超小型衛星が軌道に投入されました。電子部品とシステムの小型化と商業化が市場参入企業を牽引し、その結果、現在の市場シナリオを活用し、強化することを目指す新たな市場参入企業が出現しています。例えば、英国の新興企業Open CosmosはESAと提携し、約90%の競争コスト削減を実現しながら、エンドユーザーに業務用超小型衛星打ち上げサービスを提供しています。
- アジア太平洋の需要は、主に中国、日本、インドが牽引しており、これらの国は毎年最も多くの小型衛星を製造しています。2017~2022年の間に、190機以上の超小型衛星がこの地域の様々な参入企業によって軌道に投入されました。中国は宇宙ベースの能力増強に向けて多大な資源を投入しています。同国はこれまでアジア太平洋で最も多くの超小型衛星を打ち上げてきました。
支出の増加と投資機会の増加が衛星製造の成長を促す主要因です。
- 北米では、宇宙計画のための世界政府支出が2021年に過去最高の約1,030億米ドルに達します。この地域は、世界最大の宇宙機関であるNASAの存在により、宇宙イノベーションと研究の震源地となっています。2022年、米国政府はその宇宙プログラムに約620億米ドルを費やし、世界で最も宇宙開発費が多い国となりました。米国では、連邦政府機関がその子会社に対して、議会から年間323億3,000万米ドル相当の資金援助を受けています。
- さらに、欧州諸国は宇宙領域における様々な投資の重要性を認識しており、世界の宇宙産業において競合と革新性を維持するために、宇宙活動や技術革新への支出を増やしています。例えば、2022年11月、ESAは、地球観測における欧州のリードを維持し、航法サービスを拡大し、米国との探査におけるパートナーであり続けることを目的として、今後3年間で宇宙資金を25%増額することを提案したと発表しました。欧州宇宙機関(ESA)は、2023~2025年にかけての約185億ユーロの予算を支持するよう22カ国に要請しました。ドイツ、フランス、イタリアが主要拠出国です。
- アジア太平洋における宇宙関連活動の増加を考慮すると、日本の予算案によると、2022年の宇宙予算は14億米ドルを超え、これにはH3ロケット、技術検査衛星9号、情報収集衛星(IGS)計画の開発が含まれます。同様に、2022年度のインドの宇宙開発予算案は18億3,000万米ドルでした。2022年、韓国の科学情報通信省は、人工衛星、ロケット、その他の主要な宇宙機器の製造のために6億1,900万米ドルの宇宙予算を発表しました。
衛星製造産業概要
衛星製造市場はかなり統合されており、上位5社で90.13%を占めています。この市場の主要企業は、Airbus SE、China Aerospace Science、Technology Corporation(CASC)、Lockheed Martin Corporation、Maxar Technologies Inc.、Space Exploration Technologies Corp.です。
その他の特典
- エクセル形式の市場予測(ME)シート
- 3ヶ月間のアナリストサポート
目次
第1章 エグゼクティブサマリーと主要調査結果
第2章 レポートのオファー
第3章 イントロダクション
- 調査の前提条件と市場定義
- 調査範囲
- 調査手法
第4章 主要産業動向
- 衛星の小型化
- 衛星質量
- 宇宙開発への支出
- 規制の枠組み
- 世界
- オーストラリア
- ブラジル
- カナダ
- 中国
- フランス
- ドイツ
- インド
- イラン
- 日本
- ニュージーランド
- ロシア
- シンガポール
- 韓国
- アラブ首長国連邦
- 英国
- 米国
- バリューチェーンと流通チャネル分析
第5章 市場セグメンテーション
- 用途
- 通信
- 地球観測
- ナビゲーション
- 宇宙観測
- その他
- 衛星質量
- 10~100kg
- 100~500kg
- 500~1,000kg
- 10kg以下
- 1,000kg以上
- 軌道クラス
- GEO
- LEO
- MEO
- エンドユーザー
- 商業
- 軍事・政府
- その他
- 衛星サブシステム
- 推進ハードウェアと推進剤
- 衛星バスとサブシステム
- ソーラーアレイ&パワーハードウェア
- 構造、ハーネス、メカニズム
- 推進技術
- 電気
- ガスベース
- 液体燃料
- 地域
- アジア太平洋
- 国別
- オーストラリア
- 中国
- インド
- 日本
- ニュージーランド
- シンガポール
- 韓国
- 欧州
- 国別
- フランス
- ドイツ
- ロシア
- 英国
- 北米
- 国別
- カナダ
- 米国
- その他
- 国別
- ブラジル
- イラン
- サウジアラビア
- アラブ首長国連邦
- その他
- アジア太平洋
第6章 競合情勢
- 主要な戦略動向
- 市場シェア分析
- 企業情勢
- 企業プロファイル
- AAC Clyde Space
- Airbus SE
- China Aerospace Science and Technology Corporation(CASC)
- Leidos
- Lockheed Martin Corporation
- Maxar Technologies Inc.
- Mitsubishi Heavy Industries
- Northrop Grumman Corporation
- Sierra Nevada Corporation
- Space Exploration Technologies Corp.
- Thales
- The Boeing Company
第7章 CEOへの主要戦略的質問
第8章 付録
- 世界概要
- 概要
- ファイブフォース分析フレームワーク
- 世界のバリューチェーン分析
- 市場力学(DROs)
- 情報源と参考文献
- 図表一覧
- 主要な洞察
- データパック
- 用語集
The Satellite Manufacturing Market size is estimated at 272.6 billion USD in 2025, and is expected to reach 417.7 billion USD by 2030, growing at a CAGR of 8.91% during the forecast period (2025-2030).
LEO Satellites Segment is Expected to Lead the Market
- A satellite or a spacecraft is usually placed into one of many special orbits around the Earth, or it can be launched into an interplanetary journey based on the application of a satellite. Out of the three orbits, namely Low Earth (LEO), Geostationary (GEO), and Medium Earth (MEO), it has been noted that LEO is the widely chosen one because of its proximity to the Earth.
- Many weather and communication satellites tend to have high Earth orbits farthest from the surface. Satellites in medium Earth orbit include navigational and specialized satellites designed to monitor a specific area. Most science satellites, including NASA's Earth Observation System, are in low Earth orbit.
- Different satellites manufactured and launched across all the regions have different applications. For instance, during 2017-2022, out of the 56 satellites launched in MEO, most were built for Navigation/Global Positioning purposes. Similarly, out of the 133 satellites in the GEO orbit, most were deployed for communication and earth observation purposes. Around 4,025+ LEO satellites, manufactured and launched, were owned by various countries across the globe.
- The increasing use of satellites in areas such as electronic intelligence, earth science/meteorology, laser imaging, optical imaging, and meteorology is expected to drive the demand for the development of satellites during the forecast period.
Growing demand for satellite services such as communications, navigation, and earth observation is aiding the market growth
- The global satellite manufacturing market is a dynamic and rapidly changing industry that plays an important role in modern society. This industry includes companies that design, manufacture, and launch a wide range of satellites, from small cubes to large Earth observation and communication satellites.
- The industry is driven by various factors, including growing demand for satellite services such as communications, navigation, and Earth observation, and increasing accessibility to space for public and private organizations. As a result, the industry has seen significant growth in recent years, with new players entering the market and established companies expanding their capabilities.
- Satellite manufacturing is a complex process with many technologies, including advanced materials, electronics, and software. Companies in this field must have a deep understanding of these technologies and be able to integrate them into sophisticated systems that can withstand the harsh conditions of space. Major satellite manufacturers include Airbus Defense and Space, The Boeing Company, Lockheed Martin, and Thales Alenia Space.
- North America and Europe are more established markets in the industry, while Asia-Pacific is a more lucrative market for growth opportunities. From 2017 to May 2022, around 4300 satellites were manufactured and launched globally. The global satellite manufacturing market is projected to grow and innovate as demand for satellite services grows and space access expands.
Global Satellite Manufacturing Market Trends
Cost-effectiveness and increased viability of small satellites leading to rise of satellite miniaturization
- The ability of a small satellite to perform nearly all of the functions of a traditional satellite at a fraction of the cost of a traditional satellite has increased the viability of building, launching, and operating small satellite constellations. The demand in North America is primarily driven by the United States, which manufactures the largest number of small satellites annually. In North America, during 2017-2022, 580 nanosatellites were placed into orbit by various players in the region. Currently, NASA is involved in several projects aimed at developing these satellites.
- The demand in Europe is primarily driven by Germany, France, Russia, and the United Kingdom, which manufacture the largest number of small satellites annually. During 2017-2022, more than 50 nano and microsatellites were placed into orbit by various players in the region. The miniaturization and commercialization of electronic components and systems have driven market participation, resulting in the emergence of new market players who aim to capitalize on and enhance the current market scenario. For instance, Open Cosmos, a UK-based startup, partnered with ESA to provide commercial nanosatellite launch services to end users while ensuring competitive cost-savings of around 90%.
- The demand in Asia-Pacific is primarily driven by China, Japan, and India, which manufacture the largest number of small satellites annually. During 2017-2022, more than 190 nano and microsatellites were placed into orbit by various players in the region. China is investing significant resources toward augmenting its space-based capabilities. The country has launched the most significant number of nano and microsatellites in Asia-Pacific to date.
Increased spending and rising investment opportunities are the major factors aiding the growth of satellite manufacturing
- In North America, global government expenditure for space programs hit a record of approximately USD 103 billion in 2021. The region is the epicenter of space innovation and research, with the presence of the world's biggest space agency, NASA. In 2022, the US government spent nearly USD 62 billion on its space programs, making it the highest spender on space in the world. In the United States, federal agencies receive annual funding from Congress worth USD 32.33 billion for their subsidiaries.
- Additionally, European countries are recognizing the importance of various investments in the space domain and are increasing their spending on space activities and innovation to stay competitive and innovative in the global space industry. For instance, in November 2022, ESA announced that it had proposed a 25% boost in space funding over the next three years designed to maintain Europe's lead in Earth observation, expand navigation services, and remain a partner in exploration with the United States. The European Space Agency (ESA) asked its 22 nations to back a budget of around EUR 18.5 billion for 2023-2025. Germany, France, and Italy are the major contributors.
- Considering the increase in space-related activities in the Asia-Pacific region, in 2022, according to the draft budget of Japan, the space budget of the country was over USD 1.4 billion, which included the development of the H3 rocket, Engineering Test Satellite-9, and the nation's Information Gathering Satellite (IGS) program. Similarly, the proposed budget for India's space programs for FY 2022 was USD 1.83 billion. In 2022, South Korea's Ministry of Science and ICT announced a space budget of USD 619 million for manufacturing satellites, rockets, and other key space equipment.
Satellite Manufacturing Industry Overview
The Satellite Manufacturing Market is fairly consolidated, with the top five companies occupying 90.13%. The major players in this market are Airbus SE, China Aerospace Science and Technology Corporation (CASC), Lockheed Martin Corporation, Maxar Technologies Inc. and Space Exploration Technologies Corp. (sorted alphabetically).
Additional Benefits:
- The market estimate (ME) sheet in Excel format
- 3 months of analyst support
TABLE OF CONTENTS
1 EXECUTIVE SUMMARY & KEY FINDINGS
2 REPORT OFFERS
3 INTRODUCTION
- 3.1 Study Assumptions & Market Definition
- 3.2 Scope of the Study
- 3.3 Research Methodology
4 KEY INDUSTRY TRENDS
- 4.1 Satellite Miniaturization
- 4.2 Satellite Mass
- 4.3 Spending On Space Programs
- 4.4 Regulatory Framework
- 4.4.1 Global
- 4.4.2 Australia
- 4.4.3 Brazil
- 4.4.4 Canada
- 4.4.5 China
- 4.4.6 France
- 4.4.7 Germany
- 4.4.8 India
- 4.4.9 Iran
- 4.4.10 Japan
- 4.4.11 New Zealand
- 4.4.12 Russia
- 4.4.13 Singapore
- 4.4.14 South Korea
- 4.4.15 United Arab Emirates
- 4.4.16 United Kingdom
- 4.4.17 United States
- 4.5 Value Chain & Distribution Channel Analysis
5 MARKET SEGMENTATION (includes market size in Value in USD, Forecasts up to 2030 and analysis of growth prospects)
- 5.1 Application
- 5.1.1 Communication
- 5.1.2 Earth Observation
- 5.1.3 Navigation
- 5.1.4 Space Observation
- 5.1.5 Others
- 5.2 Satellite Mass
- 5.2.1 10-100kg
- 5.2.2 100-500kg
- 5.2.3 500-1000kg
- 5.2.4 Below 10 Kg
- 5.2.5 above 1000kg
- 5.3 Orbit Class
- 5.3.1 GEO
- 5.3.2 LEO
- 5.3.3 MEO
- 5.4 End User
- 5.4.1 Commercial
- 5.4.2 Military & Government
- 5.4.3 Other
- 5.5 Satellite Subsystem
- 5.5.1 Propulsion Hardware and Propellant
- 5.5.2 Satellite Bus & Subsystems
- 5.5.3 Solar Array & Power Hardware
- 5.5.4 Structures, Harness & Mechanisms
- 5.6 Propulsion Tech
- 5.6.1 Electric
- 5.6.2 Gas based
- 5.6.3 Liquid Fuel
- 5.7 Region
- 5.7.1 Asia-Pacific
- 5.7.1.1 By Country
- 5.7.1.1.1 Australia
- 5.7.1.1.2 China
- 5.7.1.1.3 India
- 5.7.1.1.4 Japan
- 5.7.1.1.5 New Zealand
- 5.7.1.1.6 Singapore
- 5.7.1.1.7 South Korea
- 5.7.2 Europe
- 5.7.2.1 By Country
- 5.7.2.1.1 France
- 5.7.2.1.2 Germany
- 5.7.2.1.3 Russia
- 5.7.2.1.4 United Kingdom
- 5.7.3 North America
- 5.7.3.1 By Country
- 5.7.3.1.1 Canada
- 5.7.3.1.2 United States
- 5.7.4 Rest of World
- 5.7.4.1 By Country
- 5.7.4.1.1 Brazil
- 5.7.4.1.2 Iran
- 5.7.4.1.3 Saudi Arabia
- 5.7.4.1.4 United Arab Emirates
- 5.7.4.1.5 Rest of World
- 5.7.1 Asia-Pacific
6 COMPETITIVE LANDSCAPE
- 6.1 Key Strategic Moves
- 6.2 Market Share Analysis
- 6.3 Company Landscape
- 6.4 Company Profiles (includes Global Level Overview, Market Level Overview, Core Business Segments, Financials, Headcount, Key Information, Market Rank, Market Share, Products and Services, and Analysis of Recent Developments).
- 6.4.1 AAC Clyde Space
- 6.4.2 Airbus SE
- 6.4.3 China Aerospace Science and Technology Corporation (CASC)
- 6.4.4 Leidos
- 6.4.5 Lockheed Martin Corporation
- 6.4.6 Maxar Technologies Inc.
- 6.4.7 Mitsubishi Heavy Industries
- 6.4.8 Northrop Grumman Corporation
- 6.4.9 Sierra Nevada Corporation
- 6.4.10 Space Exploration Technologies Corp.
- 6.4.11 Thales
- 6.4.12 The Boeing Company
7 KEY STRATEGIC QUESTIONS FOR SATELLITE CEOS
8 APPENDIX
- 8.1 Global Overview
- 8.1.1 Overview
- 8.1.2 Porter's Five Forces Framework
- 8.1.3 Global Value Chain Analysis
- 8.1.4 Market Dynamics (DROs)
- 8.2 Sources & References
- 8.3 List of Tables & Figures
- 8.4 Primary Insights
- 8.5 Data Pack
- 8.6 Glossary of Terms

