
|
市場調査レポート
商品コード
1850954
ニンニク:市場シェア分析、産業動向、統計、成長予測(2025年~2030年)Garlic - Market Share Analysis, Industry Trends & Statistics, Growth Forecasts (2025 - 2030) |
||||||
カスタマイズ可能
適宜更新あり
|
|||||||
| ニンニク:市場シェア分析、産業動向、統計、成長予測(2025年~2030年) |
|
出版日: 2025年06月19日
発行: Mordor Intelligence
ページ情報: 英文 120 Pages
納期: 2~3営業日
|

概要
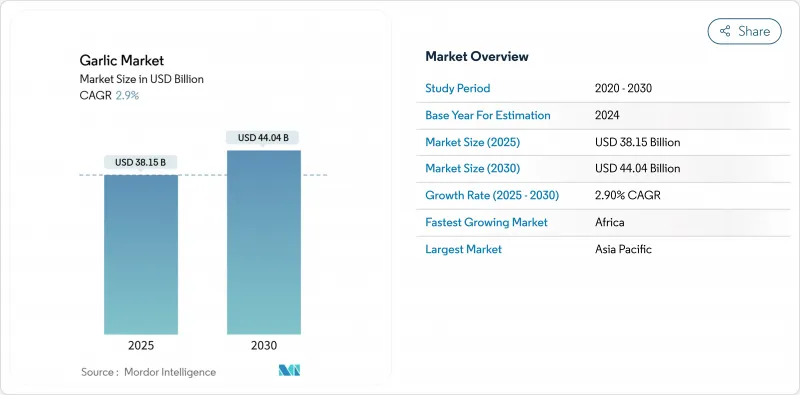
ニンニク市場規模は2025年に381億5,000万米ドルと推定・予測され、予測期間中のCAGRは2.9%で、2030年には440億4,000万米ドルに達すると予測されます。
外食、栄養補助食品、高級加工品分野からの旺盛な需要がこの拡大を支えています。中国の年間収穫量2,100万トンは世界的な供給を確保する一方で、天候ショックの際の価格変動を増幅しかねない集中リスクを生み出しています。新興経済諸国における都市部の所得増加、より汎用性の高いコールドチェーン・ルート、輸出の多様化に対する規制当局の支援などを総合すると、持続的な数量成長が見込まれます。一方、加工業者は、効率を99%まで高める自動化ラインを導入しており、コスト・リーダーシップが、大規模農業と高精度のハンドリングを組み合わせることのできる企業に移行しつつあることを示しています。
世界のニンニク市場の動向と洞察
製薬・栄養補助食品業界における需要の高まり
臨床試験でアリシンの心臓血管系への利点が強調され、サプリメントユーザーの64%がニンニクを心臓の健康と結びつけ、45%が抗菌機能と結びつけたことから、製薬グループは標準化されたニンニクエキスの調達を拡大しています。この検証により、ニンニクは商品スパイスから医療用成分へと移行し、契約栽培農家は効能が確認されたロットを提供することで、品質プレミアムを得ることができます。栄養補助食品メーカーは現在、合成添加物を敬遠する健康志向の消費者を取り込むため、研究開発予算をにおい制御カプセルに振り向けています。当局がより多くの治療効能を明確にするにつれ、トレーサブルな栽培プロトコルを採用する生産者は、利益率の高い抽出グレードのサプライチェーンに軸足を移すことができます。
外食産業における加工食品の人気の高まり
大規模なレストラン・チェーンでは、店内での皮むきに代わって、あらかじめミンチ、乾燥、ピューレにしたものを使用することで、労力を抑え、均一な味を保証しています。業務用厨房における乾燥パウダーの使用率が86%であるのに対し、生のクローブの使用率は83%であることから、加工品質が高ければ、時間の節約は鮮度の認識よりも勝ることがわかる。自動化された中華鍋やオーブン向けに顆粒化や水分プロファイルを調整できる受託加工業者は、定期的な生産量を獲得し、ニンニク市場をより付加価値の高い生産物へと導いています。このシフトは、賃金インフレが未加工球根のマージンを侵食している地域の輸出業者にとって極めて重要です。
主要産地の気候変動による価格変動
熱ストレスは球根の開発とホルモンプロファイルを変化させ、長江流域とインド平野の収量を損なう。モデルによると、中国の2,100万トンの供給量がニンニク市場全体の基準となっているため、中国の生産量の軽度の減少が世界の卸売価格に波及します。輸入業者は多様な調達枠組とヘッジ契約によって対応するが、金融商品を持たない小規模の加工業者はマージンの悪化に直面します。天候連動型保険の導入はまだ始まったばかりで、気候変動に強い品種の開発が急務となっています。
セグメント分析
ニンニク市場レポートは地域別(北米、欧州、アジア太平洋、南米、中東・アフリカ)に分類されています。生産分析(数量)、消費分析(数量と金額)、輸入分析(数量と金額)、輸出分析(数量と金額)、価格動向分析を含みます。市場予測は金額(米ドル)と数量(メトリックトン)で提供されます。
地域分析
アジア太平洋地域のニンニク市場の78%は、大規模な成長ベルトと専用ドライポートに起因します。済寧市だけでも年間220万トンを、湿度センサーが+-2%のばらつきを保持し、30日間の航海のためにクローブの堅さを保つリーファー通路を通じて輸出しています。インドのICAR-DOGRは、1ヘクタール当たり8~20トンの収量をもたらす品種を発表し、農家の純収益を向上させ、この地域の種子と球根の取引におけるニンニク市場規模を強化しています。それでもなお、気候変動と労働力不足がこの地域全体の機械化を推し進め、設備投資の必要性を高めています。
アフリカは、都市部が食生活の多様化を追求しているため、CAGR 8.4%と最も急成長している地域です。ケニアの県政府は、収穫後のロスを25%から10%に削減することを目標に、点滴灌漑に共同投資しています。また、南アフリカの柑橘類輸出業者は、クールチェーンのバックホール能力にニンニクを追加し、運賃単価を引き下げます。これらのプログラムが成功すれば、アフリカの生産者はニンニク市場の重要な部分を獲得し、輸入中国産への依存を減らすことができます。
北米と欧州は依然として純輸入国だが、プレミアム・セグメントに対する需要は安定しています。2025年1月、米国は主にアルゼンチン、中国、ベトナム産の生ニンニクを3,750万米ドル購入しました。原産地証明書と二酸化硫黄の遵守を義務付けるEU指令は検査コストを上昇させるが、残留物ゼロの誓約を満たした輸出業者には報奨金も与えます。両地域とも、グルメ小売業者や機能性食品ブランドに支えられ、黒字のニンニクとオーガニックのニッチを育んでいます。その結果、同地域のニンニク市場は、数量よりも金額で拡大すると思われます。
その他の特典:
- エクセル形式の市場予測(ME)シート
- 3ヶ月間のアナリストサポート
よくあるご質問
目次
第1章 イントロダクション
- 調査の前提条件と市場の定義
- 調査範囲
第2章 調査手法
第3章 エグゼクティブサマリー
第4章 市場情勢
- 市場概要
- 市場促進要因
- 医薬品および栄養補助食品業界における需要の増加
- 食品サービスにおける加工ニンニク製品の人気の高まり
- コールドチェーン物流の拡大による輸出市場の活性化
- プレミアム市場向けの黒ニンニク生産の急増
- 高収量組織培養種子品種の採用
- 農家と市場の連携を強化するeコマースの大量取引プラットフォーム
- 市場抑制要因
- 主要生産地域における気候変動による価格変動
- 労働力不足の深刻化により収穫コストが上昇
- 二酸化硫黄残留物による植物検疫上の拒否
- 料理における低臭代替品との競合
- バリューチェーン/サプライチェーン分析
- 規制情勢
- テクノロジーの展望
- PESTEL分析
第5章 市場規模と成長予測
- 地域別(生産分析(数量)、消費分析(数量・金額)、輸入分析(数量・金額)、輸出分析(数量・金額)、価格動向分析)
- 北米
- 米国
- メキシコ
- カナダ
- 欧州
- スペイン
- ウクライナ
- フランス
- 英国
- ロシア
- アジア太平洋地域
- ベトナム
- 中国
- インド
- 韓国
- ミャンマー
- インドネシア
- 南米
- ブラジル
- アルゼンチン
- 中東
- トルコ
- イラン
- アラブ首長国連邦
- アフリカ
- 南アフリカ
- エジプト
- ケニア
- 北米
第6章 競合情勢
- ステークホルダーのリスト
- Royal(Jinxiang)Garlic Co., Ltd.
- Jining Fenduni Foodstuff Co., Ltd.
- Jining Yuanfu International Trading Co., Ltd.
- La Abuela Carmen
- Filaree Farms
- The Garlic Company
- The Garlic Farm
- Great Lakes Garlic Farm
- California Garlic Company
- Maine Garlic Company
- Mad River Garlic Growers LLC.
- Rasa Creek Farm Inc.

