|
|
市場調査レポート
商品コード
1604048
吸着性樹脂の世界市場 (2024~2028年)Global Adsorbent Resins Market 2024-2028 |
||||||

|
|||||||
カスタマイズ可能
|
|||||||


| 吸着性樹脂の世界市場 (2024~2028年) |
|
出版日: 2024年10月23日
発行: TechNavio
ページ情報: 英文 216 Pages
納期: 即納可能
|

全表示
- 概要
- 図表
- 目次
吸着性樹脂市場 (2024~2028年)
吸着性樹脂市場は2023-2028年に6億6,270万米ドル分拡大し、予測期間中に7%のCAGRで成長すると予測されます。当レポートでは、吸着性樹脂市場の全体的な分析、市場規模・予測、動向、成長促進要因、課題、約25のベンダーを網羅したベンダー分析などを掲載しています。
当レポートでは、現在の市場シナリオ、最新動向と促進要因、市場環境全体に関する最新分析を提供しています。市場は、ベンダーによる新製品の発売、製薬業界からの需要の増加、技術進歩によって牽引されています。
| 市場範囲 | |
|---|---|
| 基準年 | 2024年 |
| 終了年 | 2028年 |
| 予測期間 | 2024~2028年 |
| 成長モメンタム | 加速 |
| 前年比 (2024年) | 6.3% |
| CAGR | 7% |
| 増分額 | 6億6,270万米ドル |
当レポートでは、今後数年間の吸着性樹脂市場成長を牽引する主な理由の1つとして、バイオベース吸着樹脂の需要増加を挙げています。また、生産施設の拡大やベンダーによる無機的な成長戦略も、市場の大きな需要につながります。
目次
第1章 エグゼクティブサマリー
- 市場概要
第2章 Technavioによる分析
- 価格感応度・ライフサイクル・顧客購入バスケット・採用率・購入基準の分析
- インプットの重要性と差別化の要因
- 混乱の要因
- 促進要因と課題の影響
第3章 市場情勢
- 市場エコシステム
- 市場の特徴
- バリューチェーン分析
第4章 市場規模
- 市場の定義
- 市場セグメント分析
- 市場規模 (2023年)
- 市場の見通し (2023~2028年)
第5章 市場規模実績
- 吸着性樹脂の世界市場 (2018~2022年)
- 樹脂の種類別分析 (2018~2022年)
- 用途別分析 (2018~2022年)
- 地域別分析 (2018~2022年)
- 国別分析 (2018~2022年)
第6章 定性分析
- AIの影響:吸着性樹脂の世界市場
第7章 ファイブフォース分析
- ファイブフォースの要約
- 買い手の交渉力
- 供給企業の交渉力
- 新規参入業者の脅威
- 代替品の脅威
- 競争の脅威
- 市況
第8章 市場セグメンテーション:樹脂の種類別
- 市場セグメント
- 比較:樹脂の種類別
- 合成樹脂:市場規模と予測 (2023~2028年)
- 天然樹脂:市場規模と予測 (2023~2028年)
- 市場機会:樹脂の種類別
第9章 市場セグメンテーション:用途別
- 市場セグメント
- 比較:用途別
- 上下水道処理:市場規模と予測 (2023~2028年)
- 医薬品・バイオテクノロジー:市場規模と予測 (2023~2028年)
- 食品・飲料:市場規模と予測 (2023~2028年)
- 化学品製造:市場規模と予測 (2023~2028年)
- その他:市場規模と予測 (2023~2028年)
- 市場機会:用途別
第10章 顧客情勢
- 顧客情勢の概要
第11章 地域別情勢
- 地域別セグメンテーション
- 地域別比較
- アジア太平洋:市場規模と予測 (2023~2028年)
- 北米:市場規模と予測 (2023~2028年)
- 欧州:市場規模と予測 (2023~2028年)
- 中東・アフリカ:市場規模と予測 (2023~2028年)
- 南米:市場規模と予測 (2023~2028年)
- 米国:市場規模と予測 (2023~2028年)
- 中国:市場規模と予測 (2023~2028年)
- ドイツ:市場規模と予測 (2023~2028年)
- 日本:市場規模と予測 (2023~2028年)
- インド:市場規模と予測 (2023~2028年)
- フランス:市場規模と予測 (2023~2028年)
- 英国:市場規模と予測 (2023~2028年)
- ブラジル:市場規模と予測 (2023~2028年)
- 韓国:市場規模と予測 (2023~2028年)
- カナダ:市場規模と予測 (2023~2028年)
- 市場機会:地域別
第12章 促進要因・課題・機会・抑制要因
- 市場促進要因
- 市場の課題
- 促進要因と課題の影響
- 市場の機会・抑制要因
第13章 競合情勢
- 概要
- 競合情勢
- 混乱の状況
- 業界のリスク
第14章 競合分析
- 企業プロファイル
- 企業ランキング指数
- 企業の市場ポジショニング
- Arkema
- BASF SE
- Bio Rad Laboratories Inc.
- China Huayue New Materials Technology Group Co., Ltd.
- DuPont de Nemours Inc.
- Ion Exchange India Ltd.
- Jacobi Resins
- Lanxess AG
- Mitsubishi Chemical Group Corp.
- Purolite Corp.
- Sunresin New Materials Co.Ltd.
- Suzhou bojie resin technology Co.Ltd
- Taiyuan Lanlang Technology Industrial Corp.
- Thermax Ltd.
- Thermo Fisher Scientific Inc.
第15章 付録
Exhibits:
- Exhibits1: Executive Summary - Chart on Market Overview
- Exhibits2: Executive Summary - Data Table on Market Overview
- Exhibits3: Executive Summary - Chart on Global Market Characteristics
- Exhibits4: Executive Summary - Chart on Market By Geographical Landscape
- Exhibits5: Executive Summary - Chart on Market Segmentation by Resin Type
- Exhibits6: Executive Summary - Chart on Market Segmentation by Application
- Exhibits7: Executive Summary - Chart on Incremental Growth
- Exhibits8: Executive Summary - Data Table on Incremental Growth
- Exhibits9: Executive Summary - Chart on Company Market Positioning
- Exhibits10: Analysis of price sensitivity, lifecycle, customer purchase basket, adoption rates, and purchase criteria
- Exhibits11: Overview on criticality of inputs and factors of differentiation
- Exhibits12: Overview on factors of disruption
- Exhibits13: Impact of drivers and challenges in 2023 and 2028
- Exhibits14: Parent Market
- Exhibits15: Data Table on - Parent Market
- Exhibits16: Market characteristics analysis
- Exhibits17: Value Chain Analysis
- Exhibits18: Offerings of companies included in the market definition
- Exhibits19: Market segments
- Exhibits20: Chart on Global - Market size and forecast 2023-2028 ($ million)
- Exhibits21: Data Table on Global - Market size and forecast 2023-2028 ($ million)
- Exhibits22: Chart on Global Market: Year-over-year growth 2023-2028 (%)
- Exhibits23: Data Table on Global Market: Year-over-year growth 2023-2028 (%)
- Exhibits24: Historic Market Size - Data Table on Global Adsorbent Resins Market 2018 - 2022 ($ million)
- Exhibits25: Historic Market Size - Resin Type Segment 2018 - 2022 ($ million)
- Exhibits26: Historic Market Size - Application Segment 2018 - 2022 ($ million)
- Exhibits27: Historic Market Size - Geography Segment 2018 - 2022 ($ million)
- Exhibits28: Historic Market Size - Country Segment 2018 - 2022 ($ million)
- Exhibits29: Five forces analysis - Comparison between 2023 and 2028
- Exhibits30: Bargaining power of buyers - Impact of key factors 2023 and 2028
- Exhibits31: Bargaining power of suppliers - Impact of key factors in 2023 and 2028
- Exhibits32: Threat of new entrants - Impact of key factors in 2023 and 2028
- Exhibits33: Threat of substitutes - Impact of key factors in 2023 and 2028
- Exhibits34: Threat of rivalry - Impact of key factors in 2023 and 2028
- Exhibits35: Chart on Market condition - Five forces 2023 and 2028
- Exhibits36: Chart on Resin Type - Market share 2023-2028 (%)
- Exhibits37: Data Table on Resin Type - Market share 2023-2028 (%)
- Exhibits38: Chart on Comparison by Resin Type
- Exhibits39: Data Table on Comparison by Resin Type
- Exhibits40: Chart on Synthetic resins - Market size and forecast 2023-2028 ($ million)
- Exhibits41: Data Table on Synthetic resins - Market size and forecast 2023-2028 ($ million)
- Exhibits42: Chart on Synthetic resins - Year-over-year growth 2023-2028 (%)
- Exhibits43: Data Table on Synthetic resins - Year-over-year growth 2023-2028 (%)
- Exhibits44: Chart on Natural resins - Market size and forecast 2023-2028 ($ million)
- Exhibits45: Data Table on Natural resins - Market size and forecast 2023-2028 ($ million)
- Exhibits46: Chart on Natural resins - Year-over-year growth 2023-2028 (%)
- Exhibits47: Data Table on Natural resins - Year-over-year growth 2023-2028 (%)
- Exhibits48: Market opportunity by Resin Type ($ million)
- Exhibits49: Data Table on Market opportunity by Resin Type ($ million)
- Exhibits50: Chart on Application - Market share 2023-2028 (%)
- Exhibits51: Data Table on Application - Market share 2023-2028 (%)
- Exhibits52: Chart on Comparison by Application
- Exhibits53: Data Table on Comparison by Application
- Exhibits54: Chart on Water and wastewater treatment - Market size and forecast 2023-2028 ($ million)
- Exhibits55: Data Table on Water and wastewater treatment - Market size and forecast 2023-2028 ($ million)
- Exhibits56: Chart on Water and wastewater treatment - Year-over-year growth 2023-2028 (%)
- Exhibits57: Data Table on Water and wastewater treatment - Year-over-year growth 2023-2028 (%)
- Exhibits58: Chart on Pharmaceuticals and biotechnology - Market size and forecast 2023-2028 ($ million)
- Exhibits59: Data Table on Pharmaceuticals and biotechnology - Market size and forecast 2023-2028 ($ million)
- Exhibits60: Chart on Pharmaceuticals and biotechnology - Year-over-year growth 2023-2028 (%)
- Exhibits61: Data Table on Pharmaceuticals and biotechnology - Year-over-year growth 2023-2028 (%)
- Exhibits62: Chart on Food and beverage - Market size and forecast 2023-2028 ($ million)
- Exhibits63: Data Table on Food and beverage - Market size and forecast 2023-2028 ($ million)
- Exhibits64: Chart on Food and beverage - Year-over-year growth 2023-2028 (%)
- Exhibits65: Data Table on Food and beverage - Year-over-year growth 2023-2028 (%)
- Exhibits66: Chart on Chemical manufacturing - Market size and forecast 2023-2028 ($ million)
- Exhibits67: Data Table on Chemical manufacturing - Market size and forecast 2023-2028 ($ million)
- Exhibits68: Chart on Chemical manufacturing - Year-over-year growth 2023-2028 (%)
- Exhibits69: Data Table on Chemical manufacturing - Year-over-year growth 2023-2028 (%)
- Exhibits70: Chart on Others - Market size and forecast 2023-2028 ($ million)
- Exhibits71: Data Table on Others - Market size and forecast 2023-2028 ($ million)
- Exhibits72: Chart on Others - Year-over-year growth 2023-2028 (%)
- Exhibits73: Data Table on Others - Year-over-year growth 2023-2028 (%)
- Exhibits74: Market opportunity by Application ($ million)
- Exhibits75: Data Table on Market opportunity by Application ($ million)
- Exhibits76: Analysis of price sensitivity, lifecycle, customer purchase basket, adoption rates, and purchase criteria
- Exhibits77: Chart on Market share By Geographical Landscape 2023-2028 (%)
- Exhibits78: Data Table on Market share By Geographical Landscape 2023-2028 (%)
- Exhibits79: Chart on Geographic comparison
- Exhibits80: Data Table on Geographic comparison
- Exhibits81: Chart on APAC - Market size and forecast 2023-2028 ($ million)
- Exhibits82: Data Table on APAC - Market size and forecast 2023-2028 ($ million)
- Exhibits83: Chart on APAC - Year-over-year growth 2023-2028 (%)
- Exhibits84: Data Table on APAC - Year-over-year growth 2023-2028 (%)
- Exhibits85: Chart on North America - Market size and forecast 2023-2028 ($ million)
- Exhibits86: Data Table on North America - Market size and forecast 2023-2028 ($ million)
- Exhibits87: Chart on North America - Year-over-year growth 2023-2028 (%)
- Exhibits88: Data Table on North America - Year-over-year growth 2023-2028 (%)
- Exhibits89: Chart on Europe - Market size and forecast 2023-2028 ($ million)
- Exhibits90: Data Table on Europe - Market size and forecast 2023-2028 ($ million)
- Exhibits91: Chart on Europe - Year-over-year growth 2023-2028 (%)
- Exhibits92: Data Table on Europe - Year-over-year growth 2023-2028 (%)
- Exhibits93: Chart on Middle East and Africa - Market size and forecast 2023-2028 ($ million)
- Exhibits94: Data Table on Middle East and Africa - Market size and forecast 2023-2028 ($ million)
- Exhibits95: Chart on Middle East and Africa - Year-over-year growth 2023-2028 (%)
- Exhibits96: Data Table on Middle East and Africa - Year-over-year growth 2023-2028 (%)
- Exhibits97: Chart on South America - Market size and forecast 2023-2028 ($ million)
- Exhibits98: Data Table on South America - Market size and forecast 2023-2028 ($ million)
- Exhibits99: Chart on South America - Year-over-year growth 2023-2028 (%)
- Exhibits100: Data Table on South America - Year-over-year growth 2023-2028 (%)
- Exhibits101: Chart on US - Market size and forecast 2023-2028 ($ million)
- Exhibits102: Data Table on US - Market size and forecast 2023-2028 ($ million)
- Exhibits103: Chart on US - Year-over-year growth 2023-2028 (%)
- Exhibits104: Data Table on US - Year-over-year growth 2023-2028 (%)
- Exhibits105: Chart on China - Market size and forecast 2023-2028 ($ million)
- Exhibits106: Data Table on China - Market size and forecast 2023-2028 ($ million)
- Exhibits107: Chart on China - Year-over-year growth 2023-2028 (%)
- Exhibits108: Data Table on China - Year-over-year growth 2023-2028 (%)
- Exhibits109: Chart on Germany - Market size and forecast 2023-2028 ($ million)
- Exhibits110: Data Table on Germany - Market size and forecast 2023-2028 ($ million)
- Exhibits111: Chart on Germany - Year-over-year growth 2023-2028 (%)
- Exhibits112: Data Table on Germany - Year-over-year growth 2023-2028 (%)
- Exhibits113: Chart on Japan - Market size and forecast 2023-2028 ($ million)
- Exhibits114: Data Table on Japan - Market size and forecast 2023-2028 ($ million)
- Exhibits115: Chart on Japan - Year-over-year growth 2023-2028 (%)
- Exhibits116: Data Table on Japan - Year-over-year growth 2023-2028 (%)
- Exhibits117: Chart on India - Market size and forecast 2023-2028 ($ million)
- Exhibits118: Data Table on India - Market size and forecast 2023-2028 ($ million)
- Exhibits119: Chart on India - Year-over-year growth 2023-2028 (%)
- Exhibits120: Data Table on India - Year-over-year growth 2023-2028 (%)
- Exhibits121: Chart on France - Market size and forecast 2023-2028 ($ million)
- Exhibits122: Data Table on France - Market size and forecast 2023-2028 ($ million)
- Exhibits123: Chart on France - Year-over-year growth 2023-2028 (%)
- Exhibits124: Data Table on France - Year-over-year growth 2023-2028 (%)
- Exhibits125: Chart on UK - Market size and forecast 2023-2028 ($ million)
- Exhibits126: Data Table on UK - Market size and forecast 2023-2028 ($ million)
- Exhibits127: Chart on UK - Year-over-year growth 2023-2028 (%)
- Exhibits128: Data Table on UK - Year-over-year growth 2023-2028 (%)
- Exhibits129: Chart on Brazil - Market size and forecast 2023-2028 ($ million)
- Exhibits130: Data Table on Brazil - Market size and forecast 2023-2028 ($ million)
- Exhibits131: Chart on Brazil - Year-over-year growth 2023-2028 (%)
- Exhibits132: Data Table on Brazil - Year-over-year growth 2023-2028 (%)
- Exhibits133: Chart on South Korea - Market size and forecast 2023-2028 ($ million)
- Exhibits134: Data Table on South Korea - Market size and forecast 2023-2028 ($ million)
- Exhibits135: Chart on South Korea - Year-over-year growth 2023-2028 (%)
- Exhibits136: Data Table on South Korea - Year-over-year growth 2023-2028 (%)
- Exhibits137: Chart on Canada - Market size and forecast 2023-2028 ($ million)
- Exhibits138: Data Table on Canada - Market size and forecast 2023-2028 ($ million)
- Exhibits139: Chart on Canada - Year-over-year growth 2023-2028 (%)
- Exhibits140: Data Table on Canada - Year-over-year growth 2023-2028 (%)
- Exhibits141: Market opportunity By Geographical Landscape ($ million)
- Exhibits142: Data Tables on Market opportunity By Geographical Landscape ($ million)
- Exhibits143: Impact of drivers and challenges in 2023 and 2028
- Exhibits144: Overview on criticality of inputs and factors of differentiation
- Exhibits145: Overview on factors of disruption
- Exhibits146: Impact of key risks on business
- Exhibits147: Companies covered
- Exhibits148: Company ranking index
- Exhibits149: Matrix on companies position and classification
- Exhibits150: Arkema - Overview
- Exhibits151: Arkema - Business segments
- Exhibits152: Arkema - Key news
- Exhibits153: Arkema - Key offerings
- Exhibits154: Arkema - Segment focus
- Exhibits155: SWOT
- Exhibits156: BASF SE - Overview
- Exhibits157: BASF SE - Business segments
- Exhibits158: BASF SE - Key news
- Exhibits159: BASF SE - Key offerings
- Exhibits160: BASF SE - Segment focus
- Exhibits161: SWOT
- Exhibits162: Bio Rad Laboratories Inc. - Overview
- Exhibits163: Bio Rad Laboratories Inc. - Business segments
- Exhibits164: Bio Rad Laboratories Inc. - Key news
- Exhibits165: Bio Rad Laboratories Inc. - Key offerings
- Exhibits166: Bio Rad Laboratories Inc. - Segment focus
- Exhibits167: SWOT
- Exhibits168: China Huayue New Materials Technology Group Co., Ltd. - Overview
- Exhibits169: China Huayue New Materials Technology Group Co., Ltd. - Product / Service
- Exhibits170: China Huayue New Materials Technology Group Co., Ltd. - Key offerings
- Exhibits171: SWOT
- Exhibits172: DuPont de Nemours Inc. - Overview
- Exhibits173: DuPont de Nemours Inc. - Business segments
- Exhibits174: DuPont de Nemours Inc. - Key news
- Exhibits175: DuPont de Nemours Inc. - Key offerings
- Exhibits176: DuPont de Nemours Inc. - Segment focus
- Exhibits177: SWOT
- Exhibits178: Ion Exchange India Ltd. - Overview
- Exhibits179: Ion Exchange India Ltd. - Business segments
- Exhibits180: Ion Exchange India Ltd. - Key offerings
- Exhibits181: Ion Exchange India Ltd. - Segment focus
- Exhibits182: SWOT
- Exhibits183: Jacobi Resins - Overview
- Exhibits184: Jacobi Resins - Product / Service
- Exhibits185: Jacobi Resins - Key offerings
- Exhibits186: SWOT
- Exhibits187: Lanxess AG - Overview
- Exhibits188: Lanxess AG - Business segments
- Exhibits189: Lanxess AG - Key news
- Exhibits190: Lanxess AG - Key offerings
- Exhibits191: Lanxess AG - Segment focus
- Exhibits192: SWOT
- Exhibits193: Mitsubishi Chemical Group Corp. - Overview
- Exhibits194: Mitsubishi Chemical Group Corp. - Business segments
- Exhibits195: Mitsubishi Chemical Group Corp. - Key news
- Exhibits196: Mitsubishi Chemical Group Corp. - Key offerings
- Exhibits197: Mitsubishi Chemical Group Corp. - Segment focus
- Exhibits198: SWOT
- Exhibits199: Purolite Corp. - Overview
- Exhibits200: Purolite Corp. - Product / Service
- Exhibits201: Purolite Corp. - Key offerings
- Exhibits202: SWOT
- Exhibits203: Sunresin New Materials Co.Ltd. - Overview
- Exhibits204: Sunresin New Materials Co.Ltd. - Product / Service
- Exhibits205: Sunresin New Materials Co.Ltd. - Key offerings
- Exhibits206: SWOT
- Exhibits207: Suzhou bojie resin technology Co.Ltd - Overview
- Exhibits208: Suzhou bojie resin technology Co.Ltd - Product / Service
- Exhibits209: Suzhou bojie resin technology Co.Ltd - Key offerings
- Exhibits210: SWOT
- Exhibits211: Taiyuan Lanlang Technology Industrial Corp. - Overview
- Exhibits212: Taiyuan Lanlang Technology Industrial Corp. - Product / Service
- Exhibits213: Taiyuan Lanlang Technology Industrial Corp. - Key offerings
- Exhibits214: SWOT
- Exhibits215: Thermax Ltd. - Overview
- Exhibits216: Thermax Ltd. - Business segments
- Exhibits217: Thermax Ltd. - Key news
- Exhibits218: Thermax Ltd. - Key offerings
- Exhibits219: Thermax Ltd. - Segment focus
- Exhibits220: SWOT
- Exhibits221: Thermo Fisher Scientific Inc. - Overview
- Exhibits222: Thermo Fisher Scientific Inc. - Business segments
- Exhibits223: Thermo Fisher Scientific Inc. - Key news
- Exhibits224: Thermo Fisher Scientific Inc. - Key offerings
- Exhibits225: Thermo Fisher Scientific Inc. - Segment focus
- Exhibits226: SWOT
- Exhibits227: Inclusions checklist
- Exhibits228: Exclusions checklist
- Exhibits229: Currency conversion rates for US$
- Exhibits230: Research methodology
- Exhibits231: Information sources
- Exhibits232: Data validation
- Exhibits233: Validation techniques employed for market sizing
- Exhibits234: Data synthesis
- Exhibits235: 360 degree market analysis
- Exhibits236: List of abbreviations
Adsorbent Resins Market 2024-2028
The adsorbent resins market is forecasted to grow by USD 662.7 mn during 2023-2028, accelerating at a CAGR of 7% during the forecast period. The report on the adsorbent resins market provides a holistic analysis, market size and forecast, trends, growth drivers, and challenges, as well as vendor analysis covering around 25 vendors.
The report offers an up-to-date analysis regarding the current market scenario, the latest trends and drivers, and the overall market environment. The market is driven by new product launches by vendors, increasing demand from pharmaceutical industry, and technological advancement.
| Market Scope | |
|---|---|
| Base Year | 2024 |
| End Year | 2028 |
| Series Year | 2024-2028 |
| Growth Momentum | Accelerate |
| YOY 2024 | 6.3% |
| CAGR | 7% |
| Incremental Value | $662.7 mn |
Technavio's adsorbent resins market is segmented as below:
By Resin Type
- Synthetic resins
- Natural resins
By Application
- Water and wastewater treatment
- Pharmaceuticals and biotechnology
- Food and beverage
- Chemical manufacturing
- Others
By Geographical Landscape
- APAC
- North America
- Europe
- Middle East and Africa
- South America
This study identifies the increasing demand for bio-based adsorbent resin as one of the prime reasons driving the adsorbent resins market growth during the next few years. Also, expansion of production facility and inorganic growth strategies by vendors will lead to sizable demand in the market.
The report on the adsorbent resins market covers the following areas:
- Adsorbent Resins Market sizing
- Adsorbent Resins Market forecast
- Adsorbent Resins Market industry analysis
The robust vendor analysis is designed to help clients improve their market position, and in line with this, this report provides a detailed analysis of several leading adsorbent resins market vendors that include Arkema, BASF SE, Bengbu Dongli Chemical Co Ltd., Bio Rad Laboratories Inc., China Huayue New Materials Technology Group Co., Ltd., DuPont de Nemours Inc., Henan Comcess Industry Co., Ltd. A, Hengshui Snowate Environmental Technology Co Ltd., Ion Exchange India Ltd., IPSUM LIFESCIENCES LLP, Jacobi Resins, Lanxess AG, Merck KGaA, Mitsubishi Chemical Group Corp., Purolite Corp., Sunresin New Materials Co.Ltd., Suzhou bojie resin technology Co.Ltd, Taiyuan Lanlang Technology Industrial Corp., Thermax Ltd., and Thermo Fisher Scientific Inc.. Also, the adsorbent resins market analysis report includes information on upcoming trends and challenges that will influence market growth. This is to help companies strategize and leverage all forthcoming growth opportunities.
The study was conducted using an objective combination of primary and secondary information including inputs from key participants in the industry. The report contains a comprehensive market and vendor landscape in addition to an analysis of the key vendors.
The publisher presents a detailed picture of the market by the way of study, synthesis, and summation of data from multiple sources by an analysis of key parameters such as profit, pricing, competition, and promotions. It presents various market facets by identifying the key industry influencers. The data presented is comprehensive, reliable, and a result of extensive primary and secondary research. The market research reports provide a complete competitive landscape and an in-depth vendor selection methodology and analysis using qualitative and quantitative research to forecast accurate market growth.
Table of Contents
1 Executive Summary
- 1.1 Market overview
- Executive Summary - Chart on Market Overview
- Executive Summary - Data Table on Market Overview
- Executive Summary - Chart on Global Market Characteristics
- Executive Summary - Chart on Market By Geographical Landscape
- Executive Summary - Chart on Market Segmentation by Resin Type
- Executive Summary - Chart on Market Segmentation by Application
- Executive Summary - Chart on Incremental Growth
- Executive Summary - Data Table on Incremental Growth
- Executive Summary - Chart on Company Market Positioning
2 Technavio Analysis
- 2.1 Analysis of price sensitivity, lifecycle, customer purchase basket, adoption rates, and purchase criteria
- Analysis of price sensitivity, lifecycle, customer purchase basket, adoption rates, and purchase criteria
- 2.2 Criticality of inputs and Factors of differentiation
- Overview on criticality of inputs and factors of differentiation
- 2.3 Factors of disruption
- Overview on factors of disruption
- 2.4 Impact of drivers and challenges
- Impact of drivers and challenges in 2023 and 2028
3 Market Landscape
- 3.1 Market ecosystem
- Parent Market
- Data Table on - Parent Market
- 3.2 Market characteristics
- Market characteristics analysis
- 3.3 Value chain analysis
- Value Chain Analysis
4 Market Sizing
- 4.1 Market definition
- Offerings of companies included in the market definition
- 4.2 Market segment analysis
- Market segments
- 4.3 Market size 2023
- 4.4 Market outlook: Forecast for 2023-2028
- Chart on Global - Market size and forecast 2023-2028 ($ million)
- Data Table on Global - Market size and forecast 2023-2028 ($ million)
- Chart on Global Market: Year-over-year growth 2023-2028 (%)
- Data Table on Global Market: Year-over-year growth 2023-2028 (%)
5 Historic Market Size
- 5.1 Global Adsorbent Resins Market 2018 - 2022
- Historic Market Size - Data Table on Global Adsorbent Resins Market 2018 - 2022 ($ million)
- 5.2 Resin Type segment analysis 2018 - 2022
- Historic Market Size - Resin Type Segment 2018 - 2022 ($ million)
- 5.3 Application segment analysis 2018 - 2022
- Historic Market Size - Application Segment 2018 - 2022 ($ million)
- 5.4 Geography segment analysis 2018 - 2022
- Historic Market Size - Geography Segment 2018 - 2022 ($ million)
- 5.5 Country segment analysis 2018 - 2022
- Historic Market Size - Country Segment 2018 - 2022 ($ million)
6 Qualitative Analysis
- 6.1 Impact of AI on the Global Adsorbent Resins Market
7 Five Forces Analysis
- 7.1 Five forces summary
- Five forces analysis - Comparison between 2023 and 2028
- 7.2 Bargaining power of buyers
- Bargaining power of buyers - Impact of key factors 2023 and 2028
- 7.3 Bargaining power of suppliers
- Bargaining power of suppliers - Impact of key factors in 2023 and 2028
- 7.4 Threat of new entrants
- Threat of new entrants - Impact of key factors in 2023 and 2028
- 7.5 Threat of substitutes
- Threat of substitutes - Impact of key factors in 2023 and 2028
- 7.6 Threat of rivalry
- Threat of rivalry - Impact of key factors in 2023 and 2028
- 7.7 Market condition
- Chart on Market condition - Five forces 2023 and 2028
8 Market Segmentation by Resin Type
- 8.1 Market segments
- Chart on Resin Type - Market share 2023-2028 (%)
- Data Table on Resin Type - Market share 2023-2028 (%)
- 8.2 Comparison by Resin Type
- Chart on Comparison by Resin Type
- Data Table on Comparison by Resin Type
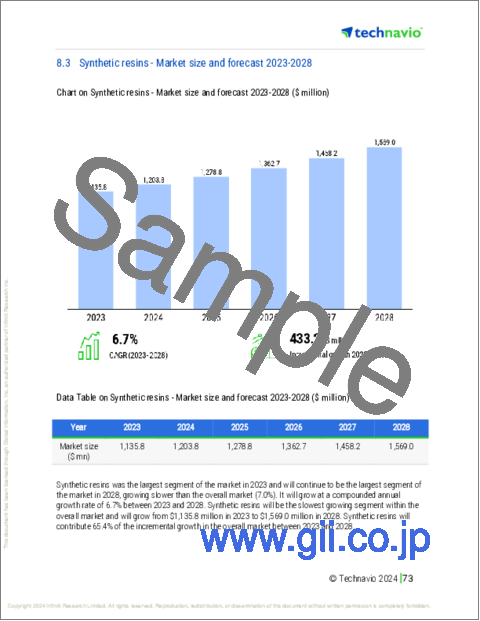
- 8.3 Synthetic resins - Market size and forecast 2023-2028
- Chart on Synthetic resins - Market size and forecast 2023-2028 ($ million)
- Data Table on Synthetic resins - Market size and forecast 2023-2028 ($ million)
- Chart on Synthetic resins - Year-over-year growth 2023-2028 (%)
- Data Table on Synthetic resins - Year-over-year growth 2023-2028 (%)
- 8.4 Natural resins - Market size and forecast 2023-2028
- Chart on Natural resins - Market size and forecast 2023-2028 ($ million)
- Data Table on Natural resins - Market size and forecast 2023-2028 ($ million)
- Chart on Natural resins - Year-over-year growth 2023-2028 (%)
- Data Table on Natural resins - Year-over-year growth 2023-2028 (%)
- 8.5 Market opportunity by Resin Type
- Market opportunity by Resin Type ($ million)
- Data Table on Market opportunity by Resin Type ($ million)
9 Market Segmentation by Application
- 9.1 Market segments
- Chart on Application - Market share 2023-2028 (%)
- Data Table on Application - Market share 2023-2028 (%)
- 9.2 Comparison by Application
- Chart on Comparison by Application
- Data Table on Comparison by Application
- 9.3 Water and wastewater treatment - Market size and forecast 2023-2028
- Chart on Water and wastewater treatment - Market size and forecast 2023-2028 ($ million)
- Data Table on Water and wastewater treatment - Market size and forecast 2023-2028 ($ million)
- Chart on Water and wastewater treatment - Year-over-year growth 2023-2028 (%)
- Data Table on Water and wastewater treatment - Year-over-year growth 2023-2028 (%)
- 9.4 Pharmaceuticals and biotechnology - Market size and forecast 2023-2028
- Chart on Pharmaceuticals and biotechnology - Market size and forecast 2023-2028 ($ million)
- Data Table on Pharmaceuticals and biotechnology - Market size and forecast 2023-2028 ($ million)
- Chart on Pharmaceuticals and biotechnology - Year-over-year growth 2023-2028 (%)
- Data Table on Pharmaceuticals and biotechnology - Year-over-year growth 2023-2028 (%)
- 9.5 Food and beverage - Market size and forecast 2023-2028
- Chart on Food and beverage - Market size and forecast 2023-2028 ($ million)
- Data Table on Food and beverage - Market size and forecast 2023-2028 ($ million)
- Chart on Food and beverage - Year-over-year growth 2023-2028 (%)
- Data Table on Food and beverage - Year-over-year growth 2023-2028 (%)
- 9.6 Chemical manufacturing - Market size and forecast 2023-2028
- Chart on Chemical manufacturing - Market size and forecast 2023-2028 ($ million)
- Data Table on Chemical manufacturing - Market size and forecast 2023-2028 ($ million)
- Chart on Chemical manufacturing - Year-over-year growth 2023-2028 (%)
- Data Table on Chemical manufacturing - Year-over-year growth 2023-2028 (%)
- 9.7 Others - Market size and forecast 2023-2028
- Chart on Others - Market size and forecast 2023-2028 ($ million)
- Data Table on Others - Market size and forecast 2023-2028 ($ million)
- Chart on Others - Year-over-year growth 2023-2028 (%)
- Data Table on Others - Year-over-year growth 2023-2028 (%)
- 9.8 Market opportunity by Application
- Market opportunity by Application ($ million)
- Data Table on Market opportunity by Application ($ million)
10 Customer Landscape
- 10.1 Customer landscape overview
- Analysis of price sensitivity, lifecycle, customer purchase basket, adoption rates, and purchase criteria
11 Geographic Landscape
- 11.1 Geographic segmentation
- Chart on Market share By Geographical Landscape 2023-2028 (%)
- Data Table on Market share By Geographical Landscape 2023-2028 (%)
- 11.2 Geographic comparison
- Chart on Geographic comparison
- Data Table on Geographic comparison
- 11.3 APAC - Market size and forecast 2023-2028
- Chart on APAC - Market size and forecast 2023-2028 ($ million)
- Data Table on APAC - Market size and forecast 2023-2028 ($ million)
- Chart on APAC - Year-over-year growth 2023-2028 (%)
- Data Table on APAC - Year-over-year growth 2023-2028 (%)
- 11.4 North America - Market size and forecast 2023-2028
- Chart on North America - Market size and forecast 2023-2028 ($ million)
- Data Table on North America - Market size and forecast 2023-2028 ($ million)
- Chart on North America - Year-over-year growth 2023-2028 (%)
- Data Table on North America - Year-over-year growth 2023-2028 (%)
- 11.5 Europe - Market size and forecast 2023-2028
- Chart on Europe - Market size and forecast 2023-2028 ($ million)
- Data Table on Europe - Market size and forecast 2023-2028 ($ million)
- Chart on Europe - Year-over-year growth 2023-2028 (%)
- Data Table on Europe - Year-over-year growth 2023-2028 (%)
- 11.6 Middle East and Africa - Market size and forecast 2023-2028
- Chart on Middle East and Africa - Market size and forecast 2023-2028 ($ million)
- Data Table on Middle East and Africa - Market size and forecast 2023-2028 ($ million)
- Chart on Middle East and Africa - Year-over-year growth 2023-2028 (%)
- Data Table on Middle East and Africa - Year-over-year growth 2023-2028 (%)
- 11.7 South America - Market size and forecast 2023-2028
- Chart on South America - Market size and forecast 2023-2028 ($ million)
- Data Table on South America - Market size and forecast 2023-2028 ($ million)
- Chart on South America - Year-over-year growth 2023-2028 (%)
- Data Table on South America - Year-over-year growth 2023-2028 (%)
- 11.8 US - Market size and forecast 2023-2028
- Chart on US - Market size and forecast 2023-2028 ($ million)
- Data Table on US - Market size and forecast 2023-2028 ($ million)
- Chart on US - Year-over-year growth 2023-2028 (%)
- Data Table on US - Year-over-year growth 2023-2028 (%)
- 11.9 China - Market size and forecast 2023-2028
- Chart on China - Market size and forecast 2023-2028 ($ million)
- Data Table on China - Market size and forecast 2023-2028 ($ million)
- Chart on China - Year-over-year growth 2023-2028 (%)
- Data Table on China - Year-over-year growth 2023-2028 (%)
- 11.10 Germany - Market size and forecast 2023-2028
- Chart on Germany - Market size and forecast 2023-2028 ($ million)
- Data Table on Germany - Market size and forecast 2023-2028 ($ million)
- Chart on Germany - Year-over-year growth 2023-2028 (%)
- Data Table on Germany - Year-over-year growth 2023-2028 (%)
- 11.11 Japan - Market size and forecast 2023-2028
- Chart on Japan - Market size and forecast 2023-2028 ($ million)
- Data Table on Japan - Market size and forecast 2023-2028 ($ million)
- Chart on Japan - Year-over-year growth 2023-2028 (%)
- Data Table on Japan - Year-over-year growth 2023-2028 (%)
- 11.12 India - Market size and forecast 2023-2028
- Chart on India - Market size and forecast 2023-2028 ($ million)
- Data Table on India - Market size and forecast 2023-2028 ($ million)
- Chart on India - Year-over-year growth 2023-2028 (%)
- Data Table on India - Year-over-year growth 2023-2028 (%)
- 11.13 France - Market size and forecast 2023-2028
- Chart on France - Market size and forecast 2023-2028 ($ million)
- Data Table on France - Market size and forecast 2023-2028 ($ million)
- Chart on France - Year-over-year growth 2023-2028 (%)
- Data Table on France - Year-over-year growth 2023-2028 (%)
- 11.14 UK - Market size and forecast 2023-2028
- Chart on UK - Market size and forecast 2023-2028 ($ million)
- Data Table on UK - Market size and forecast 2023-2028 ($ million)
- Chart on UK - Year-over-year growth 2023-2028 (%)
- Data Table on UK - Year-over-year growth 2023-2028 (%)
- 11.15 Brazil - Market size and forecast 2023-2028
- Chart on Brazil - Market size and forecast 2023-2028 ($ million)
- Data Table on Brazil - Market size and forecast 2023-2028 ($ million)
- Chart on Brazil - Year-over-year growth 2023-2028 (%)
- Data Table on Brazil - Year-over-year growth 2023-2028 (%)
- 11.16 South Korea - Market size and forecast 2023-2028
- Chart on South Korea - Market size and forecast 2023-2028 ($ million)
- Data Table on South Korea - Market size and forecast 2023-2028 ($ million)
- Chart on South Korea - Year-over-year growth 2023-2028 (%)
- Data Table on South Korea - Year-over-year growth 2023-2028 (%)
- 11.17 Canada - Market size and forecast 2023-2028
- Chart on Canada - Market size and forecast 2023-2028 ($ million)
- Data Table on Canada - Market size and forecast 2023-2028 ($ million)
- Chart on Canada - Year-over-year growth 2023-2028 (%)
- Data Table on Canada - Year-over-year growth 2023-2028 (%)
- 11.18 Market opportunity By Geographical Landscape
- Market opportunity By Geographical Landscape ($ million)
- Data Tables on Market opportunity By Geographical Landscape ($ million)
12 Drivers, Challenges, and Opportunity/Restraints
- 12.1 Market drivers
- 12.2 Market challenges
- 12.3 Impact of drivers and challenges
- Impact of drivers and challenges in 2023 and 2028
- 12.4 Market opportunities/restraints
13 Competitive Landscape
- 13.1 Overview
- 13.2 Competitive Landscape
- Overview on criticality of inputs and factors of differentiation
- 13.3 Landscape disruption
- Overview on factors of disruption
- 13.4 Industry risks
- Impact of key risks on business
14 Competitive Analysis
- 14.1 Companies profiled
- Companies covered
- 14.2 Company ranking index
- Company ranking index
- 14.3 Market positioning of companies
- Matrix on companies position and classification
- 14.4 Arkema
- Arkema - Overview
- Arkema - Business segments
- Arkema - Key news
- Arkema - Key offerings
- Arkema - Segment focus
- SWOT
- 14.5 BASF SE
- BASF SE - Overview
- BASF SE - Business segments
- BASF SE - Key news
- BASF SE - Key offerings
- BASF SE - Segment focus
- SWOT
- 14.6 Bio Rad Laboratories Inc.
- Bio Rad Laboratories Inc. - Overview
- Bio Rad Laboratories Inc. - Business segments
- Bio Rad Laboratories Inc. - Key news
- Bio Rad Laboratories Inc. - Key offerings
- Bio Rad Laboratories Inc. - Segment focus
- SWOT
- 14.7 China Huayue New Materials Technology Group Co., Ltd.
- China Huayue New Materials Technology Group Co., Ltd. - Overview
- China Huayue New Materials Technology Group Co., Ltd. - Product / Service
- China Huayue New Materials Technology Group Co., Ltd. - Key offerings
- SWOT
- 14.8 DuPont de Nemours Inc.
- DuPont de Nemours Inc. - Overview
- DuPont de Nemours Inc. - Business segments
- DuPont de Nemours Inc. - Key news
- DuPont de Nemours Inc. - Key offerings
- DuPont de Nemours Inc. - Segment focus
- SWOT
- 14.9 Ion Exchange India Ltd.
- Ion Exchange India Ltd. - Overview
- Ion Exchange India Ltd. - Business segments
- Ion Exchange India Ltd. - Key offerings
- Ion Exchange India Ltd. - Segment focus
- SWOT
- 14.10 Jacobi Resins
- Jacobi Resins - Overview
- Jacobi Resins - Product / Service
- Jacobi Resins - Key offerings
- SWOT
- 14.11 Lanxess AG
- Lanxess AG - Overview
- Lanxess AG - Business segments
- Lanxess AG - Key news
- Lanxess AG - Key offerings
- Lanxess AG - Segment focus
- SWOT
- 14.12 Mitsubishi Chemical Group Corp.
- Mitsubishi Chemical Group Corp. - Overview
- Mitsubishi Chemical Group Corp. - Business segments
- Mitsubishi Chemical Group Corp. - Key news
- Mitsubishi Chemical Group Corp. - Key offerings
- Mitsubishi Chemical Group Corp. - Segment focus
- SWOT
- 14.13 Purolite Corp.
- Purolite Corp. - Overview
- Purolite Corp. - Product / Service
- Purolite Corp. - Key offerings
- SWOT
- 14.14 Sunresin New Materials Co.Ltd.
- Sunresin New Materials Co.Ltd. - Overview
- Sunresin New Materials Co.Ltd. - Product / Service
- Sunresin New Materials Co.Ltd. - Key offerings
- SWOT
- 14.15 Suzhou bojie resin technology Co.Ltd
- Suzhou bojie resin technology Co.Ltd - Overview
- Suzhou bojie resin technology Co.Ltd - Product / Service
- Suzhou bojie resin technology Co.Ltd - Key offerings
- SWOT
- 14.16 Taiyuan Lanlang Technology Industrial Corp.
- Taiyuan Lanlang Technology Industrial Corp. - Overview
- Taiyuan Lanlang Technology Industrial Corp. - Product / Service
- Taiyuan Lanlang Technology Industrial Corp. - Key offerings
- SWOT
- 14.17 Thermax Ltd.
- Thermax Ltd. - Overview
- Thermax Ltd. - Business segments
- Thermax Ltd. - Key news
- Thermax Ltd. - Key offerings
- Thermax Ltd. - Segment focus
- SWOT
- 14.18 Thermo Fisher Scientific Inc.
- Thermo Fisher Scientific Inc. - Overview
- Thermo Fisher Scientific Inc. - Business segments
- Thermo Fisher Scientific Inc. - Key news
- Thermo Fisher Scientific Inc. - Key offerings
- Thermo Fisher Scientific Inc. - Segment focus
- SWOT
15 Appendix
- 15.1 Scope of the report
- 15.2 Inclusions and exclusions checklist
- Inclusions checklist
- Exclusions checklist
- 15.3 Currency conversion rates for US$
- Currency conversion rates for US$
- 15.4 Research methodology
- Research methodology
- 15.5 Data procurement
- Information sources
- 15.6 Data validation
- Data validation
- 15.7 Validation techniques employed for market sizing
- Validation techniques employed for market sizing
- 15.8 Data synthesis
- Data synthesis
- 15.9 360 degree market analysis
- 360 degree market analysis
- 15.10 List of abbreviations
- List of abbreviations

