|
|
市場調査レポート
商品コード
1188830
食肉加工品の世界市場-2028年までの市場規模、シェア、予測Global Processed Meat Market - Size, Share & Forecasts up to 2028 |
||||||
|
|
|||||||
|
● お客様のご希望に応じて、既存データの加工や未掲載情報(例:国別セグメント)の追加などの対応が可能です。 詳細はお問い合わせください。 |
|||||||


価格
| 食肉加工品の世界市場-2028年までの市場規模、シェア、予測 |
|
出版日: 2023年01月18日
発行: Mordor Intelligence
ページ情報: 英文 396 Pages
納期: 2~3営業日
|
ご注意事項 :
本レポートは最新情報反映のため適宜更新し、内容構成変更を行う場合があります。ご検討の際はお問い合わせください。
- 全表示
- 概要
- 目次
概要
食肉加工品の世界市場のCAGRは2.17%と予測されています。
主なハイライト
- 製品タイプ別最大セグメント-豚肉:ベーコン、ソーセージ、ハムなどの製品により、豚肉加工品の需要が高まっています。朝食や昼食で消費されることが多いため、需要が伸びています。
- 地域別最大市場であるアジア太平洋地域:アジア諸国では、硬化剤として硝酸塩を使用することのリスクに対する消費者の認識が高まっており、亜硝酸塩を含まない食肉加工製品の需要が増加しています。
- 製品タイプ別急成長セグメント-マトン: 各国のエスニック料理をベースにしたマトン製品のイノベーションと新発売により、消費者はマトンの消費を増やしています。
- 地域別急成長セグメント:アフリカ:可処分所得の増加と供給量の増加により、食肉加工品はアフリカの人々にとってより身近なものとなり、食肉はより安価になっています。
食肉加工品の市場動向
タイプ別では豚肉が最大。
- 食肉加工品は安定した速度で成長しており、2016年から2021年にかけてCAGR4.20%で進行しました。2021年の食肉加工品市場全体の成長率は4.78%でした。食肉加工品の中で最も消費されているのは豚肉加工品です。豚肉を消費しない地域やコミュニティがあるとしても、欧州とアジアでは最も消費されている肉であり、世界では鶏肉に次いで2番目です。ランチミート、ホットドッグ、ベーコン、ソーセージ、スモークハム、その他の豚肉加工品が豚肉加工品のカテゴリーを構成しています。様々な人種を考慮すると、豚肉加工品はアフリカ系アメリカ人やヒスパニック系のコミュニティで特に人気があります。
- 食肉加工品の中で最も急速に成長しているのは、予測期間中にCAGR 4.10%を記録すると予測されるその他の肉カテゴリーです。食肉加工品分野では、より健康的な食肉加工品に関連する消費者の継続的な需要を満たすために、絶え間ない技術革新が行われています。そのアプローチは、塩化ナトリウム、亜硝酸塩、硝酸塩などの不健康な成分の量を減らすか、硝酸塩をセロリパウダーなどの他の硬化剤に置き換えるなど、健康に良い効果をもたらす成分の数を増やすことに重点を置いています。
- 食肉加工品は主にオン・トレード・チャネルで消費されています。2020年、市場は13.28%の急激な落ち込みを示しましたが、これは主に外食産業を制限する国境を越えたロックダウン規制のためです。さらに、オフトレードチャネルの面では、食肉加工品は主にスーパーマーケットなどの小売店を通じて販売されていました。2020年、豚肉の販売額は41.35%を占め、鶏肉は32.47%を占めました。これは主に、消費者のパニック買いや、保存性の高い食肉加工品による必需品の備蓄と相まって起こったものです。
地域別ではアジア太平洋地域が最も大きいです。
- 世界中の食肉加工品の売上は緩やかな成長率で伸びており、2021年には前年比成長率4.78%を観測しました。調理・加工品、特に食肉加工品の需要はアジア全域で高まっており、世界市場の41.7%という大きな割合を占めています。顧客は時間に制約されるようになったため、これらの商品の利便性を受け入れており、2016年から2021年にかけて、売上は21.6%上昇しました。各国は、肉製品の小売価格を下げるために国内生産の増加に注力しており、中国は2020年に36,340トンの豚肉を生産して世界をリードし、この地域で食肉加工品として消費された主要な肉であるようです。
- 欧州は2021年に22%のシェアを持ち、市場で2番目に高いシェアを占めています。食肉加工品の硬化剤として硝酸塩を使用することの危険性に対する消費者の意識の高まりが、欧州諸国におけるベーコンのような亜硝酸塩を含まない食肉加工品製品の需要を押し上げ、2019年から2021年の売上を5.88%押し上げました。食肉加工品市場は競争が激しく、Hormel Foods Corporation、Conagra Brands Inc.、WH Group Limitedなどのプレーヤーが支配する多くの地域および国際的な競合から構成されています。
- アフリカは、予測期間2022-2028年に金額ベースでCAGR 3.99%を記録し、最も急速に成長する地域と予測されます。消費者の間で需要が高まっているため、南アフリカの鶏肉国内供給量は2010年の170万7,000トンから2019年には218万6,000に増加し、平均年率2.80%で成長しています。さらに、生産施設や養鶏場への投資により、アフリカの国内生産量は2016年から2021年にかけて11.2%増加しました。さらに、鶏肉はアフリカで2番目に消費される肉であり、1人当たりの消費量は34.79kg/人となっています。
食肉加工品市場の競合分析
世界の食肉加工品市場は断片的であり、上位5社で19.76%を占めています。この市場の主要なプレーヤーは、Hormel Foods Corporation、Marfrig Global Foods SA、Sysco Corporation、Tyson Foods Inc.、WH Group Limited(アルファベット順に並べ替え)です。
その他の特典
- エクセル形式の市場予測(ME)シート
- アナリストによる3ヶ月間のサポート
目次
第1章 エグゼクティブサマリー&キーファインディング
第2章 イントロダクション
- 調査の前提条件と市場の定義
- 調査対象範囲
- 調査手法
第3章 主要な産業動向
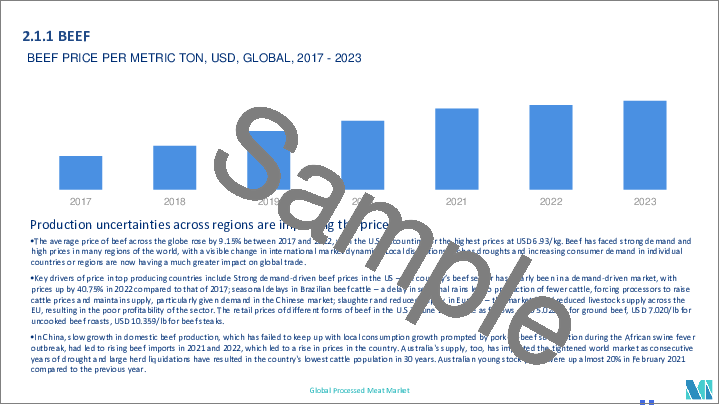
- 価格動向
- 生産動向
- 規制の枠組み
- バリューチェーンと流通チャネル分析
第4章 市場セグメンテーション
- 品種
- ビーフ
- マトン
- 豚肉
- 家禽類
- その他の肉類
- 流通経路
- オフトレード
- コンビニエンスストア
- オンラインチャネル
- スーパーマーケット、ハイパーマーケット
- その他
- オントレード
- オフトレード
- 地域別
- アフリカ
- タイプ別
- 販売チャネル別
- 国別
- エジプト
- ナイジェリア
- 南アフリカ
- その他のアフリカ地域
- アジア太平洋地域
- タイプ別
- 販売チャネル別
- 国別
- オーストラリア
- 中国
- インド
- インドネシア
- 日本
- マレーシア
- 韓国
- その他アジア太平洋地域
- 欧州
- タイプ別
- 販売チャネル別
- 国別
- フランス
- ドイツ
- イタリア
- オランダ
- ロシア
- スペイン
- 英国
- その他欧州
- 中東地域
- タイプ別
- 販売チャネル別
- 国別
- バーレーン
- クウェート
- オマーン
- カタール
- サウジアラビア
- アラブ首長国連邦
- その他の中東地域
- 北米
- タイプ別
- 販売チャネル別
- 国別
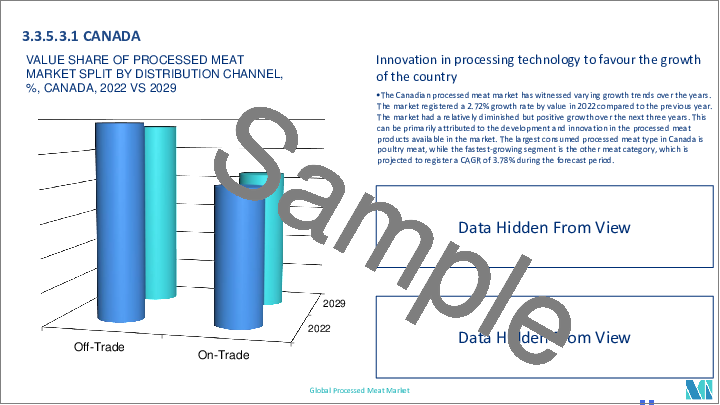
- カナダ
- メキシコ
- 米国
- その他北米地域
- 南米
- タイプ別
- 販売チャネル別
- 国別
- アルゼンチン
- ブラジル
- その他の南米地域
- アフリカ
第5章 競合情勢
- Key Strategic Moves
- 市場シェア分析
- Company Landscape
- 企業プロファイル
- BRF S.A.
- Cargill, Inc
- COFCO Corporation
- Conagra Brands Incorporated
- Hormel Foods Corporation
- Itoham Yonekyu Holdings, Inc.
- JBS S.A.
- Marfrig Global Foods SA
- OSI Group
- Sysco Corporation
- The Kraft Heinz Company
- Tyson Foods Inc.
- Wen's Food Group Co.,Ltd
- WH Group Limited
第6章 CEOへの主な戦略的質問
第7章 付録
- 世界概要
- 概要
- ファイブフォース分析のフレームワーク
- 世界バリューチェーン分析
- 市場力学(DRO)
- 出典・参考文献
- 表と図のリスト
- プライマリーインサイト
- データパック
- 用語集
目次
Product Code: 92490
The Global Processed Meat Market is projected to register a CAGR of 2.17%
Key Highlights
- Largest Segment by Type - Pork : Products such as bacon, sausages, and ham have boosted the demand for processed pork items. The growth in demand is due to its growing consumption in breakfast or lunch.
- Largest Segment by Region - Asia-Pacific : Demand for nitrite-free processed meat products is increasing in Asian countries due to growing consumer awareness of the risks related to using nitrate as a curing agent.
- Fastest-growing Segment by Type - Mutton : Consumers are being driven by innovations and new launches of mutton products based on ethnic foods from various countries, resulting in more consumption of the meat.
- Fastest-growing Segment by Region - Africa : Processed meat products have become more accessible to the African population due to the rising disposable income and increasing supply in the region making meat much cheaper.
Processed Meat Market Trends
Pork is the largest segment by Type.
- Processed meat has been growing at a steady rate, and it progressed at a CAGR of 4.20% from 2016 to 2021. The overall growth rate of the processed meat market was 4.78% in 2021. The most consumed processed meat type is processed pork. Even though some communities or regions do not consume pork, it is the most consumed meat in Europe and Asia and the second worldwide just after poultry. Lunch meats, hot dogs, bacon, sausage, smoked ham, and other processed pork make up the category of processed pork. Considering various ethnicities, processed pork is particularly popular among the African-American and Hispanic communities.
- The fastest-growing segment of processed meat is the other meat category which is projected to record a CAGR of 4.10% during the forecast period. Constant innovations are taking place in the processed meat sector to fulfil the ongoing demand of consumers related to healthier processed meats. The approaches are either focus on decreasing the amount of unhealthy ingredients such as less sodium chloride, nitrite, and nitrate or rise in the number of ingredients that have positive health effects such as replacing nitrate with other curing agents, like celery powder.
- Processed meats are primarily consumed via on-trade channels. In 2020, the market witnessed a sudden dip of 13.28%, primarily due to the lockdown restrictions across the borders which limit the food service sector. Moreover, in terms of off-trade channels, processed meat products were primarily sold through retail outlets like supermarkets. In 2020, pork sales represented 41.35% of the total value of meat sold, while poultry meat contributed 32.47%. This mainly happened because of consumers' panic buying coupled with stocking up of essential commodities with shelf-stable processed meat.
Asia-Pacific is the largest segment by Region.
- Sales for processed meat around the world are growing at a moderate growth rate, which observed a y-o-y growth rate of 4.78% in 2021. The demand for prepared and processed goods, especially processed meats, is rising throughout Asia, where it accounts for a sizable 41.7% of the global market. Customers have embraced the convenience of these goods as they become more time-constrained, from 2016 to 2021, revenues climbed by 21.6%. Countries are focusing on increasing domestic production to reduce the retail prices for the meat products like, China led the world in producing 36,340 metric tons of pork in 2020, which is major meat that was consumed as processed meat in the region.
- Europe holds the second highest share in the market with a share of 22% in 2021; Growing consumer awareness of the dangers of using nitrate as a curing agent in processed meat is driving up demand for nitrite-free processed meat products like bacon in European nations, which boosted sales by 5.88% between 2019 and 2021. The processed meat market is competitive and comprises many regional and international competitors which are dominated by players like Hormel Foods Corporation, Conagra Brands Inc., and WH Group Limited.
- Africa is projected to be the fastest growing region with a CAGR of 3.99% by value during the forecasted period 2022-2028. Owing to the rising demand among consumers, the Poultry meat domestic supply in South Africa increased from 1,707 thousand tons in 2010 to 2,186 thousand tons in 2019, growing at an average annual rate of 2.80%. Furthermore, domestic production in Africa increased by 11.2% from 2016 to 2021 due to investments in production facilities and poultry farms. Moreover, poultry is the second most consumed meat in Africa, with a per capita consumption of 34.79 kg/capita.
Processed Meat Market Competitive Analysis
The Global Processed Meat Market is fragmented, with the top five companies occupying 19.76%. The major players in this market are Hormel Foods Corporation, Marfrig Global Foods SA, Sysco Corporation, Tyson Foods Inc. and WH Group Limited (sorted alphabetically).
Additional Benefits:
- The market estimate (ME) sheet in Excel format
- 3 months of analyst support
TABLE OF CONTENTS
1 EXECUTIVE SUMMARY & KEY FINDINGS
2 INTRODUCTION
- 2.1 Study Assumptions & Market Definition
- 2.2 Scope of the Study
- 2.3 Research Methodology
3 KEY INDUSTRY TRENDS
- 3.1 Price Trends
- 3.2 Production Trends
- 3.3 Regulatory Framework
- 3.4 Value Chain & Distribution Channel Analysis
4 MARKET SEGMENTATION
- 4.1 Type
- 4.1.1 Beef
- 4.1.2 Mutton
- 4.1.3 Pork
- 4.1.4 Poultry
- 4.1.5 Other Meat
- 4.2 Distribution Channel
- 4.2.1 Off-Trade
- 4.2.1.1 Convenience Stores
- 4.2.1.2 Online Channel
- 4.2.1.3 Supermarkets And Hypermarkets
- 4.2.1.4 Others
- 4.2.2 On-Trade
- 4.2.1 Off-Trade
- 4.3 Region
- 4.3.1 Africa
- 4.3.1.1 By Type
- 4.3.1.2 By Distribution Channel
- 4.3.1.3 By Country
- 4.3.1.3.1 Egypt
- 4.3.1.3.2 Nigeria
- 4.3.1.3.3 South Africa
- 4.3.1.3.4 Rest Of Africa
- 4.3.2 Asia-Pacific
- 4.3.2.1 By Type
- 4.3.2.2 By Distribution Channel
- 4.3.2.3 By Country
- 4.3.2.3.1 Australia
- 4.3.2.3.2 China
- 4.3.2.3.3 India
- 4.3.2.3.4 Indonesia
- 4.3.2.3.5 Japan
- 4.3.2.3.6 Malaysia
- 4.3.2.3.7 South Korea
- 4.3.2.3.8 Rest Of Asia-Pacific
- 4.3.3 Europe
- 4.3.3.1 By Type
- 4.3.3.2 By Distribution Channel
- 4.3.3.3 By Country
- 4.3.3.3.1 France
- 4.3.3.3.2 Germany
- 4.3.3.3.3 Italy
- 4.3.3.3.4 Netherlands
- 4.3.3.3.5 Russia
- 4.3.3.3.6 Spain
- 4.3.3.3.7 United Kingdom
- 4.3.3.3.8 Rest Of Europe
- 4.3.4 Middle East
- 4.3.4.1 By Type
- 4.3.4.2 By Distribution Channel
- 4.3.4.3 By Country
- 4.3.4.3.1 Bahrain
- 4.3.4.3.2 Kuwait
- 4.3.4.3.3 Oman
- 4.3.4.3.4 Qatar
- 4.3.4.3.5 Saudi Arabia
- 4.3.4.3.6 United Arab Emirates
- 4.3.4.3.7 Rest Of Middle East
- 4.3.5 North America
- 4.3.5.1 By Type
- 4.3.5.2 By Distribution Channel
- 4.3.5.3 By Country
- 4.3.5.3.1 Canada
- 4.3.5.3.2 Mexico
- 4.3.5.3.3 United States
- 4.3.5.3.4 Rest Of North America
- 4.3.6 South America
- 4.3.6.1 By Type
- 4.3.6.2 By Distribution Channel
- 4.3.6.3 By Country
- 4.3.6.3.1 Argentina
- 4.3.6.3.2 Brazil
- 4.3.6.3.3 Rest Of South America
- 4.3.1 Africa
5 COMPETITIVE LANDSCAPE
- 5.1 Key Strategic Moves
- 5.2 Market Share Analysis
- 5.3 Company Landscape
- 5.4 Company Profiles
- 5.4.1 BRF S.A.
- 5.4.2 Cargill, Inc
- 5.4.3 COFCO Corporation
- 5.4.4 Conagra Brands Incorporated
- 5.4.5 Hormel Foods Corporation
- 5.4.6 Itoham Yonekyu Holdings, Inc.
- 5.4.7 JBS S.A.
- 5.4.8 Marfrig Global Foods SA
- 5.4.9 OSI Group
- 5.4.10 Sysco Corporation
- 5.4.11 The Kraft Heinz Company
- 5.4.12 Tyson Foods Inc.
- 5.4.13 Wen's Food Group Co.,Ltd
- 5.4.14 WH Group Limited
6 KEY STRATEGIC QUESTIONS FOR MEAT INDUSTRY CEOS
7 APPENDIX
- 7.1 Global Overview
- 7.1.1 Overview
- 7.1.2 Porter's Five Forces Framework
- 7.1.3 Global Value Chain Analysis
- 7.1.4 Market Dynamics (DROs)
- 7.2 Sources & References
- 7.3 List of Tables & Figures
- 7.4 Primary Insights
- 7.5 Data Pack
- 7.6 Glossary of Terms