|
|
市場調査レポート
商品コード
1535293
電動プーリの世界と米国の市場規模、シェア、予測、動向分析:出力、歯車材料、ハウジング材料、用途、エンドユーザー別-2031年までの予測Global and U.S. Motorized Pulleys Market Size, Share, Forecast, & Trends Analysis by Power Output, Gear Material, Housing Material, Application, End User - Forecast to 2031 |
||||||

|
|||||||
カスタマイズ可能
|
|||||||

| 電動プーリの世界と米国の市場規模、シェア、予測、動向分析:出力、歯車材料、ハウジング材料、用途、エンドユーザー別-2031年までの予測 |
|
出版日: 2024年08月14日
発行: Meticulous Research
ページ情報: 英文 96 Pages
納期: 即納可能
|

全表示
- 概要
- 図表
- 目次
米国の電動プーリー市場は、2024年から2031年までのCAGRが3.5%で、2031年までに2億4,940万米ドルに達すると予測されています。米国の電動プーリー市場の成長は、産業オートメーションやその他のインダストリー4.0技術の採用の増加、老朽化した資産の交換ニーズの高まり、マテリアルハンドリングソリューションに対する需要の高まりが原動力となっています。しかし、電動プーリーのコンパクトな設計による全体的な効率の低さが、この市場の成長を抑制しています。
さらに、eコマースと物流分野の成長とモーター&制御技術の進歩が、この市場の利害関係者に成長機会をもたらしています。さらに、従来のプーリーと比べて電動プーリーの投資要件が高いことが、市場の成長を制限する大きな課題となっています。
目次
第1章 イントロダクション
第2章 調査手法
第3章 エグゼクティブサマリー
- 概要
- 電動プーリの米国市場分析:出力別
- 電動プーリの米国市場分析:歯車材料別
- 電動プーリの米国市場分析:ハウジング材料別
- 電動プーリの米国市場分析:用途別
- 電動プーリの米国市場分析:エンドユーザー別
- 競合分析
第4章 市場洞察
- 概要
- 市場成長への影響要因
- 産業オートメーションやその他のインダストリー4.0技術の採用が電動プーリーの需要を促進
- 老朽資産の更新ニーズの高まりが市場成長を後押し
- マテリアルハンドリングソリューションに対する需要の高まりが電動プーリの採用を促進
- 電動プーリのコンパクト設計による全体的な効率の低さが市場の成長を抑制
- eコマースとロジスティクス分野の成長が市場拡大を加速する見込み
- モーターと制御技術の進歩が市場企業の成長機会を生む
- 従来のプーリに比べて電動プーリの投資要件が高いことが市場成長を制限する主要課題として残る見込み
- 技術動向
- 米国:マクロ経済・ミクロ経済分析
- バリューチェーン分析
第5章 電動プーリの米国市場:出力別評価
- 概要
- 5馬力まで
- 5馬力以上15馬力未満
- 15馬力以上50馬力未満
- 50馬力以上
第6章 電動プーリーの米国市場:歯車材料別評価
- 概要
- ポリマー
- スチール
- その他の歯車材料
第7章 電動プーリーの米国市場:ハウジング材料別評価
- 概要
- アルミニウム製ハウジング
- スチール製ハウジング
- その他のハウジング材料
第8章 電動プーリーの米国市場:用途別評価
- 概要
- ローラーコンベア
- ベルトコンベヤ
- ポジティブドライブベルトコンベア
- 摩擦ベルトコンベヤ
第9章 電動プーリーの米国市場評価:エンドユーザー別
- 概要
- 物流・倉庫
- 自動車メーカー
- 飲食品加工業界
- 消費財メーカー
- 鉱業・鉱物加工
- セメントメーカー
- 発電
- 鉄鋼業
- その他エンドユーザー
第10章 競合分析
- 概要
- 競合ベンチマーキング
- 競合ダッシュボード
- 業界リーダー
- 市場差別化要因
- バンガード
- 新興企業
- 主要企業による市場ランキング
第11章 企業プロファイル
- Rulmeca Holding S.p.A.
- Van der Graaf Inc.
- Interroll Holding AG
- Sparks Belting
- Mol Belting Systems, Inc.
- Shipp Belting Company
- Metso Corporation
- Tech-Roll, Inc.
- Jiangsu Winroller Technology Co., Ltd.
- HIMMEL Antriebstechnik GmbH & Co. KG
- Tianjin Seaparks Machinery-Electronics Co., Ltd
第12章 付録
LIST OF TABLES
- Table 1 Currency Conversion Rate (2019-2022)
- Table 2 U.S.: Value Added, by Sector, 2020-2023 (USD Billion)
- Table 3 U.S.: Gross output, by Sector, 2020-2023 (USD Billion)
- Table 4 U.S. Motorized Pulleys Market, by Power Output, 2022-2031 (USD Million)
- Table 5 U.S. Motorized Pulleys Market, by Gear Material, 2022-2031 (USD Million)
- Table 6 U.S. Motorized Pulleys Market, by Housing Material, 2022-2031 (USD Million)
- Table 7 U.S. Motorized Pulleys Market, by Application, 2022-2031 (USD Million)
- Table 8 U.S. Motorized Pulleys Market for Belt Conveyors, by Type, 2022-2031 (USD Million)
- Table 9 U.S. Motorized Pulleys Market, by End User, 2022-2031 (USD Million)
- Table 10 U.S. Mineral Industry Trends (USD Million)
- Table 11 Top Companies in the U.S. Motorized Pulleys Market
LIST OF FIGURES
- Figure 1 Market Ecosystem
- Figure 2 Key Stakeholders
- Figure 3 Research Process
- Figure 4 Key Secondary Sources
- Figure 5 Primary Research Techniques
- Figure 6 Key Executives Interviewed
- Figure 7 Breakdown of Primary Interviews (Supply-Side & Demand-Side)
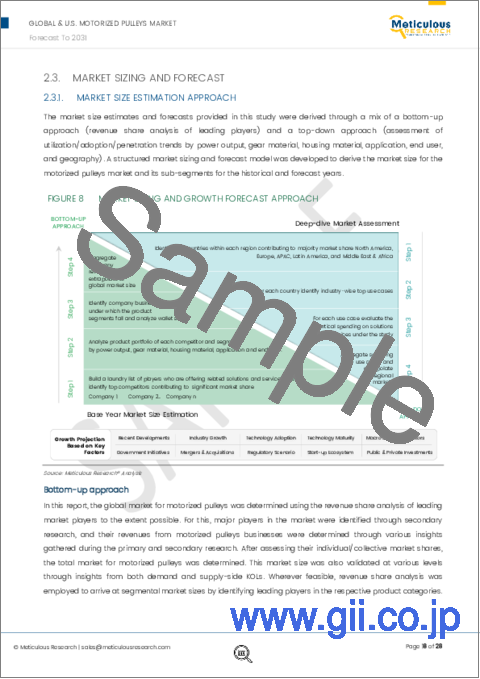
- Figure 8 Market Sizing and Growth Forecast Approach
- Figure 9 Key Insights
- Figure 10 U.S. Motorized Pulleys Market, by Power output, 2024 VS. 2031 (USD million)
- Figure 11 U.S. Motorized Pulleys Market, by Gear material, 2024 VS. 2031 (USD million)
- Figure 12 U.S. Motorized Pulleys Market, by Housing Material, 2024 VS. 2031 (USD million)
- Figure 13 U.S. Motorized Pulleys Market, by Application, 2024 VS. 2031 (USD million)
- Figure 14 U.S. Motorized Pulleys Market, by End User, 2024 VS. 2031 (USD million)
- Figure 15 Impact Analysis of Market Dynamics
- Figure 16 U.S. Motorized Pulleys Market: Value Chain Analysis
- Figure 17 U.S. Motorized Pulleys Market, by Power output, 2024 vs. 2031 (USD Million)
- Figure 18 U.S. Motorized Pulleys Market, by Gear material, 2024 vs. 2031 (USD Million)
- Figure 19 U.S. Motorized Pulleys Market, by Housing material, 2024 vs. 2031 (USD Million)
- Figure 20 U.S. Motorized Pulleys Market, by Application, 2024 vs. 2031 (USD Million)
- Figure 21 U.S. Motorized Pulleys Market, by End User, 2024 vs. 2031 (USD Million)
- Figure 22 Vendor Market Positioning Analysis (2021-2024)
- Figure 23 Competitive Dashboard: U.S. Motorized Pulleys Market
- Figure 24 SWOT Analysis: Rulmeca Holding S.p.A.
- Figure 25 SWOT Analysis: Van der Graaf Inc.
- Figure 26 Interroll Holding AG: Financial Overview (2023)
- Figure 27 SWOT Analysis: Interroll Holding AG
- Figure 28 Metso Corporation: Financial Overview (2023)
The research report titled, 'U.S. Motorized Pulleys Market by Power Output (Upto 5 hp, Others), Gear Material (Polymer, Steel, Others), Housing Material (Steel, Others), Application (Belt Conveyors, Roller Conveyors), End User (Logistics & Warehousing, Others)-Forecast to 2031', provides an in-depth analysis of U.S. motorized pulleys market emphasizing on the current market trends, market sizes, market shares, recent developments, and forecasts till 2031.
The U.S. motorized pulleys market is projected to reach $249.4 million by 2031, at a CAGR of 3.5% from 2024 to 2031. The growth of the U.S. motorized pulleys market is driven by the increasing adoption of industrial automation and other Industry 4.0 technologies, the rising need to replace aging assets, and the growing demand for material handling solutions. However, suboptimal overall efficiency due to motorized pulleys' compact designs restrains the growth of this market.
Additionally, the growth of the e-commerce and logistics sectors and advancements in motor & control technologies are generating growth opportunities for the stakeholders in this market. Furthermore, the higher investment requirements of motorized pulleys compared to traditional pulleys are a major challenge restricting market growth.
Based on power output, the U.S. motorized pulleys market is segmented into up to 5 hp, above 5 hp to 15 hp, 15 hp to 50 hp, and above 50 hp. In 2024, the up to 5 hp segment is expected to account for the largest share of 37.3% of the U.S. motorized pulleys market. This segment's large market share is attributed to the increasing adoption & advancements of conveyor systems for transporting lightweight materials, and rising demand for industrial automation.
However, the above 5 hp to 15 hp segment is expected to record the highest CAGR of 4.3% during the forecast period. This segment's growth is driven by factors such as the increasing adoption of baggage handling systems in airports and the rising need to reduce labor costs and enhance efficiency across various industries.
Based on gear material, the U.S. motorized pulleys market is segmented into polymer, steel, and other gear materials. In 2024, the polymer segment is expected to account for the largest share of 49.1% of the U.S. motorized pulleys market. This segment's large market share is primarily attributed to the increasing emphasis among companies on developing highly durable polymers specifically designed for industrial applications, as well as the advantages of using polymer gears in motorized pulleys, such as their lighter weight and reduced noise levels compared to metal gears.
However, the steel segment is expected to record the highest CAGR during the forecast period. This segment's growth is primarily driven by factors such as the high durability of steel gears, which withstand the continuous wear & tear from moving large quantities of materials.
Based on housing material, the U.S. motorized pulleys market is segmented into aluminum housing, steel housing, and other housing materials. In 2024, the aluminum housing segment is expected to account for the largest share of the U.S. motorized pulleys market. This segment's large market share is attributed to the benefits offered by aluminum, such as affordability and corrosion resistance, and the growing preference for aluminum in environments prone to moisture or chemical exposure.
On the other hand, the steel housing segment is expected to record the highest CAGR during the forecast period. This segment's expansion is driven by the widespread preference for heavy-duty motorized pulleys due to their strength & durability across several industries.
Based on application, the U.S. motorized pulleys market is segmented into belt conveyors and roller conveyors. In 2024, the roller conveyors segment is expected to account for a larger share of 58.3% of the U.S. motorized pulleys market. This segment's large market share is credited to the growing advancement in conveyor systems and permeating use cases of roller conveyors across various industries.
However, the belt conveyors segment is anticipated to record the highest CAGR of 4.9% during the forecast period. The furtherance in automation and increasing adoption of automation technologies are some of the factors responsible for the belt conveyors segment's growth.
Based on end user, the U.S. motorized pulleys market is segmented into mining & mineral processing, cement manufacturers, steel industry, power generation, automotive manufacturers, consumer goods manufacturers, logistics & warehousing, food & beverage processing industry, and other end users. In 2024, the logistics & warehousing segment is expected to account for the largest share of 23.5% of the U.S. motorized pulleys market. This segment's large market share is attributed to the increased integration of conveyor systems in logistics and warehouse operation and benefits such as increased productivity, improved safety, and better space utilization of conveyor systems in the logistics industry.
On the other hand, the automotive manufacturers segment is expected to register the highest CAGR of 4.9% during the forecast period. This segment's growth is primarily driven by factors such as the focus of manufacturers on lowering reliance on human labor, especially for repetitive or dangerous tasks and tight production deadlines.
Key Players:
Some of the key players operating in the U.S. motorized pulleys market are Rulmeca Holding S.p.A. (Italy), Van der Graaf Inc. (Canada), Interroll Holding AG (Switzerland), Sparks Belting (U.S.), Mol Belting Systems, Inc. (U.S.), Shipp Belting Company (U.S.), Metso Corporation (Finland), Tech-Roll, Inc. (U.S.), HIMMEL Antriebstechnik GmbH & Co. KG (Germany), Jiangsu Winroller Technology Co., Ltd. (China) and Tianjin Seaparks Machinery-Electronics Co., Ltd (China).
Key questions answered in the report-
- Which are the high-growth market segments based on power output, gear materials, housing materials, application, and end user?
- What was the historical market for U.S. motorized pulleys?
- What are the market forecasts and estimates for the period 2024-2031?
- What are the major drivers, restraints, and opportunities in U.S. motorized pulleys market?
- Who are the major players, and what shares do they hold in the U.S. motorized pulleys market?
- How is the competitive landscape in the U.S. motorized pulleys market?
- What are the recent developments in U.S. motorized pulleys market?
- Who are the local emerging players in the U.S. motorized pulleys market, and how do they compete with the other players?
Scope of the report:
U.S. Motorized Pulleys Market Assessment-by Power Output
- Up to 5 hp
- Above 5 hp to 15 hp
- 16 hp to 50 hp
- Above 50 hp
U.S. Motorized Pulleys Market Assessment-by Gear Materials
- Polymer
- Steel
- Other Gear Materials
U.S. Motorized Pulleys Market Assessment-by Housing Materials
- Aluminum Housing
- Steel Housing
- Other Housing Materials
U.S. Motorized Pulleys Market Assessment-by Application
- Belt Conveyors
- Friction Belt Conveyors
- Positive Drive Belt Conveyors
- Roller Conveyors
U.S. Motorized Pulleys Market Assessment-by End User
- Mining & Mineral Processing
- Cement Manufacturers
- Steel Industry
- Power Generation
- Automotive Manufacturers
- Consumer Goods Manufacturers
- Logistics & Warehousing
- Food & Beverage Processing Industry
- Other End Users
TABLE OF CONTENTS
1. Introduction
- 1.1. Market Definition & Scope
- 1.2. Currency & Limitations
- 1.2.1. Currency
- 1.2.2. Limitations
2. Research Methodology
- 2.1. Research Approach
- 2.2. Process of Data Collection and Validation
- 2.2.1. Secondary Research
- 2.2.2. Primary Research/Interviews with Key Opinion Leaders from the Industry
- 2.3. Market Sizing and Forecast
- 2.3.1. Market Size Estimation Approach
- 2.3.2. Growth Forecast
- 2.4. Assumptions for the Study
3. Executive Summary
- 3.1. Overview
- 3.2. U.S. Motorized Pulleys Market Analysis, by Power Output
- 3.3. U.S. Motorized Pulleys Market Analysis, by Gear Material
- 3.4. U.S. Motorized Pulleys Market Analysis, by Housing Material
- 3.5. U.S. Motorized Pulleys Market Analysis, by Application
- 3.6. U.S. Motorized Pulleys Market Analysis, by End User
- 3.7. Competition Analysis
4. Market Insights
- 4.1. Overview
- 4.2. Factors Affecting Market Growth
- 4.2.1. Increasing Adoption of Industrial Automation and Other Industry 4.0 Technologies Driving the Demand for Motorized Pulleys
- 4.2.2. Rising Need to Replace Aging Assets Boosting Market Growth
- 4.2.3. Growing Demand for Material Handling Solutions Driving the Adoption of Motorized Pulleys
- 4.2.4. Suboptimal Overall Efficiency Due to Motorized Pulleys' Compact Designs Restraining Market Growth
- 4.2.5. Growth of the E-commerce and Logistics Sectors Expected to Accelerate Market Expansion
- 4.2.6. Advancements in Motor and Control Technologies Generating Growth Opportunities for Market Players
- 4.2.7. Higher Investment Requirements of Motorized Pulleys Compared to Traditional Pulleys Expected to Remain a Major Challenge Restricting Market Growth
- 4.3. Technology Trends
- 4.4. U.S.: Macroeconomic & Microeconomic Analysis
- 4.5. Value Chain Analysis
5. U.S. Motorized Pulleys Market Assessment-by Power Output
- 5.1. Overview
- 5.2. Upto 5 hp
- 5.3. Above 5 hp to 15 hp
- 5.4. Above 50 hp
- 5.5. 15 hp to 50 hp
6. U.S. Motorized Pulleys Market Assessment-by Gear Material
- 6.1. Overview
- 6.2. Polymer
- 6.3. Steel
- 6.4. Other Gear Materials
7. U.S. Motorized Pulleys Market Assessment-by Housing Material
- 7.1. Overview
- 7.2. Aluminum Housing
- 7.3. Steel Housing
- 7.4. Other Housing Material
8. U.S. Motorized Pulleys Market Assessment-by Application
- 8.1. Overview
- 8.2. Roller Conveyors
- 8.3. Belt Conveyors
- 8.3.1. Positive Drive Belt Conveyors
- 8.3.2. Friction Belt Conveyors
9. U.S. Motorized Pulleys Market Assessment-by End User
- 9.1. Overview
- 9.2. Logistics & Warehousing
- 9.3. Automotive Manufacturers
- 9.4. Food & Beverage Processing Industry
- 9.5. Consumer Goods Manufacturers
- 9.6. Mining & Mineral Processing
- 9.7. Cement Manufacturers
- 9.8. Power Generation
- 9.9. Steel Industry
- 9.10. Other End Users
10. Competition Analysis
- 10.1. Overview
- 10.2. Competitive Benchmarking
- 10.3. Competitive Dashboard
- 10.3.1. Industry Leaders
- 10.3.2. Market Differentiators
- 10.3.3. Vanguards
- 10.3.4. Emerging Companies
- 10.4. Market Ranking by The Key Players
11. Company Profiles
- 11.1. Rulmeca Holding S.p.A.
- 11.2. Van der Graaf Inc.
- 11.3. Interroll Holding AG
- 11.4. Sparks Belting
- 11.5. Mol Belting Systems, Inc.
- 11.6. Shipp Belting Company
- 11.7. Metso Corporation
- 11.8. Tech-Roll, Inc.
- 11.9. Jiangsu Winroller Technology Co., Ltd.
- 11.10. HIMMEL Antriebstechnik GmbH & Co. KG
- 11.11. Tianjin Seaparks Machinery-Electronics Co., Ltd
12. Appendix
- 12.1. Related Reports
