バイオ刺激剤の世界市場:有効成分別、形態別、施用方法別、作物タイプ別、地域別 - 2031年までの予測
Biostimulants Market by Active Ingredient (Humic Substances, Seaweed Extracts, Amino Acids, Minerals & Vitamins), Crop Type, Mode of Application (Foliar Treatment, Soil Treatment), Form, and Region - Global Forecast To 2031- 発行日
- ページ情報
- 英文 369 Pages
- 納期
-
即納可能
営業時間内にお支払方法などの確認が取れ次第、Eメールにて納品となります。営業時間: 9:00am - 6:00pm (土日祝除く)。

- 商品コード
- 2082823
- カスタマイズ可能 お客様のご希望に応じて、既存データの加工や未掲載情報(例:国別セグメント)の追加などの対応が可能です。詳細はお問い合わせください。
- 翻訳ツール提供対象 PDF対応AI翻訳ツールの無料貸し出しサービスのご利用が可能です
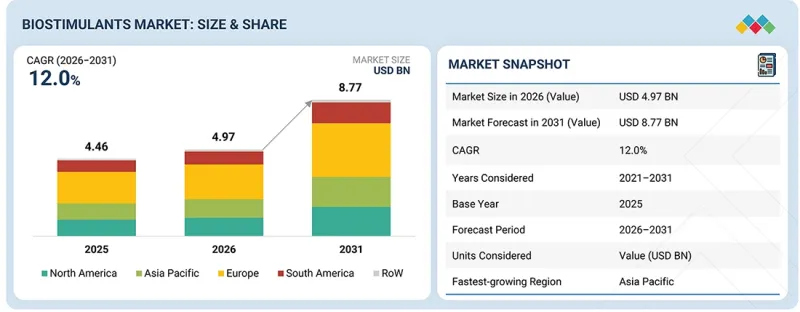
世界のバイオ刺激剤の市場規模は、2026年に49億7,000万米ドルと推定されており、2031年までに87億7,000万米ドルに達すると見込まれ、2026年から2031年にかけてCAGR12.0%で成長する見込みです。
消費者が化学物質を使用せず、持続可能な方法で生産された食品を求める傾向が強まっていることから、有機農業への需要の高まりが、バイオ刺激剤市場の重要な促進要因となっています。
| 調査範囲 | |
|---|---|
| 調査対象期間 | 2026年~2031年 |
| 基準年 | 2025年 |
| 予測期間 | 2026年~2031年 |
| 算定単位 | 金額(米ドル)および数量(千トン) |
| セグメント | 有効成分別、形態別、施用方法別、作物タイプ別、地域別 |
| 対象地域 | 北米、欧州、アジア太平洋、南米、およびその他の地域 |
バイオ刺激剤は、合成肥料や農薬に頼ることなく、作物の収量、品質、および環境ストレスに対する耐性を高めたいと考える農家の間で人気が高まっています。栄養素の吸収を改善し、土壌の健康を促進し、植物の成長を促進するその能力は、有機農業の実践とよく合致しており、その採用をさらに加速させています。さらに、持続可能な農業を奨励する政府の支援政策も、さまざまな作物におけるバイオ刺激剤の使用拡大に寄与しています。
「施用方法別に見ると、バイオ刺激剤市場において葉面散布セグメントが最大の市場シェアを占めています。」
葉面散布は、栄養素やバイオ刺激剤の化合物を植物の葉に直接届けることで、迅速な吸収と即効性を確保できるため、バイオ刺激剤市場において最も高い市場シェアを占めています。この方法は、果物、野菜、観賞用植物などの高付加価値作物の生育促進、栄養利用効率の向上、およびストレス耐性の強化に特に有効です。他の農薬との相性が良く、散布システムによる施用が容易であることから、農家の間で好まれる選択肢となっています。
「穀物・穀類セグメントは、予測期間中に著しい成長率を示すと見込まれています。」
穀物・穀粒は、大規模農業における作物の収量、品質、および非生物的ストレスに対する耐性を高める必要性の高まりに後押しされ、バイオ刺激剤市場において大きな市場シェアを占めています。小麦、米、トウモロコシ、大麦などの主食作物は世界の食糧安全保障に不可欠であるため、農家は栄養素の吸収、根の発達、およびストレス耐性を改善するために、バイオ刺激剤の採用をますます進めています。干ばつや塩害といった過酷な環境条件下でも生産性を向上させるバイオ刺激剤の能力は、穀物栽培において特に大きな価値をもたらします。さらに、持続可能な農業実践への需要の高まりや化学肥料の使用削減の必要性が、このセグメントにおけるバイオ刺激剤の採用をさらに後押ししています。
「南米は、バイオ刺激剤市場において著しい成長率を示すと予想されています。」
南米は、同地域の農業部門の拡大と持続可能な農業手法の普及に後押しされ、バイオ刺激剤市場において著しい成長率を示すと予想されています。大豆、トウモロコシ、サトウキビの主要生産国であるブラジルやアルゼンチンなどの国々では、作物の収量、品質、および非生物的ストレスに対する耐性を高めるために、バイオ刺激剤の使用がますます増加しています。さらに、世界の食糧需要の高まりに対応するため、土壌の健康状態と養分利用効率の向上に重点が置かれていることも、バイオ刺激剤の導入を後押ししています。有機農業や持続可能な農業資材を促進する政府の好意的な取り組みも、南米におけるバイオ刺激剤市場の急速な成長に寄与しています。
市場における主要企業には、UPL(インド)、FMC Corporation (米国)、Corteva(米国)、Syngenta Group(スイス)、Sumitomo Chemical(日本)、Nufarm(オーストラリア)、Novonesis Group(デンマーク)、BASF SE(ドイツ)、Bayer AG(ドイツ)、PI Industries(インド)、T. Stanes and Company Limited(インド)、Gowan Company(米国)、J.M. Huber Corporation(米国)、Haifa Negev Technologies LTD(イスラエル)、Koppert(オランダ)などが挙げられます。
その他の主要企業には、Acadian Plant Health(カナダ)、Qingdao Seawin Biotech Group(中国)、Sustainable Agro Solutions, S.A.U(スペイン)、SEIPASA, S.A.(スペイン)、OMEX(英国)、AlgaEnergy(スペイン)、LawrieCo(オーストラリア)、Aminocore(ドイツ)、Kelpak(南アフリカ)、およびCascadia Seaweed(カナダ)などが挙げられます。
調査範囲:
本調査レポートでは、バイオ刺激剤市場を有効成分(腐植物質、海藻抽出物、アミノ酸、ミネラル・ビタミン、微生物製剤)、施用方法(葉面散布、土壌施用、種子処理)、作物の種類(穀物、果物・野菜、油糧種子・豆類)、形態(液体、乾燥)、および地域(北米、欧州、アジア太平洋、南米、世界のその他の地域)ごとに分類しています。当レポートの調査範囲には、バイオ刺激剤市場の成長に影響を与える主要な要因(促進要因、制約要因、課題、機会など)に関する詳細情報が含まれています。主要な業界プレイヤーについて詳細な分析を行い、各社の事業概要、サービス、主要戦略、契約、提携、合意、新サービスの立ち上げ、合併・買収、およびバイオ刺激剤市場における最近の動向に関する洞察を提供しています。当レポートでは、バイオ刺激剤市場のエコシステムにおいて台頭しつつあるスタートアップ企業の競合分析も取り上げています。さらに、技術分析、エコシステムおよび市場のマッピング、特許、規制状況など、業界特有の動向についても本調査で網羅しています。
当レポートを購入すべき理由:
当レポートは、バイオ刺激剤市場全体および各サブセグメントの売上高に関する最も正確な推計値に関する情報を提供することで、この市場の市場リーダーや新規参入企業を支援します。当レポートは、利害関係者が競合情勢を理解し、自社のビジネスをより良い位置に据え、適切な市場参入戦略を策定するためのさらなる洞察を得るのに役立ちます。また、当レポートは利害関係者が市場の動向を把握するのを支援し、主要な市場促進要因、抑制要因、課題、および機会に関する情報を提供します。
当レポートでは、以下の点に関する洞察を提供しています:
- バイオ刺激剤市場の成長に影響を与える主要な促進要因(持続可能な農業へのニーズの高まり)、制約要因(低品質なバイオ刺激剤製品の市場投入)、機会(技術革新)、および課題(世界のバイオ刺激剤規制枠組みにおける不確実性)の分析。
- 新製品の発売/イノベーション:バイオ刺激剤市場における研究開発活動および新製品の発売に関する詳細な洞察。
- 市場開発:収益性の高い市場に関する包括的な情報--当レポートでは、さまざまな地域にわたるバイオ刺激剤市場を分析しています。
- 市場の多様化:バイオ刺激剤市場における新たなサービス、未開拓の地域、最近の動向、および投資に関する網羅的な情報。
- 競合評価:バイオ刺激剤市場におけるUPL(インド)、FMC Corporation(米国)、Corteva(米国)、Syngenta Group(スイス)、住友化学(日本)、Nufarm(オーストラリア)などの主要企業の市場シェア、成長戦略、製品ラインナップ、ブランド/製品比較、および製品展開状況に関する詳細な評価。
よくあるご質問
目次
第1章 イントロダクション
第2章 エグゼクティブサマリー
第3章 重要考察
第4章 市場概要
- 市場力学
- 促進要因
- 抑制要因
- 機会
- 課題
- アンメットニーズと未開拓分野
- 相互接続された市場と異業種間の機会
- 新たなビジネスモデルとエコシステムの変化
- ティア1/2/3企業による戦略的な動き
第5章 業界動向
- ポーターの5つの競争要因分析
- マクロ経済指標
- バリューチェーン分析
- エコシステム分析
- 価格分析
- 貿易分析
- 2026年の主要な会議およびイベント
- 投資と資金調達のシナリオ
- 顧客ビジネスに影響を与える動向/混乱
- 事例研究分析
- 2026年米国関税の影響- バイオ刺激剤市場
第6章 技術進歩、AIによる影響、特許、イノベーション、そして将来の応用
- 主要な新興技術
- 補完的な技術
- 隣接技術
- 技術/製品ロードマップ
- 特許分析
- 将来の応用
- 生成型AIがバイオ刺激剤市場に与える影響
- 成功事例と実世界での応用例
第7章 規制状況と持続可能性への取り組み
- 地域規制および遵守事項
- 業界標準
- 持続可能性への取り組み
- 規制政策が持続可能性イニシアチブに与える影響
- 認証、ラベル表示、環境基準
第8章 顧客情勢と購買行動
- 意思決定プロセス
- 購買プロセスに関わる主要な利害関係者とその評価基準
- 導入障壁と内部課題
- 様々なエンドユーザー/エンドユース産業におけるアンメットニーズ
- 市場収益性
第9章 バイオ刺激剤市場(有効成分別)
- 腐植物質
- 海藻エキス
- アミノ酸
- 微生物別改良
- ミネラルとビタミン
- その他
第10章 バイオ刺激剤市場(形態別)
- 液体
- ドライ
第11章 バイオ刺激剤市場(施用方法別)
- 種子処理
- 土壌処理
- 葉面散布
第12章 バイオ刺激剤市場(作物タイプ別)
- 穀物
- 油糧種子と豆類
- 果物と野菜
- 花と装飾品
- その他
第13章 バイオ刺激剤市場(地域別)
- 北米
- 米国
- カナダ
- メキシコ
- 欧州
- スペイン
- イタリア
- フランス
- ドイツ
- 英国
- その他
- アジア太平洋
- 中国
- 日本
- インド
- オーストラリア
- その他
- 南米
- ブラジル
- アルゼンチン
- その他南米
- その他の地域
- アフリカ
- 中東
第14章 競合情勢
- 概要
- 主要企業の戦略/強み
- 収益分析
- 市場シェア分析、2025年
- 企業評価マトリックス:主要企業、2025年
- 企業評価マトリックス:スタートアップ/中小企業、2025年
- 企業評価と財務指標
- ブランド/製品/サービス分析
- 競合シナリオと動向
第15章 企業プロファイル
- 主要企業
- UPL
- FMC CORPORATION
- CORTEVA
- SYNGENTA GROUP
- SUMITOMO CHEMICAL CO., LTD
- NUFARM
- NOVONESIS GROUP
- BASF SE
- BAAGR AG
- PI INDUSTRIES
- T.STANES AND COMPANY LIMITED
- J.M. HUBER CORPORATION
- HAIFA NEGEV TECHNOLOGIES LTD
- GOWAN COMPANY
- KOPPERT
- スタートアップ/中小企業
- ACADIAN SEAPLANTS LIMITED
- QINGDAO SEAWIN BIOTECH GROUP CO., LTD.
- OMEX
- SEIPASA, S.A.
- SUSTAINABLE AGRO SOLUTIONS, S.A.U.
- ALGAENERGY
- LAWRIECO
- AMINOCORE
- KELPAK
- CASCADIA SEAWEED
第16章 調査手法
第17章 隣接市場および関連市場
第18章 付録
- 発行日
- 発行
- MarketsandMarkets
- ページ情報
- 英文 369 Pages
- 納期
- 即納可能


