|
|
市場調査レポート
商品コード
1724749
軍用車両電化の世界市場:プラットフォーム別、システム別、技術別、動作方式別、電圧タイプ別、地域別 - 予測(~2030年)Military Vehicle Electrification Market by Platform (Combat Vehicles, Support Vehicles, Unmanned Armored Vehicles), System, Technology (Hybrid, Fully Electric), Mode of operation, Voltage Type and Region - Global Forecast to 2030 |
||||||

|
|||||||
カスタマイズ可能
|
|||||||

| 軍用車両電化の世界市場:プラットフォーム別、システム別、技術別、動作方式別、電圧タイプ別、地域別 - 予測(~2030年) |
|
出版日: 2025年05月06日
発行: MarketsandMarkets
ページ情報: 英文 273 Pages
納期: 即納可能
|

全表示
- 概要
- 図表
- 目次
世界の軍用車両電化の市場規模は、2025年に推定34億7,000万米ドルであり、2030年までに68億2,000万米ドルに達すると予測され、2025年~2030年にCAGRで14.5%の成長が見込まれます。
市場は、技術の進歩、戦略的必須要件、持続可能性の重視によって牽引されています。ここ数年、運用効率を高め、従来の燃料源への依存を減らし、環境問題に対処するため、軍用車両に電気推進システムを統合する方向にシフトしています。高エネルギー密度ソリューションの開発や安全機能の向上など、バッテリー技術の進歩は、電動軍用車両の航続距離と耐久性を伸ばす上で極めて重要です。
| 調査範囲 | |
|---|---|
| 調査対象年 | 2020年~2030年 |
| 基準年 | 2024年 |
| 予測期間 | 2025年~2030年 |
| 単位 | 10億米ドル |
| セグメント | プラットフォーム、システム、動作方式、電圧タイプ、地域 |
| 対象地域 | 北米、欧州、アジア太平洋、その他の地域 |
システム別では、発電システムセグメントが市場で第2位を占めています。発電システムセグメントは、技術的進歩、運用上の利点、戦略的必須要件などの複合的要因により、軍用車両電化市場で大きく成長する見込みです。発電システムを軍用トラックに統合することで、全体としてより多用途で効率的なものとなります。このシステムには、精巧な発電機と自動車用エネルギー貯蔵システムが含まれ、車両が車内で発電し電気を貯蔵することを可能にします。これらのシステムは、軍のミッションクリティカルな機械やシステムに対する応答性と電力供給の柔軟性を高め、軍用トラックの運用能力を向上させます。
支援車別では、指揮統制(C2)車両セグメントが軍用車両電化市場でもっとも速く成長すると予測されます。C2車両は、通信、調整、意思決定を支援する機動指揮センターとして、現代の軍事作戦の重要な実現要因となっています。これらの車両の電化には、騒音の低減、ステルス性の向上、機動性の向上といった固有の利点があり、これらは多様な作戦環境での効率的な指揮統制に不可欠です。電気C2車両は、より優れた作戦の有効性と応答性をサポートします。電気駆動システムは、迅速な加速、減速、機敏な操縦を容易にし、戦場内での迅速な再展開と再配置を可能にします。また、電気ドライブトレインはメンテナンスの必要性が低いため、C2車両が必要に応じて展開され、車両の可用性が高まります。
欧州は軍用車両電化市場でもっとも急成長しています。
欧州が軍用車両電化市場でもっとも速く成長すると予測されます。能力を近代化する必要性から、この地域の国々は、ハイブリッド電気駆動、燃料電池、バッテリー、完全電気自動車などの軍用車両電化技術の採用に多額の投資を余儀なくされています。Leonardo S.p.A.(イタリア)とBAE Systems(英国)は、この地域の軍用車両電化市場で活動する主要企業の1つです。
当レポートでは、世界の軍用車両電化市場について調査分析し、主な促進要因と抑制要因、競合情勢、将来の動向などの情報を提供しています。
目次
第1章 イントロダクション
第2章 調査手法
第3章 エグゼクティブサマリー
第4章 主な調査結果
- 軍用車両電化市場における魅力的な成長機会
- 軍用車両電化市場:電圧別
- 軍用車両電化市場:動作方式別
- 軍用車両電化市場:プラットフォーム別
- 軍用車両電化市場:地域別
第5章 市場の概要
- イントロダクション
- 市場力学
- 促進要因
- 抑制要因
- 機会
- 課題
- エコシステム分析
- 著名企業
- 民間企業と中小企業
- エンドユーザー
- 顧客ビジネスに影響を与える動向と混乱
- 技術分析
- 主要技術
- 補完技術
- 隣接技術
- バリューチェーン分析
- ケーススタディ分析
- 主力戦車の電化
- 偵察車両の電化
- ロジスティクス車両の電化
- 無人地上車両の電化
- 運用データ
- 価格分析
- 平均販売価格:バッテリー別
- 平均販売価格:地域別
- 貿易分析
- 輸入シナリオ(HSコード8506)
- 輸出シナリオ(HSコード8506)
- 主なステークホルダーと購入基準
- 主な会議とイベント(2025年)
- 規制情勢
- テクノロジーロードマップ
- 部品表
- 総所有コスト
- ビジネスモデル
- 投資と資金調達のシナリオ
- マクロ経済の見通し
- イントロダクション
- 北米
- 欧州
- アジア太平洋
- 中東
- ラテンアメリカ
- アフリカ
第6章 産業動向
- イントロダクション
- 技術動向
- バッテリーのソースとタイプ
- 先進統合通信ネットワークシステム
- 軽量材料、設計
- V2G統合
- 先進の熱管理ソリューション
- サイレントモビリティ、シグネチャー低減技術
- 水素燃料電池
- メガトレンドの影響
- 軍用自動運転車
- バッテリーと水素技術を支援する政策
- サプライチェーン分析
- イノベーションと特許登録
- AIの影響
- イントロダクション
- 防衛産業に対するAIの影響
- 主要国による軍事へのAIの採用
- 軍用車両電化市場におけるAIの影響
第7章 2025年の米国関税の影響
- イントロダクション
- 主な関税率
- 価格の影響の分析
- 国/地域に対する影響
- 米国
- 欧州
- アジア太平洋
- エンドユーザーに対する影響
第8章 軍用車両電化市場:プラットフォーム別
- イントロダクション
- 戦車
- 支援車
- 無人装甲車
第9章 軍用車両電化市場:動作方式別
- イントロダクション
- 有人車両
- 自律型/半自律型
第10章 軍用車両電化市場:システム別
- イントロダクション
- 発電システム
- 冷却システム
- エネルギー貯蔵システム
- トラクションドライブシステム
- 電力変換システム
- トランスミッションシステム
第11章 軍用車両電化市場:技術別
- イントロダクション
- ハイブリッド
- 完全電気
第12章 軍用車両電化市場:電圧別
- イントロダクション
- 低電圧(50V未満)
- 中電圧(50~600V)
- 高電圧(600V超)
第13章 軍用車両電化市場:地域別
- イントロダクション
- 北米
- PESTLE分析
- 米国
- カナダ
- 欧州
- PESTLE分析
- 英国
- フランス
- ドイツ
- イタリア
- その他の欧州
- アジア太平洋
- PESTLE分析
- インド
- 日本
- オーストラリア
- 韓国
- 中東
- PESTLE分析
- GCC
- その他の中東
- その他の地域
- ラテンアメリカ
- ブラジル
- メキシコ
- アフリカ
第14章 競合情勢
- イントロダクション
- 主要企業が採用した戦略
- 市場シェア分析(2024年)
- 収益分析(2021年~2024年)
- 企業の評価マトリクス(2024年)
- スタートアップ/中小企業の評価マトリクス(2024年)
- 企業の評価と財務指標
- ブランド/製品の比較
第15章 企業プロファイル
- 主要企業
- OSHKOSH CORPORATION
- GM DEFENSE, LLC
- GENERAL DYNAMICS CORPORATION
- BAE SYSTEMS
- LEONARDO S.P.A.
- TEXTRON INC.
- ST ENGINEERING
- QINETIQ
- POLARIS INDUSTRIES INC.
- ASELSAN A.S.
- OTOKAR AUTOMOTIVE AND DEFENSE INDUSTRY INC.
- RHEINMETALL AG
- THALES
- KNDS N.V.
- FFG FLENSBURGER FAHRZEUGBAU GESELLSCHAFT MBH
- その他の企業
- ARQUUS
- EPSILOR ELECTRIC FUEL LTD.
- UKROBORONPROM
- MILREM ROBOTICS
- AM GENERAL
- HIGHLAND SYSTEMS
- ALKE
- MEGA ENGINEERING VEHICLES INC.
- FNSS
第16章 付録
List of Tables
- TABLE 1 INCLUSIONS AND EXCLUSIONS
- TABLE 2 USD EXCHANGE RATES, 2021-2024
- TABLE 3 PRIMARY DATA
- TABLE 4 ROLE OF COMPANIES IN ECOSYSTEM
- TABLE 5 MILITARY VEHICLE ELECTRIFICATION MARKET, BY PLATFORM, 2021-2024 (UNITS)
- TABLE 6 MILITARY VEHICLE ELECTRIFICATION MARKET, BY PLATFORM, 2025-2030 (UNITS)
- TABLE 7 AVERAGE SELLING PRICE OF MILITARY VEHICLE ELECTRIFICATION, BY BATTERY, 2024 (USD THOUSAND)
- TABLE 8 AVERAGE SELLING PRICE OF BATTERIES, BY REGION, 2024 (USD THOUSAND)
- TABLE 9 IMPORT DATA FOR HS CODE 8506-COMPLIANT PRODUCTS, BY COUNTRY, 2021-2024 (USD THOUSAND)
- TABLE 10 EXPORT DATA FOR HS CODE 8506-COMPLIANT PRODUCTS, BY COUNTRY, 2021-2024 (USD THOUSAND)
- TABLE 11 INFLUENCE OF STAKEHOLDERS ON BUYING PROCESS, BY PLATFORM (%)
- TABLE 12 KEY BUYING CRITERIA, BY PLATFORM
- TABLE 13 KEY CONFERENCES AND EVENTS, 2025
- TABLE 14 NORTH AMERICA: REGULATORY BODIES, GOVERNMENT AGENCIES, AND OTHER ORGANIZATIONS
- TABLE 15 EUROPE: REGULATORY BODIES, GOVERNMENT AGENCIES, AND OTHER ORGANIZATIONS
- TABLE 16 ASIA PACIFIC: REGULATORY BODIES, GOVERNMENT AGENCIES, AND OTHER ORGANIZATIONS
- TABLE 17 MIDDLE EAST: REGULATORY BODIES, GOVERNMENT AGENCIES, AND OTHER ORGANIZATIONS
- TABLE 18 REST OF THE WORLD: REGULATORY BODIES, GOVERNMENT AGENCIES, AND OTHER ORGANIZATIONS
- TABLE 19 BILL OF MATERIALS FOR MILITARY VEHICLE ELECTRIFICATION
- TABLE 20 TOTAL COST OF OWNERSHIP FOR MILITARY VEHICLE ELECTRIFICATION
- TABLE 21 BUSINESS MODELS FOR MILITARY VEHICLE ELECTRIFICATION
- TABLE 22 COMPARISON BETWEEN BATTERIES
- TABLE 23 INNOVATIONS AND PATENT REGISTRATIONS, 2014-2023
- TABLE 24 US ADJUSTED RECIPROCAL TARIFF RATES
- TABLE 25 KEY PRODUCT-RELATED TARIFF EFFECTIVE FOR MILITARY VEHICLE ELECTRIFICATION
- TABLE 26 EXPECTED CHANGE IN PRICES AND LIKELY IMPACT ON END USERS DUE TO TARIFF IMPACT
- TABLE 27 MILITARY VEHICLE ELECTRIFICATION MARKET, BY PLATFORM, 2021-2024 (USD MILLION)
- TABLE 28 MILITARY VEHICLE ELECTRIFICATION MARKET, BY PLATFORM, 2025-2030 (USD MILLION)
- TABLE 29 MILITARY VEHICLE ELECTRIFICATION MARKET, BY COMBAT VEHICLES, 2021-2024 (USD MILLION)
- TABLE 30 MILITARY VEHICLE ELECTRIFICATION MARKET, BY COMBAT VEHICLES, 2025-2030 (USD MILLION)
- TABLE 31 MILITARY VEHICLE ELECTRIFICATION MARKET, BY SUPPORT VEHICLES, 2021-2024 (USD MILLION)
- TABLE 32 MILITARY VEHICLE ELECTRIFICATION MARKET, BY SUPPORT VEHICLES, 2025-2030 (USD MILLION)
- TABLE 33 MILITARY VEHICLE ELECTRIFICATION MARKET, BY SUPPLY TRUCKS, 2021-2024 (USD MILLION)
- TABLE 34 MILITARY VEHICLE ELECTRIFICATION MARKET, BY SUPPLY TRUCKS, 2025-2030 (USD MILLION)
- TABLE 35 MILITARY VEHICLE ELECTRIFICATION MARKET, BY MODE OF OPERATION, 2021-2024 (USD MILLION)
- TABLE 36 MILITARY VEHICLE ELECTRIFICATION MARKET, BY MODE OF OPERATION, 2025-2030 (USD MILLION)
- TABLE 37 MILITARY VEHICLE ELECTRIFICATION MARKET, BY SYSTEM, 2021-2024 (USD MILLION)
- TABLE 38 MILITARY VEHICLE ELECTRIFICATION MARKET, BY SYSTEM, 2025-2030 (USD MILLION)
- TABLE 39 MILITARY VEHICLE ELECTRIFICATION MARKET, BY ENERGY STORAGE SYSTEMS, 2021-2024 (USD MILLION)
- TABLE 40 MILITARY VEHICLE ELECTRIFICATION MARKET, BY ENERGY STORAGE SYSTEMS, 2025-2030 (USD MILLION)
- TABLE 41 MILITARY VEHICLE ELECTRIFICATION MARKET, BY BATTERIES, 2021-2024 (USD MILLION)
- TABLE 42 MILITARY VEHICLE ELECTRIFICATION MARKET, BY BATTERIES, 2025-2030 (USD MILLION)
- TABLE 43 MILITARY VEHICLE ELECTRIFICATION MARKET, BY TECHNOLOGY, 2021-2024 (USD MILLION)
- TABLE 44 MILITARY VEHICLE ELECTRIFICATION MARKET, BY TECHNOLOGY, 2025-2030 (USD MILLION)
- TABLE 45 MILITARY VEHICLE ELECTRIFICATION MARKET, BY VOLTAGE, 2021-2024 (USD MILLION)
- TABLE 46 MILITARY VEHICLE ELECTRIFICATION MARKET, BY VOLTAGE, 2025-2030 (USD MILLION)
- TABLE 47 MILITARY VEHICLE ELECTRIFICATION MARKET, BY REGION, 2021-2024 (USD MILLION)
- TABLE 48 MILITARY VEHICLE ELECTRIFICATION MARKET, BY REGION, 2025-2030 (USD MILLION)
- TABLE 49 NORTH AMERICA: MILITARY VEHICLE ELECTRIFICATION MARKET, BY COUNTRY, 2021-2024 (USD MILLION)
- TABLE 50 NORTH AMERICA: MILITARY VEHICLE ELECTRIFICATION MARKET, BY COUNTRY, 2025-2030 (USD MILLION)
- TABLE 51 NORTH AMERICA: MILITARY VEHICLE ELECTRIFICATION MARKET, BY PLATFORM, 2021-2024 (USD MILLION)
- TABLE 52 NORTH AMERICA: MILITARY VEHICLE ELECTRIFICATION MARKET, BY PLATFORM, 2025-2030 (USD MILLION)
- TABLE 53 NORTH AMERICA: MILITARY VEHICLE ELECTRIFICATION MARKET, BY VOLTAGE, 2021-2024 (USD MILLION)
- TABLE 54 NORTH AMERICA: MILITARY VEHICLE ELECTRIFICATION MARKET, BY VOLTAGE, 2025-2030 (USD MILLION)
- TABLE 55 NORTH AMERICA: MILITARY VEHICLE ELECTRIFICATION MARKET, BY TECHNOLOGY, 2021-2024 (USD MILLION)
- TABLE 56 NORTH AMERICA: MILITARY VEHICLE ELECTRIFICATION MARKET, BY TECHNOLOGY, 2025-2030 (USD MILLION)
- TABLE 57 NORTH AMERICA: MILITARY VEHICLE ELECTRIFICATION MARKET, BY MODE OF OPERATION, 2021-2024 (USD MILLION)
- TABLE 58 NORTH AMERICA: MILITARY VEHICLE ELECTRIFICATION MARKET, BY MODE OF OPERATION, 2025-2030 (USD MILLION)
- TABLE 59 US: MILITARY VEHICLE ELECTRIFICATION MARKET, BY PLATFORM, 2021-2024 (USD MILLION)
- TABLE 60 US: MILITARY VEHICLE ELECTRIFICATION MARKET, BY PLATFORM, 2025-2030 (USD MILLION)
- TABLE 61 US: MILITARY VEHICLE ELECTRIFICATION MARKET, BY TECHNOLOGY, 2021-2024 (USD MILLION)
- TABLE 62 US: MILITARY VEHICLE ELECTRIFICATION MARKET, BY TECHNOLOGY, 2025-2030 (USD MILLION)
- TABLE 63 CANADA: MILITARY VEHICLE ELECTRIFICATION MARKET, BY PLATFORM, 2021-2024 (USD MILLION)
- TABLE 64 CANADA: MILITARY VEHICLE ELECTRIFICATION MARKET, BY PLATFORM, 2025-2030 (USD MILLION)
- TABLE 65 CANADA: MILITARY VEHICLE ELECTRIFICATION MARKET, BY TECHNOLOGY, 2021-2024 (USD MILLION)
- TABLE 66 CANADA: MILITARY VEHICLE ELECTRIFICATION MARKET, BY TECHNOLOGY, 2025-2030 (USD MILLION)
- TABLE 67 EUROPE: MILITARY VEHICLE ELECTRIFICATION MARKET, BY COUNTRY, 2021-2024 (USD MILLION)
- TABLE 68 EUROPE: MILITARY VEHICLE ELECTRIFICATION MARKET, BY COUNTRY, 2025-2030 (USD MILLION)
- TABLE 69 EUROPE: MILITARY VEHICLE ELECTRIFICATION MARKET, BY PLATFORM, 2021-2024 (USD MILLION)
- TABLE 70 EUROPE: MILITARY VEHICLE ELECTRIFICATION MARKET, BY PLATFORM, 2025-2030 (USD MILLION)
- TABLE 71 EUROPE: MILITARY VEHICLE ELECTRIFICATION MARKET, BY VOLTAGE, 2021-2024 (USD MILLION)
- TABLE 72 EUROPE: MILITARY VEHICLE ELECTRIFICATION MARKET, BY VOLTAGE, 2025-2030 (USD MILLION)
- TABLE 73 EUROPE: MILITARY VEHICLE ELECTRIFICATION MARKET, BY TECHNOLOGY, 2021-2024 (USD MILLION)
- TABLE 74 EUROPE: MILITARY VEHICLE ELECTRIFICATION MARKET, BY TECHNOLOGY, 2025-2030 (USD MILLION)
- TABLE 75 EUROPE: MILITARY VEHICLE ELECTRIFICATION MARKET, BY MODE OF OPERATION, 2021-2024 (USD MILLION)
- TABLE 76 EUROPE: MILITARY VEHICLE ELECTRIFICATION MARKET, BY MODE OF OPERATION, 2025-2030 (USD MILLION)
- TABLE 77 UK: MILITARY VEHICLE ELECTRIFICATION MARKET, BY PLATFORM, 2021-2024 (USD MILLION)
- TABLE 78 UK: MILITARY VEHICLE ELECTRIFICATION MARKET, BY PLATFORM, 2025-2030 (USD MILLION)
- TABLE 79 UK: MILITARY VEHICLE ELECTRIFICATION MARKET, BY TECHNOLOGY, 2021-2024 (USD MILLION)
- TABLE 80 UK: MILITARY VEHICLE ELECTRIFICATION MARKET, BY TECHNOLOGY, 2025-2030 (USD MILLION)
- TABLE 81 FRANCE: MILITARY VEHICLE ELECTRIFICATION MARKET, BY PLATFORM, 2021-2024 (USD MILLION)
- TABLE 82 FRANCE: MILITARY VEHICLE ELECTRIFICATION MARKET, BY PLATFORM, 2025-2030 (USD MILLION)
- TABLE 83 FRANCE: MILITARY VEHICLE ELECTRIFICATION MARKET, BY TECHNOLOGY, 2021-2024 (USD MILLION)
- TABLE 84 FRANCE: MILITARY VEHICLE ELECTRIFICATION MARKET, BY TECHNOLOGY, 2025-2030 (USD MILLION)
- TABLE 85 GERMANY: MILITARY VEHICLE ELECTRIFICATION MARKET, BY PLATFORM, 2021-2024 (USD MILLION)
- TABLE 86 GERMANY: MILITARY VEHICLE ELECTRIFICATION MARKET, BY PLATFORM, 2025-2030 (USD MILLION)
- TABLE 87 GERMANY: MILITARY VEHICLE ELECTRIFICATION MARKET, BY TECHNOLOGY, 2021-2024 (USD MILLION)
- TABLE 88 GERMANY: MILITARY VEHICLE ELECTRIFICATION MARKET, BY TECHNOLOGY, 2025-2030 (USD MILLION)
- TABLE 89 ITALY: MILITARY VEHICLE ELECTRIFICATION MARKET, BY PLATFORM, 2021-2024 (USD MILLION)
- TABLE 90 ITALY: MILITARY VEHICLE ELECTRIFICATION MARKET, BY PLATFORM, 2025-2030 (USD MILLION)
- TABLE 91 ITALY: MILITARY VEHICLE ELECTRIFICATION MARKET, BY TECHNOLOGY, 2021-2024 (USD MILLION)
- TABLE 92 ITALY: MILITARY VEHICLE ELECTRIFICATION MARKET, BY TECHNOLOGY, 2025-2030 (USD MILLION)
- TABLE 93 REST OF EUROPE: MILITARY VEHICLE ELECTRIFICATION MARKET, BY PLATFORM, 2021-2024 (USD MILLION)
- TABLE 94 REST OF EUROPE: MILITARY VEHICLE ELECTRIFICATION MARKET, BY PLATFORM, 2025-2030 (USD MILLION)
- TABLE 95 REST OF EUROPE: MILITARY VEHICLE ELECTRIFICATION MARKET, BY TECHNOLOGY, 2021-2024 (USD MILLION)
- TABLE 96 REST OF EUROPE: MILITARY VEHICLE ELECTRIFICATION MARKET, BY TECHNOLOGY, 2025-2030 (USD MILLION)
- TABLE 97 ASIA PACIFIC: MILITARY VEHICLE ELECTRIFICATION MARKET, BY COUNTRY, 2021-2024 (USD MILLION)
- TABLE 98 ASIA PACIFIC: MILITARY VEHICLE ELECTRIFICATION MARKET, BY COUNTRY, 2025-2030 (USD MILLION)
- TABLE 99 ASIA PACIFIC: MILITARY VEHICLE ELECTRIFICATION MARKET, BY PLATFORM, 2021-2024 (USD MILLION)
- TABLE 100 ASIA PACIFIC: MILITARY VEHICLE ELECTRIFICATION MARKET, BY PLATFORM, 2025-2030 (USD MILLION)
- TABLE 101 ASIA PACIFIC: MILITARY VEHICLE ELECTRIFICATION MARKET, BY VOLTAGE, 2021-2024 (USD MILLION)
- TABLE 102 ASIA PACIFIC: MILITARY VEHICLE ELECTRIFICATION MARKET, BY VOLTAGE, 2025-2030 (USD MILLION)
- TABLE 103 ASIA PACIFIC: MILITARY VEHICLE ELECTRIFICATION MARKET, BY TECHNOLOGY, 2021-2024 (USD MILLION)
- TABLE 104 ASIA PACIFIC: MILITARY VEHICLE ELECTRIFICATION MARKET, BY TECHNOLOGY, 2025-2030 (USD MILLION)
- TABLE 105 ASIA PACIFIC: MILITARY VEHICLE ELECTRIFICATION MARKET, BY MODE OF OPERATION, 2021-2024 (USD MILLION)
- TABLE 106 ASIA PACIFIC: MILITARY VEHICLE ELECTRIFICATION MARKET, BY MODE OF OPERATION, 2025-2030 (USD MILLION)
- TABLE 107 INDIA: MILITARY VEHICLE ELECTRIFICATION MARKET, BY PLATFORM, 2021-2024 (USD MILLION)
- TABLE 108 INDIA: MILITARY VEHICLE ELECTRIFICATION MARKET, BY PLATFORM, 2025-2030 (USD MILLION)
- TABLE 109 INDIA: MILITARY VEHICLE ELECTRIFICATION MARKET, BY TECHNOLOGY, 2021-2024 (USD MILLION)
- TABLE 110 INDIA: MILITARY VEHICLE ELECTRIFICATION MARKET, BY TECHNOLOGY, 2025-2030 (USD MILLION)
- TABLE 111 JAPAN: MILITARY VEHICLE ELECTRIFICATION MARKET, BY PLATFORM, 2021-2024 (USD MILLION)
- TABLE 112 JAPAN: MILITARY VEHICLE ELECTRIFICATION MARKET, BY PLATFORM, 2025-2030 (USD MILLION)
- TABLE 113 JAPAN: MILITARY VEHICLE ELECTRIFICATION MARKET, BY TECHNOLOGY, 2021-2024 (USD MILLION)
- TABLE 114 JAPAN: MILITARY VEHICLE ELECTRIFICATION MARKET, BY TECHNOLOGY, 2025-2030 (USD MILLION)
- TABLE 115 AUSTRALIA: MILITARY VEHICLE ELECTRIFICATION MARKET, BY PLATFORM, 2021-2024 (USD MILLION)
- TABLE 116 AUSTRALIA: MILITARY VEHICLE ELECTRIFICATION MARKET, BY PLATFORM, 2025-2030 (USD MILLION)
- TABLE 117 AUSTRALIA: MILITARY VEHICLE ELECTRIFICATION MARKET, BY TECHNOLOGY, 2021-2024 (USD MILLION)
- TABLE 118 AUSTRALIA: MILITARY VEHICLE ELECTRIFICATION MARKET, BY TECHNOLOGY, 2025-2030 (USD MILLION)
- TABLE 119 SOUTH KOREA: MILITARY VEHICLE ELECTRIFICATION MARKET, BY PLATFORM, 2021-2024 (USD MILLION)
- TABLE 120 SOUTH KOREA: MILITARY VEHICLE ELECTRIFICATION MARKET, BY PLATFORM, 2025-2030 (USD MILLION)
- TABLE 121 SOUTH KOREA: MILITARY VEHICLE ELECTRIFICATION MARKET, BY TECHNOLOGY, 2021-2024 (USD MILLION)
- TABLE 122 SOUTH KOREA: MILITARY VEHICLE ELECTRIFICATION MARKET, BY TECHNOLOGY, 2025-2030 (USD MILLION)
- TABLE 123 MIDDLE EAST: MILITARY VEHICLE ELECTRIFICATION MARKET, BY REGION, 2021-2024 (USD MILLION)
- TABLE 124 MIDDLE EAST: MILITARY VEHICLE ELECTRIFICATION MARKET, BY REGION, 2025-2030 (USD MILLION)
- TABLE 125 MIDDLE EAST: MILITARY VEHICLE ELECTRIFICATION MARKET, BY GCC, 2021-2024 (USD MILLION)
- TABLE 126 MIDDLE EAST: MILITARY VEHICLE ELECTRIFICATION MARKET, BY GCC, 2025-2030 (USD MILLION)
- TABLE 127 MIDDLE EAST: MILITARY VEHICLE ELECTRIFICATION MARKET, BY REST OF MIDDLE EAST, 2021-2024 (USD MILLION)
- TABLE 128 MIDDLE EAST: MILITARY VEHICLE ELECTRIFICATION MARKET, BY REST OF MIDDLE EAST, 2025-2030 (USD MILLION)
- TABLE 129 MIDDLE EAST: MILITARY VEHICLE ELECTRIFICATION MARKET, BY PLATFORM, 2021-2024 (USD MILLION)
- TABLE 130 MIDDLE EAST: MILITARY VEHICLE ELECTRIFICATION MARKET, BY PLATFORM, 2025-2030 (USD MILLION)
- TABLE 131 MIDDLE EAST: MILITARY VEHICLE ELECTRIFICATION MARKET, BY VOLTAGE, 2021-2024 (USD MILLION)
- TABLE 132 MIDDLE EAST: MILITARY VEHICLE ELECTRIFICATION MARKET, BY VOLTAGE, 2025-2030 (USD MILLION)
- TABLE 133 MIDDLE EAST: MILITARY VEHICLE ELECTRIFICATION MARKET, BY TECHNOLOGY, 2021-2024 (USD MILLION)
- TABLE 134 MIDDLE EAST: MILITARY VEHICLE ELECTRIFICATION MARKET, BY TECHNOLOGY, 2025-2030 (USD MILLION)
- TABLE 135 MIDDLE EAST: MILITARY VEHICLE ELECTRIFICATION MARKET, BY MODE OF OPERATION, 2021-2024 (USD MILLION)
- TABLE 136 MIDDLE EAST: MILITARY VEHICLE ELECTRIFICATION MARKET, BY MODE OF OPERATION, 2025-2030 (USD MILLION)
- TABLE 137 SAUDI ARABIA: MILITARY VEHICLE ELECTRIFICATION MARKET, BY PLATFORM, 2021-2024 (USD MILLION)
- TABLE 138 SAUDI ARABIA: MILITARY VEHICLE ELECTRIFICATION MARKET, BY PLATFORM, 2025-2030 (USD MILLION)
- TABLE 139 SAUDI ARABIA: MILITARY VEHICLE ELECTRIFICATION MARKET, BY TECHNOLOGY, 2021-2024 (USD MILLION)
- TABLE 140 SAUDI ARABIA: MILITARY VEHICLE ELECTRIFICATION MARKET, BY TECHNOLOGY, 2025-2030 (USD MILLION)
- TABLE 141 ISRAEL: MILITARY VEHICLE ELECTRIFICATION MARKET, BY PLATFORM, 2021-2024 (USD MILLION)
- TABLE 142 ISRAEL: MILITARY VEHICLE ELECTRIFICATION MARKET, BY PLATFORM, 2025-2030 (USD MILLION)
- TABLE 143 ISRAEL: MILITARY VEHICLE ELECTRIFICATION MARKET, BY TECHNOLOGY, 2021-2024 (USD MILLION)
- TABLE 144 ISRAEL: MILITARY VEHICLE ELECTRIFICATION MARKET, BY TECHNOLOGY, 2025-2030 (USD MILLION)
- TABLE 145 TURKEY: MILITARY VEHICLE ELECTRIFICATION MARKET, BY PLATFORM, 2021-2024 (USD MILLION)
- TABLE 146 TURKEY: MILITARY VEHICLE ELECTRIFICATION MARKET, BY PLATFORM, 2025-2030 (USD MILLION)
- TABLE 147 TURKEY: MILITARY VEHICLE ELECTRIFICATION MARKET, BY TECHNOLOGY, 2021-2024 (USD MILLION)
- TABLE 148 TURKEY: MILITARY VEHICLE ELECTRIFICATION MARKET, BY TECHNOLOGY, 2025-2030 (USD MILLION)
- TABLE 149 REST OF THE WORLD: MILITARY VEHICLE ELECTRIFICATION MARKET, BY REGION, 2021-2024 (USD MILLION)
- TABLE 150 REST OF THE WORLD: MILITARY VEHICLE ELECTRIFICATION MARKET, BY REGION, 2025-2030 (USD MILLION)
- TABLE 151 REST OF THE WORLD: MILITARY VEHICLE ELECTRIFICATION MARKET, BY PLATFORM, 2021-2024 (USD MILLION)
- TABLE 152 REST OF THE WORLD: MILITARY VEHICLE ELECTRIFICATION MARKET, BY PLATFORM, 2025-2030 (USD MILLION)
- TABLE 153 REST OF THE WORLD: MILITARY VEHICLE ELECTRIFICATION MARKET, BY VOLTAGE, 2021-2024 (USD MILLION)
- TABLE 154 REST OF THE WORLD: MILITARY VEHICLE ELECTRIFICATION MARKET, BY VOLTAGE, 2025-2030 (USD MILLION)
- TABLE 155 REST OF THE WORLD: MILITARY VEHICLE ELECTRIFICATION MARKET, BY TECHNOLOGY, 2021-2024 (USD MILLION)
- TABLE 156 REST OF THE WORLD: MILITARY VEHICLE ELECTRIFICATION MARKET, BY TECHNOLOGY, 2025-2030 (USD MILLION)
- TABLE 157 REST OF THE WORLD: MILITARY VEHICLE ELECTRIFICATION MARKET, BY MODE OF OPERATION, 2021-2024 (USD MILLION)
- TABLE 158 REST OF THE WORLD: MILITARY VEHICLE ELECTRIFICATION MARKET, BY MODE OF OPERATION, 2025-2030 (USD MILLION)
- TABLE 159 BRAZIL: MILITARY VEHICLE ELECTRIFICATION MARKET, BY PLATFORM, 2021-2024 (USD MILLION)
- TABLE 160 BRAZIL: MILITARY VEHICLE ELECTRIFICATION MARKET, BY PLATFORM, 2025-2030 (USD MILLION)
- TABLE 161 BRAZIL: MILITARY VEHICLE ELECTRIFICATION MARKET, BY TECHNOLOGY, 2021-2024 (USD MILLION)
- TABLE 162 BRAZIL: MILITARY VEHICLE ELECTRIFICATION MARKET, BY TECHNOLOGY, 2025-2030 (USD MILLION)
- TABLE 163 MEXICO: MILITARY VEHICLE ELECTRIFICATION MARKET, BY PLATFORM, 2021-2024 (USD MILLION)
- TABLE 164 MEXICO: MILITARY VEHICLE ELECTRIFICATION MARKET, BY PLATFORM, 2025-2030 (USD MILLION)
- TABLE 165 MEXICO: MILITARY VEHICLE ELECTRIFICATION MARKET, BY TECHNOLOGY, 2021-2024 (USD MILLION)
- TABLE 166 MEXICO: MILITARY VEHICLE ELECTRIFICATION MARKET, BY TECHNOLOGY, 2025-2030 (USD MILLION)
- TABLE 167 SOUTH AFRICA: MILITARY VEHICLE ELECTRIFICATION MARKET, BY PLATFORM, 2021-2024 (USD MILLION)
- TABLE 168 SOUTH AFRICA: MILITARY VEHICLE ELECTRIFICATION MARKET, BY PLATFORM, 2025-2030 (USD MILLION)
- TABLE 169 SOUTH AFRICA: MILITARY VEHICLE ELECTRIFICATION MARKET, BY TECHNOLOGY, 2021-2024 (USD MILLION)
- TABLE 170 SOUTH AFRICA: MILITARY VEHICLE ELECTRIFICATION MARKET, BY TECHNOLOGY, 2025-2030 (USD MILLION)
- TABLE 171 STRATEGIES ADOPTED BY KEY PLAYERS IN MILITARY VEHICLE ELECTRIFICATION MARKET
- TABLE 172 MILITARY VEHICLE ELECTRIFICATION MARKET: DEGREE OF COMPETITION
- TABLE 173 PLATFORM FOOTPRINT, 2024
- TABLE 174 TECHNOLOGY FOOTPRINT, 2024
- TABLE 175 REGION FOOTPRINT, 2024
- TABLE 176 MILITARY VEHICLE ELECTRIFICATION MARKET: KEY STARTUPS/SMES
- TABLE 177 MILITARY VEHICLE ELECTRIFICATION MARKET: COMPETITIVE BENCHMARKING OF STARTUPS/SMES
- TABLE 178 MILITARY VEHICLE ELECTRIFICATION MARKET: PRODUCT LAUNCHES, JANUARY 2020-DECEMBER 2024
- TABLE 179 MILITARY VEHICLE ELECTRIFICATION MARKET: DEALS, JANUARY 2020-FEBRUARY 2025
- TABLE 180 MILITARY VEHICLE ELECTRIFICATION MARKET: OTHERS, JANUARY 2020-FEBRUARY 2025
- TABLE 181 OSHKOSH CORPORATION: COMPANY OVERVIEW
- TABLE 182 OSHKOSH CORPORATION: PRODUCTS OFFERED
- TABLE 183 OSHKOSH CORPORATION: PRODUCT LAUNCHES
- TABLE 184 OSHKOSH CORPORATION: OTHER DEVELOPMENTS
- TABLE 185 GM DEFENSE, LLC: COMPANY OVERVIEW
- TABLE 186 GM DEFENSE, LLC: PRODUCTS OFFERED
- TABLE 187 GM DEFENSE, LLC: DEALS
- TABLE 188 GM DEFENSE, LLC: OTHER DEVELOPMENTS
- TABLE 189 GENERAL DYNAMICS CORPORATION: COMPANY OVERVIEW
- TABLE 190 GENERAL DYNAMICS CORPORATION: PRODUCTS OFFERED
- TABLE 191 GENERAL DYNAMICS CORPORATION: OTHER DEVELOPMENTS
- TABLE 192 BAE SYSTEMS: COMPANY OVERVIEW
- TABLE 193 BAE SYSTEMS: PRODUCTS OFFERED
- TABLE 194 BAE SYSTEMS: PRODUCT LAUNCHES
- TABLE 195 BAE SYSTEMS: OTHER DEVELOPMENTS
- TABLE 196 LEONARDO S.P.A.: COMPANY OVERVIEW
- TABLE 197 LEONARDO S.P.A.: PRODUCTS OFFERED
- TABLE 198 LEONARDO S.P.A: OTHER DEVELOPMENTS
- TABLE 199 TEXTRON INC.: COMPANY OVERVIEW
- TABLE 200 TEXTRON INC.: PRODUCTS OFFERED
- TABLE 201 TEXTRON INC.: DEALS
- TABLE 202 TEXTRON INC.: OTHER DEVELOPMENTS
- TABLE 203 ST ENGINEERING: COMPANY OVERVIEW
- TABLE 204 ST ENGINEERING: PRODUCTS OFFERED
- TABLE 205 ST ENGINEERING: PRODUCT LAUNCHES
- TABLE 206 QINETIQ: COMPANY OVERVIEW
- TABLE 207 QINETIQ: PRODUCTS OFFERED
- TABLE 208 QINETIQ: DEALS
- TABLE 209 POLARIS INDUSTRIES INC.: COMPANY OVERVIEW
- TABLE 210 POLARIS INDUSTRIES INC.: PRODUCTS OFFERED
- TABLE 211 POLARIS INDUSTRIES INC.: PRODUCT LAUNCHES
- TABLE 212 ASELSAN A.S.: COMPANY OVERVIEW
- TABLE 213 ASELSAN A.S.: PRODUCTS OFFERED
- TABLE 214 ASELSAN A.S.: DEALS
- TABLE 215 OTOKAR AUTOMOTIVE AND DEFENSE INDUSTRY INC.: COMPANY OVERVIEW
- TABLE 216 OTOKAR AUTOMOTIVE AND DEFENSE INDUSTRY INC.: PRODUCTS OFFERED
- TABLE 217 RHEINMETALL AG: COMPANY OVERVIEW
- TABLE 218 RHEINMETALL AG: PRODUCTS OFFERED
- TABLE 219 RHEINMETALL AG: PRODUCT LAUNCHES
- TABLE 220 RHEINMETALL AG.: OTHER DEVELOPMENTS
- TABLE 221 THALES: COMPANY OVERVIEW
- TABLE 222 THALES: PRODUCTS OFFERED
- TABLE 223 THALES: PRODUCT LAUNCHES
- TABLE 224 THALES: DEALS
- TABLE 225 THALES: OTHER DEVELOPMENTS
- TABLE 226 KNDS N.V.: COMPANY OVERVIEW
- TABLE 227 KNDS N.V.: PRODUCTS OFFERED
- TABLE 228 KNDS N.V.: DEALS
- TABLE 229 KNDS N.V.: OTHER DEVELOPMENTS
- TABLE 230 FFG FLENSBURGER FAHRZEUGBAU GESELLSCHAFT MBH: COMPANY OVERVIEW
- TABLE 231 FFG FLENSBURGER FAHRZEUGBAU GESELLSCHAFT MBH: PRODUCTS OFFERED
- TABLE 232 ARQUUS: COMPANY OVERVIEW
- TABLE 233 EPSILOR ELECTRIC FUEL LTD.: COMPANY OVERVIEW
- TABLE 234 UKROBORONPROM: COMPANY OVERVIEW
- TABLE 235 MILREM ROBOTICS: COMPANY OVERVIEW
- TABLE 236 AM GENERAL: COMPANY OVERVIEW
- TABLE 237 HIGHLAND SYSTEMS: COMPANY OVERVIEW
- TABLE 238 ALKE: COMPANY OVERVIEW
- TABLE 239 MEGA ENGINEERING VEHICLES INC.: COMPANY OVERVIEW
- TABLE 240 FNSS: COMPANY OVERVIEW
List of Figures
- FIGURE 1 MILITARY VEHICLE ELECTRIFICATION MARKET SEGMENTATION
- FIGURE 2 RESEARCH PROCESS FLOW
- FIGURE 3 RESEARCH DESIGN
- FIGURE 4 MARKET SIZE ESTIMATION METHODOLOGY: BOTTOM-UP APPROACH
- FIGURE 5 MARKET SIZE ESTIMATION METHODOLOGY: TOP-DOWN APPROACH
- FIGURE 6 DATA TRIANGULATION
- FIGURE 7 MEDIUM VOLTAGE SEGMENT TO HAVE LARGEST MARKET SHARE IN 2030
- FIGURE 8 HYBRID SEGMENT TO ACCOUNT FOR LEADING MARKET SHARE IN 2030
- FIGURE 9 MANNED SEGMENT TO ACCOUNT FOR LEADING MARKET SHARE IN 2030
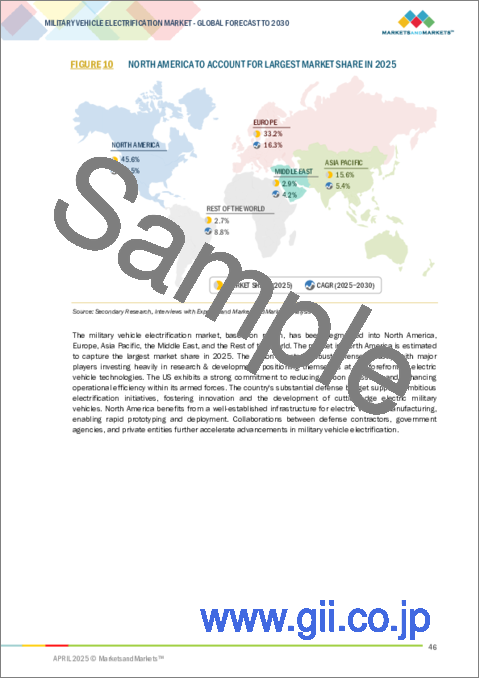
- FIGURE 10 NORTH AMERICA TO ACCOUNT FOR LARGEST MARKET SHARE IN 2025
- FIGURE 11 GROWING INVESTMENTS, MILITARY MODERNIZATION PROGRAMS, AND TECHNOLOGICAL ADVANCEMENTS TO DRIVE MARKET
- FIGURE 12 MEDIUM VOLTAGE SEGMENT TO LEAD MARKET DURING FORECAST PERIOD
- FIGURE 13 MANNED SEGMENT TO ACCOUNT FOR LEADING MARKET SHARE IN 2030
- FIGURE 14 COMBAT VEHICLES SEGMENT TO BE DOMINANT DURING FORECAST PERIOD
- FIGURE 15 NORTH AMERICA TO HAVE LARGEST MARKET SHARE IN 2030
- FIGURE 16 MILITARY VEHICLE ELECTRIFICATION MARKET DYNAMICS
- FIGURE 17 GLOBAL MILITARY EXPENDITURE, 2014-2024
- FIGURE 18 ECOSYSTEM ANALYSIS
- FIGURE 19 TRENDS AND DISRUPTIONS IMPACTING CUSTOMER BUSINESS
- FIGURE 20 VALUE CHAIN ANALYSIS
- FIGURE 21 IMPORT DATA FOR HS CODE 8506-COMPLIANT PRODUCTS, BY COUNTRY, 2021-2024 (USD MILLION)
- FIGURE 22 EXPORT DATA FOR HS CODE 8506-COMPLIANT PRODUCTS, BY COUNTRY, 2021-2024 (USD MILLION)
- FIGURE 23 INFLUENCE OF STAKEHOLDERS ON BUYING PROCESS, BY PLATFORM
- FIGURE 24 KEY BUYING CRITERIA, BY PLATFORM
- FIGURE 25 TECHNOLOGY ROADMAP
- FIGURE 26 BILL OF MATERIALS FOR COMBAT VEHICLES
- FIGURE 27 BILL OF MATERIALS FOR COMBAT SUPPORT VEHICLES
- FIGURE 28 BILL OF MATERIALS FOR UNMANNED ARMORED VEHICLES
- FIGURE 29 TOTAL COST OF OWNERSHIP FOR MILITARY VEHICLE ELECTRIFICATION
- FIGURE 30 BUSINESS MODELS FOR MILITARY VEHICLE ELECTRIFICATION
- FIGURE 31 INVESTMENT AND FUNDING SCENARIO, 2020-2024
- FIGURE 32 MACROECONOMIC OUTLOOK FOR NORTH AMERICA, EUROPE, ASIA PACIFIC, MIDDLE EAST
- FIGURE 33 MACROECONOMIC OUTLOOK FOR LATIN AMERICA AND AFRICA
- FIGURE 34 SUPPLY CHAIN ANALYSIS
- FIGURE 35 NUMBER OF PATENTS GRANTED FOR MILITARY VEHICLE ELECTRIFICATION MARKET, 2014-2023
- FIGURE 36 IMPACT OF AI ON DEFENSE INDUSTRY
- FIGURE 37 ADOPTION OF AI IN MILITARY BY TOP COUNTRIES
- FIGURE 38 IMPACT OF AI ON MILITARY VEHICLE ELECTRIFICATION MARKET
- FIGURE 39 MILITARY VEHICLE ELECTRIFICATION MARKET, BY PLATFORM, 2025-2030
- FIGURE 40 MILITARY VEHICLE ELECTRIFICATION MARKET, BY MODE OF OPERATION, 2025-2030
- FIGURE 41 MILITARY VEHICLE ELECTRIFICATION MARKET, BY SYSTEM, 2025-2030
- FIGURE 42 MILITARY VEHICLE ELECTRIFICATION MARKET, BY TECHNOLOGY, 2025-2030
- FIGURE 43 MILITARY VEHICLE ELECTRIFICATION MARKET, BY VOLTAGE, 2025-2030
- FIGURE 44 NORTH AMERICA TO GROW AT HIGHEST CAGR DURING FORECAST PERIOD
- FIGURE 45 NORTH AMERICA: MILITARY VEHICLE ELECTRIFICATION MARKET SNAPSHOT
- FIGURE 46 EUROPE: MILITARY VEHICLE ELECTRIFICATION MARKET SNAPSHOT
- FIGURE 47 ASIA PACIFIC: MILITARY VEHICLE ELECTRIFICATION MARKET SNAPSHOT
- FIGURE 48 MIDDLE EAST: MILITARY VEHICLE ELECTRIFICATION MARKET SNAPSHOT
- FIGURE 49 REST OF THE WORLD: MILITARY VEHICLE ELECTRIFICATION MARKET SNAPSHOT
- FIGURE 50 MARKET SHARE OF KEY PLAYERS, 2024
- FIGURE 51 REVENUE ANALYSIS OF KEY PLAYERS, 2019-2024 (USD MILLION)
- FIGURE 52 COMPANY EVALUATION MATRIX, 2024
- FIGURE 53 COMPANY FOOTPRINT, 2024
- FIGURE 54 STARTUP/SME EVALUATION MATRIX, 2024
- FIGURE 55 VALUATION OF PROMINENT MARKET PLAYERS, 2025
- FIGURE 56 FINANCIAL METRICS OF PROMINENT MARKET PLAYERS, 2025
- FIGURE 57 BRAND/PRODUCT COMPARISON
- FIGURE 58 OSHKOSH CORPORATION: COMPANY SNAPSHOT
- FIGURE 59 GM DEFENSE, LLC: COMPANY SNAPSHOT
- FIGURE 60 GENERAL DYNAMICS CORPORATION: COMPANY SNAPSHOT
- FIGURE 61 BAE SYSTEMS: COMPANY SNAPSHOT
- FIGURE 62 LEONARDO S.P.A.: COMPANY SNAPSHOT
- FIGURE 63 TEXTRON INC.: COMPANY SNAPSHOT
- FIGURE 64 ST ENGINEERING: COMPANY SNAPSHOT
- FIGURE 65 QINETIQ: COMPANY SNAPSHOT
- FIGURE 66 POLARIS INDUSTRIES INC.: COMPANY SNAPSHOT
- FIGURE 67 ASELSAN A.S.: COMPANY SNAPSHOT
- FIGURE 68 OTOKAR AUTOMOTIVE AND DEFENSE INDUSTRY INC.: COMPANY SNAPSHOT
- FIGURE 69 RHEINMETALL AG: COMPANY SNAPSHOT
- FIGURE 70 THALES: COMPANY SNAPSHOT
- FIGURE 71 KNDS N.V.: COMPANY SNAPSHOT
The military vehicle electrification market is estimated at USD 3.47 billion in 2025 and is projected to reach USD 6.82 billion by 2030 at a CAGR of 14.5% from 2025 to 2030. The military vehicle electrification market is driven by technological advancements, strategic imperatives, and an emphasis on sustainability. Over the past few years, there has been a shift toward integrating electric propulsion systems in military vehicles to enhance operational efficiency, reduce dependence on traditional fuel sources, and address environmental concerns. Advancements in battery technology, such as the development of high-energy-density solutions and improved safety features, are pivotal in extending the range and endurance of electric military vehicles.
| Scope of the Report | |
|---|---|
| Years Considered for the Study | 2020-2030 |
| Base Year | 2024 |
| Forecast Period | 2025-2030 |
| Units Considered | Value (USD Billion) |
| Segments | By Equipment Class, System, Fit, Ship Type & Region |
| Regions covered | North America, Europe, APAC, RoW |
The power generation systems segment is the second-largest segment of the market by system. Based on system, the military vehicle electrification market has been segmented into power generation systems, cooling systems, energy storage systems, traction drive systems/propulsion systems, power conversion systems, and transmission systems. The power generation systems segment is expected to experience significant growth in the military vehicle electrification market due to a combination of factors that include technological advancements, operational advantages, and strategic imperatives. The integration of electric power generation systems with military trucks makes them more versatile and efficient as a whole. The systems involve sophisticated generators and onboard energy storage systems, which allow vehicles to generate and store electricity onboard. They provide increased responsiveness and power delivery flexibility to military mission-critical equipment and systems, making military trucks operationally capable.
The command and control vehicles segment is the fastest-growing segment of the market by support vehicles. The command and control (C2) vehicles segment is expected to grow at the fastest rate in the military vehicle electrification market by support vehicles. C2 vehicles are key enablers of contemporary military operations as mobile command centers that support communication, coordination, and decision-making. Electrification of these vehicles has some inherent benefits like less noise, more stealth, and better mobility, which are imperative for efficient command and control in varied operating environments. Electric C2 vehicles support better operational effectiveness and responsiveness. Electric drive systems facilitate rapid acceleration, deceleration, and agile maneuvering, enabling rapid redeployment and repositioning within the battlefield. Also, the lower maintenance needs of electric drivetrains support greater vehicle availability, as C2 vehicles are available to be deployed upon demand.
Europe is the fastest-growing military vehicle electrification market.
Europe is projected to grow at the fastest rate in the military vehicle electrification market. The need for modernizing capabilities has compelled the countries in this region to invest significantly in the adoption of military vehicle electrification technologies such as hybrid electric drives, fuel cells, batteries, and fully electric vehicles. Leonardo S.p.A. (Italy) and BAE Systems (UK) are among the key players operating in the military vehicle electrification market in the region.
Break-up of profiles of primary participants in the military vehicle electrification market: By Company Type: Tier 1- 35%, Tier 2- 45%, and Tier 3- 20% By Designation: C-Level Executives- 35%, Director Level- 25%, and Others- 40% By Region: North America- 25%, Europe- 15%, Asia Pacific- 40%, Middle East- 15%, Rest of the World - 15%
Prominent companies in the military vehicle electrification market are Oshkosh Corporation (US), GM Defense LLC (US), General Dynamics Corporation (US), BAE Systems (UK), and Leonardo S.p.A. (Italy), among others.
Research coverage: The market study covers the military vehicle electrification market across segments. It aims to estimate the market size and the growth potential of this market across different segments, such as system, platform, technology, mode of operation, voltage, and region. The study also includes an in-depth competitive analysis of the key players in the market, along with their company profiles, key observations related to product and business offerings, recent developments, and key market strategies. Key benefits of buying this report: This report will help the leaders/new entrants in this market with information on the closest approximations of the revenue numbers for the overall military vehicle electrification market and its subsegments. The report covers the entire ecosystem of the military vehicle electrification industry and will help stakeholders understand the competitive landscape and gain more insights to better position their businesses and plan suitable go-to-market strategies. The report will also help stakeholders understand the pulse of the market and provide them with information on key market drivers, restraints, challenges, and opportunities.
The report provides insights into the following points:
- Analysis of Key Drivers (Advanced modern battlefield requirements, rising demand for electric power sources for military vehicles, increasing development of autonomous and unmanned military vehicles, and growing defense expenditures worldwide) Restraints (Need for balanced power-to-weight ratio, limited range of military electric vehicles, and high cost of fuel cell electric vehicles) Opportunities (Growing demand for hydrogen fuel cell systems) and Challenges (Lifecycle and durability issues of integrated systems and lack of standardized charging protocols) that impact the growth of the military vehicle electrification market.
- Product Development/Innovation: Detailed insights into upcoming technologies, research & development activities, and product & service launches in the military vehicle electrification market
- Market Development: Comprehensive information about lucrative markets - analysis of the military vehicle electrification market across varied regions
- Market Diversification: Exhaustive information about new products & services, untapped geographies, recent developments, and investments in the military vehicle electrification market
- Competitive Assessment: In-depth assessment of market shares, growth strategies, and service offerings of leading players like Oshkosh Corporation (US), GM Defense LLC (US), General Dynamics Corporation (US), BAE Systems (UK), and Leonardo S.p.A. (Italy) in the military vehicle electrification market
TABLE OF CONTENTS
1 INTRODUCTION
- 1.1 STUDY OBJECTIVES
- 1.2 MARKET DEFINITION
- 1.3 STUDY SCOPE
- 1.3.1 MARKETS COVERED
- 1.3.2 YEARS CONSIDERED
- 1.4 INCLUSIONS AND EXCLUSIONS
- 1.5 CURRENCY CONSIDERED
- 1.6 STAKEHOLDERS
- 1.7 SUMMARY OF CHANGES
2 RESEARCH METHODOLOGY
- 2.1 RESEARCH DATA
- 2.1.1 SECONDARY DATA
- 2.1.1.1 Secondary sources
- 2.1.1.2 Key data from secondary sources
- 2.1.2 PRIMARY DATA
- 2.1.2.1 Breakdown of primary interviews
- 2.1.1 SECONDARY DATA
- 2.2 RESEARCH APPROACH AND METHODOLOGY
- 2.2.1 BOTTOM-UP APPROACH
- 2.2.1.1 Market size estimation methodology: Bottom-up Approach
- 2.2.2 TOP-DOWN APPROACH
- 2.2.1 BOTTOM-UP APPROACH
- 2.3 FACTOR ANALYSIS
- 2.3.1 INTRODUCTION
- 2.3.2 DEMAND-SIDE INDICATORS
- 2.3.2.1 Strategic mobility requirements
- 2.3.2.2 Operational flexibility
- 2.3.2.3 Fuel efficiency and logistical considerations
- 2.3.2.4 Environmental sustainability goals
- 2.3.3 SUPPLY-SIDE INDICATORS
- 2.3.3.1 Financial trends of major defense contractors
- 2.4 MARKET TRIANGULATION
- 2.4.1 DATA TRIANGULATION
- 2.5 RESEARCH LIMITATIONS
- 2.6 RESEARCH ASSUMPTIONS
- 2.7 RISK ANALYSIS
3 EXECUTIVE SUMMARY
4 PREMIUM INSIGHTS
- 4.1 ATTRACTIVE GROWTH OPPORTUNITIES FOR PLAYERS IN MILITARY VEHICLE ELECTRIFICATION MARKET
- 4.2 MILITARY VEHICLE ELECTRIFICATION MARKET, BY VOLTAGE
- 4.3 MILITARY VEHICLE ELECTRIFICATION MARKET, BY MODE OF OPERATION
- 4.4 MILITARY VEHICLE ELECTRIFICATION MARKET, BY PLATFORM
- 4.5 MILITARY VEHICLE ELECTRIFICATION MARKET, BY REGION
5 MARKET OVERVIEW
- 5.1 INTRODUCTION
- 5.2 MARKET DYNAMICS
- 5.2.1 DRIVERS
- 5.2.1.1 Modern battlefield requirements
- 5.2.1.2 Elevated demand for electric power sources
- 5.2.1.3 Advancements in autonomous vehicle technology
- 5.2.1.4 Rise in global defense expenditures
- 5.2.2 RESTRAINTS
- 5.2.2.1 Need for balanced power-to-weight ratio
- 5.2.2.2 Limited range of military electric vehicles
- 5.2.2.3 Substantial procurement and retrofit costs
- 5.2.3 OPPORTUNITIES
- 5.2.3.1 Surge in demand for hydrogen fuel cell systems
- 5.2.3.2 Development of modular hybrid-electric architectures
- 5.2.4 CHALLENGES
- 5.2.4.1 Lifecycle and durability constraints
- 5.2.4.2 Lack of standardized charging protocols
- 5.2.1 DRIVERS
- 5.3 ECOSYSTEM ANALYSIS
- 5.3.1 PROMINENT COMPANIES
- 5.3.2 PRIVATE AND SMALL ENTERPRISES
- 5.3.3 END USERS
- 5.4 TRENDS AND DISRUPTIONS IMPACTING CUSTOMER BUSINESSES
- 5.5 TECHNOLOGY ANALYSIS
- 5.5.1 KEY TECHNOLOGIES
- 5.5.1.1 Additive manufacturing
- 5.5.1.2 Computerized weapon systems
- 5.5.2 COMPLEMENTARY TECHNOLOGIES
- 5.5.2.1 Modular open systems architecture
- 5.5.3 ADJACENT TECHNOLOGIES
- 5.5.3.1 Silent mobility technologies
- 5.5.3.2 Wireless battlefield charging systems
- 5.5.1 KEY TECHNOLOGIES
- 5.6 VALUE CHAIN ANALYSIS
- 5.7 CASE STUDY ANALYSIS
- 5.7.1 MAIN BATTLE TANK ELECTRIFICATION
- 5.7.2 RECONNAISSANCE VEHICLE ELECTRIFICATION
- 5.7.3 LOGISTICS VEHICLE ELECTRIFICATION
- 5.7.4 UNMANNED GROUND VEHICLE ELECTRIFICATION
- 5.8 OPERATIONAL DATA
- 5.9 PRICING ANALYSIS
- 5.9.1 AVERAGE SELLING PRICE, BY BATTERY
- 5.9.2 AVERAGE SELLING PRICE, BY REGION
- 5.10 TRADE ANALYSIS
- 5.10.1 IMPORT SCENARIO (HS CODE 8506)
- 5.10.2 EXPORT SCENARIO (HS CODE 8506)
- 5.11 KEY STAKEHOLDERS AND BUYING CRITERIA
- 5.11.1 KEY STAKEHOLDERS IN BUYING PROCESS
- 5.11.2 BUYING CRITERIA
- 5.12 KEY CONFERENCES AND EVENTS, 2025
- 5.13 REGULATORY LANDSCAPE
- 5.14 TECHNOLOGY ROADMAP
- 5.15 BILL OF MATERIALS
- 5.16 TOTAL COST OF OWNERSHIP
- 5.17 BUSINESS MODELS
- 5.18 INVESTMENT AND FUNDING SCENARIO
- 5.19 MACROECONOMIC OUTLOOK
- 5.19.1 INTRODUCTION
- 5.19.2 NORTH AMERICA
- 5.19.3 EUROPE
- 5.19.4 ASIA PACIFIC
- 5.19.5 MIDDLE EAST
- 5.19.6 LATIN AMERICA
- 5.19.7 AFRICA
6 INDUSTRY TRENDS
- 6.1 INTRODUCTION
- 6.2 TECHNOLOGY TRENDS
- 6.2.1 BATTERY SOURCES AND TYPES
- 6.2.1.1 Lithium-ion batteries
- 6.2.1.2 Lead-acid batteries
- 6.2.1.3 Nickel metal hydride batteries
- 6.2.1.4 Solid-state batteries
- 6.2.2 ADVANCED INTEGRATED COMMUNICATIONS AND NETWORK SYSTEMS
- 6.2.3 LIGHTWEIGHT MATERIALS AND DESIGNS
- 6.2.4 VEHICLE-TO-GRID (V2G) INTEGRATION
- 6.2.5 ADVANCED THERMAL MANAGEMENT SOLUTIONS
- 6.2.6 SILENT MOBILITY AND SIGNATURE REDUCTION TECHNOLOGIES
- 6.2.7 HYDROGEN FUEL CELLS
- 6.2.1 BATTERY SOURCES AND TYPES
- 6.3 IMPACT OF MEGATRENDS
- 6.3.1 AUTONOMOUS VEHICLES IN MILITARY
- 6.3.2 POLICIES SUPPORTING BATTERY AND HYDROGEN TECHNOLOGIES
- 6.4 SUPPLY CHAIN ANALYSIS
- 6.5 INNOVATIONS AND PATENT REGISTRATIONS
- 6.6 IMPACT OF AI
- 6.6.1 INTRODUCTION
- 6.6.2 IMPACT OF AI ON DEFENSE INDUSTRY
- 6.6.3 ADOPTION OF AI IN MILITARY BY TOP COUNTRIES
- 6.6.4 IMPACT OF AI ON MILITARY VEHICLE ELECTRIFICATION MARKET
7 IMPACT OF US 2025 TARIFF: OVERVIEW
- 7.1 INTRODUCTION
- 7.2 KEY TARIFF RATES
- 7.3 PRICE IMPACT ANALYSIS
- 7.4 IMPACT ON COUNTRY/REGION
- 7.4.1 US
- 7.4.2 EUROPE
- 7.4.2.1 Strategies of European Manufacturers
- 7.4.3 ASIA PACIFIC
- 7.4.3.1 Strategies of Asia Pacific Manufacturers
- 7.5 IMPACT ON END USERS
8 MILITARY VEHICLE ELECTRIFICATION MARKET, BY PLATFORM
- 8.1 INTRODUCTION
- 8.2 COMBAT VEHICLES
- 8.2.1 MAIN BATTLE TANKS
- 8.2.1.1 Operate effectively in wide range of terrains
- 8.2.2 INFANTRY FIGHTING VEHICLES
- 8.2.2.1 Ideal for hybrid-electric or fully electric upgrades
- 8.2.3 WEAPON SYSTEMS ARMORED PERSONNEL CARRIERS
- 8.2.3.1 Need for versatile and mobile combat platforms to drive growth
- 8.2.4 ARMORED AMPHIBIOUS VEHICLES
- 8.2.4.1 Rapid and efficient deployment of military capabilities from sea to shore to drive growth
- 8.2.5 MINE RESISTANT AMBUSH PROTECTED VEHICLES
- 8.2.5.1 Used to carry out patrol and combat operations
- 8.2.6 LIGHT ARMORED VEHICLES
- 8.2.6.1 Offer a strategic advantage in border patrolling
- 8.2.7 SELF-PROPELLED HOWITZERS
- 8.2.7.1 Strategically advantageous in modern warfare
- 8.2.8 MORTAR CARRIERS
- 8.2.8.1 Provide rapid and responsive artillery support to ground forces
- 8.2.9 AIR DEFENSE VEHICLES
- 8.2.9.1 Ability to respond dynamically to airborne threats to drive growth
- 8.2.1 MAIN BATTLE TANKS
- 8.3 SUPPORT VEHICLES
- 8.3.1 SUPPLY TRUCKS
- 8.3.1.1 Fuel trucks
- 8.3.1.1.1 Support diverse fleets of military vehicles
- 8.3.1.2 Ambulances
- 8.3.1.2.1 Offer rapid response, energy efficiency, and adaptability to various operational environments
- 8.3.1.3 Ammunition replenishment vehicles
- 8.3.1.3.1 Enhanced tactical flexibility to drive growth
- 8.3.1.1 Fuel trucks
- 8.3.2 COMMAND AND CONTROL VEHICLES
- 8.3.2.1 Network-centric warfare to drive growth
- 8.3.3 REPAIR AND RECOVERY VEHICLES
- 8.3.3.1 On-spot maintenance, recovery, and towing capabilities to drive growth
- 8.3.4 OTHER SUPPORT VEHICLES
- 8.3.1 SUPPLY TRUCKS
- 8.4 UNMANNED ARMORED VEHICLES
- 8.4.1 OFFER AUTONOMY AND VERSATILITY
9 MILITARY VEHICLE ELECTRIFICATION MARKET, BY MODE OF OPERATION
- 9.1 INTRODUCTION
- 9.2 MANNED VEHICLES
- 9.2.1 COST-EFFECTIVE ALTERNATIVE BY LEVERAGING EXISTING HUMAN EXPERTISE
- 9.3 AUTONOMOUS/SEMI-AUTONOMOUS
- 9.3.1 TO REVOLUTIONIZE MILITARY LOGISTICS, RECONNAISSANCE, AND SURVEILLANCE
10 MILITARY VEHICLE ELECTRIFICATION MARKET, BY SYSTEM
- 10.1 INTRODUCTION
- 10.2 POWER GENERATION SYSTEMS
- 10.2.1 ENGINES/GENERATORS
- 10.2.1.1 Facilitate rapid recharging of vehicle batteries
- 10.2.1.2 Use case: Generator system in Oshkosh's L-ATV Hybrid for mission-ready power redundancy
- 10.2.2 GENERATOR CONTROLLERS
- 10.2.2.1 Enable seamless transitions between electric-only, hybrid, and generator-powered modes
- 10.2.2.2 Use case: Generator controller in GM Defense eISV for real-time power coordination
- 10.2.3 AIR INDUCTION SYSTEMS
- 10.2.3.1 Contribute to improved combustion efficiency
- 10.2.3.2 Use case: Air induction system in BAE Systems' Hybrid Bradley for thermal efficiency and motor cooling
- 10.2.4 TRACTION MOTORS/PROPULSION MOTORS
- 10.2.4.1 Contribute to overall agility and maneuverability of military platforms
- 10.2.4.2 Use case: Traction motors in GM Defense eISV for lightweight, all-electric mobility
- 10.2.1 ENGINES/GENERATORS
- 10.3 COOLING SYSTEMS
- 10.3.1 HEAT EXCHANGERS
- 10.3.1.1 Dissipate excess heat generated during vehicle operation
- 10.3.2 FANS
- 10.3.2.1 Contribute to overall reliability and longevity of vehicle's electrical and electronic systems
- 10.3.1 HEAT EXCHANGERS
- 10.4 ENERGY STORAGE SYSTEMS
- 10.4.1 BATTERIES
- 10.4.1.1 Use case: Battery system in BAE Systems' Hybrid Bradley for silent and endurance operations
- 10.4.1.2 Lead-acid batteries
- 10.4.1.2.1 Lower upfront cost than alternative technologies
- 10.4.1.3 Nickel metal hydride batteries
- 10.4.1.3.1 Withstand demanding operational conditions
- 10.4.1.4 Lithium-ion batteries/Lithium-polymer batteries
- 10.4.1.4.1 Higher energy-to-weight ratio than lead-acid batteries
- 10.4.1.5 Solid-state batteries
- 10.4.1.5.1 Higher energy storage capacity within compact and lightweight form factors
- 10.4.1.6 Other batteries
- 10.4.2 FUEL CELLS
- 10.4.2.1 Offer extended operational ranges than batteries
- 10.4.2.2 Use case: Fuel cell system in GM Defense ZH2 for stealth and extended reconnaissance missions
- 10.4.1 BATTERIES
- 10.5 TRACTION DRIVE SYSTEMS
- 10.5.1 EX-DRIVE SYSTEMS
- 10.5.1.1 Allow for seamless integration with various power sources
- 10.5.1.2 Use case: E-X-Drive(R) electric drive system by RENK in tracked military vehicles for enhanced mobility and efficiency
- 10.5.2 TRACTION CONTROLLERS
- 10.5.2.1 Enable seamless transitions between various operating modes
- 10.5.2.2 Use case: Traction controller in GM Defense eISV for torque coordination and terrain adaptation
- 10.5.3 FINAL DRIVES
- 10.5.3.1 Modulate torque at wheel level
- 10.5.3.2 Use case: Final drive in BAE Systems' hybrid AMPV for load transmission and survivability
- 10.5.1 EX-DRIVE SYSTEMS
- 10.6 POWER CONVERSION SYSTEMS
- 10.6.1 DC-DC CONVERTERS
- 10.6.1.1 Increased applications in hybrid vehicles to drive growth
- 10.6.1.2 Use case: DC-DC converter in GM Defense's electric light reconnaissance vehicle
- 10.6.2 POWER INVERTERS
- 10.6.2.1 Seamless integration of renewable energy sources to drive growth
- 10.6.3 ON-BOARD CHARGERS (ALTERNATORS)
- 10.6.3.1 Energy conservation capabilities to drive growth
- 10.6.3.2 Use case: On-board charger in Oshkosh eJLTV for hybrid tactical operations
- 10.6.1 DC-DC CONVERTERS
- 10.7 TRANSMISSION SYSTEMS
- 10.7.1 PRODUCE DIFFERENT ROTATION RATIOS BETWEEN DRIVE MOTOR AND DRIVE WHEELS
- 10.7.1.1 Use case: Transmission system in General Dynamics' electric infantry carrier for tactical mobility
- 10.7.1 PRODUCE DIFFERENT ROTATION RATIOS BETWEEN DRIVE MOTOR AND DRIVE WHEELS
11 MILITARY VEHICLE ELECTRIFICATION MARKET, BY TECHNOLOGY
- 11.1 INTRODUCTION
- 11.2 HYBRID
- 11.2.1 COMPATIBLE WITH MODULAR UPGRADES, NETWORKED WARFARE, AND DECARBONIZATION MANDATES
- 11.3 FULLY ELECTRIC
- 11.3.1 OPERATES WITH ZERO ENGINE NOISE AND MINIMAL THERMAL SIGNATURE
12 MILITARY VEHICLE ELECTRIFICATION MARKET, BY VOLTAGE
- 12.1 INTRODUCTION
- 12.2 LOW VOLTAGE (LESS THAN 50 V)
- 12.2.1 DEMAND FOR COMPACTNESS AND AGILITY TO DRIVE GROWTH
- 12.3 MEDIUM VOLTAGE (50-600 V)
- 12.3.1 ALLOWS SEAMLESS INTEGRATION WITH DIFFERENT ELECTRONIC SYSTEMS
- 12.4 HIGH VOLTAGE (MORE THAN 600 V)
- 12.4.1 INCREASED POWER OUTPUT AND FASTER CHARGING TO DRIVE GROWTH
13 MILITARY VEHICLE ELECTRIFICATION MARKET, BY REGION
- 13.1 INTRODUCTION
- 13.2 NORTH AMERICA
- 13.2.1 PESTLE ANALYSIS
- 13.2.2 US
- 13.2.2.1 Electrification of all non-combat vehicles by 2035 to drive growth
- 13.2.3 CANADA
- 13.2.3.1 Military modernization programs to drive growth
- 13.3 EUROPE
- 13.3.1 PESTLE ANALYSIS
- 13.3.2 UK
- 13.3.2.1 Integration of electrically powered systems for land forces through Project Mercury to drive growth
- 13.3.3 FRANCE
- 13.3.3.1 Procurement of new-generation combat vehicles to drive growth
- 13.3.4 GERMANY
- 13.3.4.1 Presence of major military vehicle manufacturers to drive growth
- 13.3.5 ITALY
- 13.3.5.1 Defense Energy Strategy for enhanced energy efficiency to drive growth
- 13.3.6 REST OF EUROPE
- 13.4 ASIA PACIFIC
- 13.4.1 PESTLE ANALYSIS
- 13.4.2 INDIA
- 13.4.2.1 Inclusion of electric vehicles in military fleet to drive growth
- 13.4.3 JAPAN
- 13.4.3.1 R&D initiatives in partnership with US to drive growth
- 13.4.4 AUSTRALIA
- 13.4.4.1 Modernization of military vehicle fleet to drive growth
- 13.4.5 SOUTH KOREA
- 13.4.5.1 Investments in advanced battery technologies to drive market
- 13.5 MIDDLE EAST
- 13.5.1 PESTLE ANALYSIS
- 13.5.2 GULF COOPERATION COUNCIL (GCC)
- 13.5.2.1 Saudi Arabia
- 13.5.2.1.1 Procurement of new-generation armored vehicles to drive growth
- 13.5.2.1 Saudi Arabia
- 13.5.3 REST OF MIDDLE EAST
- 13.5.3.1 Israel
- 13.5.3.2 Turkey
- 13.6 REST OF THE WORLD
- 13.6.1 PESTLE ANALYSIS
- 13.7 LATIN AMERICA
- 13.7.1 BRAZIL
- 13.7.1.1 Modernization of armed forces to drive growth
- 13.7.2 MEXICO
- 13.7.2.1 Increased military budget to drive market
- 13.7.1 BRAZIL
- 13.8 AFRICA
- 13.8.1 SOUTH AFRICA
- 13.8.1.1 Weapon upgrades through Project African Warrior to drive growth
- 13.8.1 SOUTH AFRICA
14 COMPETITIVE LANDSCAPE
- 14.1 INTRODUCTION
- 14.2 STRATEGIES ADOPTED BY KEY PLAYERS
- 14.3 MARKET SHARE ANALYSIS, 2024
- 14.4 REVENUE ANALYSIS, 2021-2024
- 14.5 COMPANY EVALUATION MATRIX, 2024
- 14.5.1 STARS
- 14.5.2 EMERGING LEADERS
- 14.5.3 PERVASIVE PLAYERS
- 14.5.4 PARTICIPANTS
- 14.5.5 COMPANY FOOTPRINT
- 14.6 STARTUP/SME EVALUATION MATRIX, 2024
- 14.6.1 PROGRESSIVE COMPANIES
- 14.6.2 RESPONSIVE COMPANIES
- 14.6.3 DYNAMIC COMPANIES
- 14.6.4 STARTING BLOCKS
- 14.7 COMPANY VALUATION AND FINANCIAL METRICS
- 14.8 BRAND/PRODUCT COMPARISON
- 14.8.1 COMPETITIVE SCENARIO
- 14.8.1.1 Product launches
- 14.8.1.2 Deals
- 14.8.1.3 Others
- 14.8.1 COMPETITIVE SCENARIO
15 COMPANY PROFILES
- 15.1 KEY PLAYERS
- 15.1.1 OSHKOSH CORPORATION
- 15.1.1.1 Business overview
- 15.1.1.2 Products offered
- 15.1.1.3 Recent developments
- 15.1.1.4 MnM view
- 15.1.1.4.1 Right to win
- 15.1.1.4.2 Strategic choices
- 15.1.1.4.3 Weaknesses and competitive threats
- 15.1.2 GM DEFENSE, LLC
- 15.1.2.1 Business overview
- 15.1.2.2 Products offered
- 15.1.2.3 Recent developments
- 15.1.2.4 MnM view
- 15.1.2.4.1 Right to win
- 15.1.2.4.2 Strategic choices
- 15.1.2.4.3 Weaknesses and competitive threats
- 15.1.3 GENERAL DYNAMICS CORPORATION
- 15.1.3.1 Business overview
- 15.1.3.2 Products offered
- 15.1.3.3 Recent developments
- 15.1.3.4 MnM view
- 15.1.3.5 Right to win
- 15.1.3.5.1 Strategic choices
- 15.1.3.5.2 Weaknesses and competitive threats
- 15.1.4 BAE SYSTEMS
- 15.1.4.1 Business overview
- 15.1.4.2 Products offered
- 15.1.4.3 Recent developments
- 15.1.4.4 MnM view
- 15.1.4.4.1 Right to win
- 15.1.4.4.2 Strategic choices
- 15.1.4.4.3 Weaknesses and competitive threats
- 15.1.5 LEONARDO S.P.A.
- 15.1.5.1 Business overview
- 15.1.5.2 Products offered
- 15.1.5.3 Recent developments
- 15.1.5.4 MnM view
- 15.1.5.4.1 Right to win
- 15.1.5.4.2 Strategic choices
- 15.1.5.4.3 Weaknesses and competitive threats
- 15.1.6 TEXTRON INC.
- 15.1.6.1 Business overview
- 15.1.6.2 Products offered
- 15.1.6.3 Recent developments
- 15.1.7 ST ENGINEERING
- 15.1.7.1 Business overview
- 15.1.7.2 Products offered
- 15.1.7.3 Recent developments
- 15.1.8 QINETIQ
- 15.1.8.1 Business overview
- 15.1.8.2 Products offered
- 15.1.8.3 Recent developments
- 15.1.9 POLARIS INDUSTRIES INC.
- 15.1.9.1 Business overview
- 15.1.9.2 Products offered
- 15.1.9.3 Recent developments
- 15.1.10 ASELSAN A.S.
- 15.1.10.1 Business overview
- 15.1.10.2 Products offered
- 15.1.10.3 Recent developments
- 15.1.11 OTOKAR AUTOMOTIVE AND DEFENSE INDUSTRY INC.
- 15.1.11.1 Business overview
- 15.1.11.2 Products offered
- 15.1.12 RHEINMETALL AG
- 15.1.12.1 Business overview
- 15.1.12.2 Products offered
- 15.1.12.3 Recent developments
- 15.1.13 THALES
- 15.1.13.1 Business overview
- 15.1.13.2 Products offered
- 15.1.13.3 Recent developments
- 15.1.14 KNDS N.V.
- 15.1.14.1 Business overview
- 15.1.14.2 Products offered
- 15.1.14.3 Recent developments
- 15.1.15 FFG FLENSBURGER FAHRZEUGBAU GESELLSCHAFT MBH
- 15.1.15.1 Business overview
- 15.1.15.2 Products offered
- 15.1.1 OSHKOSH CORPORATION
- 15.2 OTHER PLAYERS
- 15.2.1 ARQUUS
- 15.2.2 EPSILOR ELECTRIC FUEL LTD.
- 15.2.3 UKROBORONPROM
- 15.2.4 MILREM ROBOTICS
- 15.2.5 AM GENERAL
- 15.2.6 HIGHLAND SYSTEMS
- 15.2.7 ALKE
- 15.2.8 MEGA ENGINEERING VEHICLES INC.
- 15.2.9 FNSS
16 APPENDIX
- 16.1 DISCUSSION GUIDE
- 16.2 KNOWLEDGESTORE: MARKETSANDMARKETS' SUBSCRIPTION PORTAL
- 16.3 CUSTOMIZATION OPTIONS
- 16.4 RELATED REPORTS
- 16.5 AUTHOR DETAILS

