
ヘッドアップディスプレイ(HUD)の世界市場:コンバイナーHUD、フロントガラスHUD、ウェアラブルHUD、AR HUD、従来式HUD、ディスプレイユニット、ビデオジェネレーター/プロセッシングユニット、プロジェクター/プロジェクションユニット - 予測(~2030年)
Head-up Display (HUD) Market by Combiner HUD, Windshield HUD, Wearable HUD, Augmented Reality (AR) HUD, Conventional HUD, Display Unit, Video Generator/Processing Unit, and Projector/ Projection Unit - Global Forecast to 2030
- 発行日
- ページ情報
- 英文 240 Pages
- 納期
-
即納可能
営業時間内にお支払方法などの確認が取れ次第、Eメールにて納品となります。営業時間: 9:00am - 6:00pm (土日祝除く)。

- 商品コード
- 1819095
- カスタマイズ可能 お客様のご希望に応じて、既存データの加工や未掲載情報(例:国別セグメント)の追加などの対応が可能です。詳細はお問い合わせください。
- 翻訳ツール提供対象 PDF対応AI翻訳ツールの無料貸し出しサービスのご利用が可能です
概要
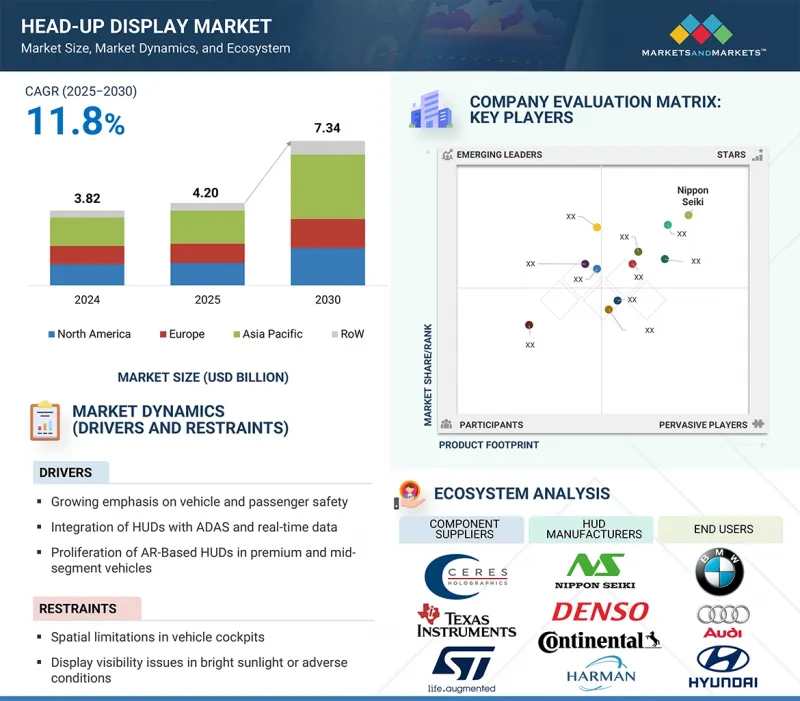
世界のヘッドアップディスプレイ(HUD)の市場規模は、2025年に42億米ドル、2030年までに73億4,000万米ドルに達すると予測され、2025年~2030年にCAGRで11.8%の成長が見込まれます。
| 調査範囲 | |
|---|---|
| 調査対象年 | 2021年~2030年 |
| 基準年 | 2024年 |
| 予測期間 | 2025年~2030年 |
| 単位 | 10億米ドル |
| セグメント | タイプ、コンポーネント、フォームファクター、エンドユーザー、地域 |
| 対象地域 | 北米、欧州、アジア太平洋、その他の地域 |
ヘッドアップディスプレイ(HUD)市場は、ドライバーの注意散漫を減らし、状況認識を向上させるADAS(先進運転支援システム)に対する需要の高まりによって牽引されています。AR機能とコネクテッド技術の統合が進むことで、ナビゲーションとリアルタイムの危険検知が強化されます。さらに、投影・表示技術の進歩に支えられた高級車と中級車へのHUDの採用が、世界市場の成長を促進しています。
「プロジェクター/投影装置セグメントが2024年に最大の市場シェアを占めました。」
プロジェクターは、フロントガラスやコンバイナーに画像や情報を投影するコアコンポーネントです。ディスプレイの鮮明度、明るさ、解像度を決定する中心的な役割を果たすため、従来式システムからARシステムに至るまで、あらゆるHUDタイプで不可欠なものとなっています。先進の運転支援機能や没入型ナビゲーションオーバーレイの需要が高まる中、投影装置は、多様な車両タイプに適合するよう、より高い輝度、より広い視野、コンパクトなフォームファクターで設計されています。レーザーベースやマイクロLED投影などの技術的進歩は、効率性、耐久性、視覚性能をさらに向上させ、自動車メーカーに好まれる促進要因となっています。すべてのHUDが主な機能要素として投影装置に依存していることから、高級車、中級車、電気自動車に広く統合され、2024年に市場の主要コンポーネントとしての地位を確保します。
「自動車セグメントが予測期間にヘッドアップディスプレイ(HUD)市場でもっとも高いCAGRを示す見込みです。」
自動車セグメントは、中級車や電気自動車を含むさまざまな自動車へのHUDの急速な統合により、2025年~2030年にもっとも高いCAGRを示すと予測されます。先進の安全性、リアルタイムナビゲーション、没入型の車内体験に対する消費者需要の高まりが、自動車メーカーがデジタルコックピット戦略の一環としてHUDの採用を優先することを後押ししています。AR HUDの展開が進み、小型でコスト効率の高い投影技術が進歩したことで、このシステムは高級車以外でも利用しやすくなっています。さらに、コネクテッドドライビングや自動運転に向けた世界的な推進が、HUDをさらに重要なヒューマンマシンインターフェースとし、この期間の自動車部門におけるHUDの高速な成長を確実なものにしています。
「インドが2025年~2030年に世界のヘッドアップディスプレイ(HUD)市場で最高のCAGRを示すと予測されます。」
インドは、アジア太平洋と世界のヘッドアップディスプレイ(HUD)市場で最高のCAGRを記録すると予測されています。同国の自動車部門は、乗用車と商用車の生産と売上の増加、電動モビリティへの緩やかなシフトに支えられ、力強い拡大を経験しています。可処分所得の増加、中間層人口の増加、高級車に対する消費者の強い選好が、HUDを含む先進の自動車技術の採用を後押ししています。さらに、交通安全を向上させ、ADASとコネクテッドモビリティソリューションの統合を促進する政府主導の取り組みが、自動車カテゴリ全体へのHUDシステムの展開を促進しています。技術に精通した若い消費者が多く、運転体験やナビゲーションの利便性向上への関心が高まっていることも、市場成長をさらに加速させています。このようにデマンドサイドと政策主導の要因が組み合わさることで、HUDはアジア太平洋と世界市場におけるHUD採用の重要な成長エンジンとなっています。
当レポートでは、世界のヘッドアップディスプレイ(HUD)市場について調査分析し、主な促進要因と抑制要因、競合情勢、将来の動向などの情報を提供しています。
目次
第1章 イントロダクション
第2章 調査手法
第3章 エグゼクティブサマリー
第4章 重要な知見
- ヘッドアップディスプレイ(HUD)市場における魅力的な機会
- ヘッドアップディスプレイ(HUD)市場:最終用途別
- ヘッドアップディスプレイ(HUD)市場:フォームファクター別
- ヘッドアップディスプレイ(HUD)市場:タイプ別
- ヘッドアップディスプレイ(HUD)市場:地域別
第5章 市場の概要
- イントロダクション
- 市場力学
- 促進要因
- 抑制要因
- 機会
- 課題
- バリューチェーン分析
- カスタマービジネスに影響を与える動向/混乱
- エコシステム分析
- 投資と資金調達のシナリオ
- 技術分析
- 主要技術
- 隣接技術
- 補完技術
- 価格設定の分析
- 自動車用HUDの平均販売価格:主要メーカー別(2024年)
- 自動車用HUDの平均販売価格:地域別(2024年)
- ケーススタディ分析
- 貿易分析
- 輸入シナリオ(HSコード8528)
- 輸出シナリオ(HSコード8528)
- 特許分析
- ポーターのファイブフォース分析
- 主なステークホルダーと購入基準
- 規制情勢
- 規制機関、政府機関、その他の組織
- 基準と規制
- 主な会議とイベント(2025年~2026年)
- ヘッドアップディスプレイ(HUD)市場に対するAI/生成AIの影響
- イントロダクション
- ヘッドアップディスプレイ(HUD)市場におけるAI/生成AIのユースケースと影響
- ヘッドアップディスプレイ(HUD)市場に対する2025年の米国関税の影響
- イントロダクション
- 主な関税率
- 価格の影響の分析
- 国/地域に対する影響
- 最終用途に対する影響
第6章 ヘッドアップディスプレイ(HUD)の技術
- イントロダクション
- デジタルHUD(LCD/LED/OLED)
- DLPベースHUD
- ウェーブガイドベースHUD
- レーザーベースHUD
第7章 ヘッドアップディスプレイ(HUD)の特徴
- イントロダクション
- 視野
- 解像度
- 輝度
- 精度
- コンバイナー透過率
第8章 ヘッドアップディスプレイ(HUD)市場:コンポーネント別
- イントロダクション
- ビデオジェネレーター/処理装置
- プロジェクター/投影装置
- 表示装置
- その他のコンポーネント
第9章 ヘッドアップディスプレイ(HUD)市場:タイプ別
- イントロダクション
- 従来式HUD
- AR HUD
第10章 ヘッドアップディスプレイ(HUD)市場:フォームファクター別
- イントロダクション
- フロントガラスHUD
- コンバイナーHUD
- ウェアラブルHUD
第11章 ヘッドアップディスプレイ(HUD)市場:最終用途別
- イントロダクション
- 航空
- 民間航空
- 軍用航空
- 自動車
- 中級車
- 高級車
- その他の用途
第12章 ヘッドアップディスプレイ(HUD)市場:地域別
- イントロダクション
- 北米
- 北米のマクロ経済の見通し
- 米国
- カナダ
- メキシコ
- 欧州
- 欧州のマクロ経済の見通し
- ドイツ
- 英国
- フランス
- イタリア
- スペイン
- ポーランド
- 北欧
- その他の欧州
- アジア太平洋
- アジア太平洋のマクロ経済の見通し
- 中国
- 日本
- 韓国
- インド
- オーストラリア
- インドネシア
- マレーシア
- タイ
- ベトナム
- その他のアジア太平洋
- その他の地域
- その他の地域のマクロ経済の見通し
- 中東
- アフリカ
- 南米
第13章 競合情勢
- 概要
- 主要参入企業の戦略/強み(2020年~2025年)
- 市場シェア分析(2024年)
- 収益分析(2020年~2024年)
- 企業の評価と財務指標
- 製品の比較
- 企業の評価マトリクス:主要企業(2024年)
- 企業の評価マトリクス:スタートアップ/中小企業(2024年)
- 競合シナリオ
第14章 企業プロファイル
- イントロダクション
- 主要企業
- NIPPON SEIKI CO., LTD.
- CONTINENTAL AG
- DENSO CORPORATION
- PANASONIC HOLDINGS CORPORATION
- VALEO
- HARMAN INTERNATIONAL
- E-LEAD ELECTRONICS CO., LTD
- BAE SYSTEMS
- YAZAKI CORPORATION
- GARMIN LTD.
- その他の企業
- THALES
- HONEYWELL INTERNATIONAL INC.
- CMC ELECTRONICS
- COLLINS AEROSPACE
- RENESAS ELECTRONICS CORPORATION
- STMICROELECTRONICS
- EXCELITAS TECHNOLOGIES CORP.
- ELBIT SYSTEMS LTD.
- VUZIX CORPORATION
- FORYOU CORPORATION
- HUDWAY, LLC
- WAYRAY AG
- ENVISICS
- TEXAS INSTRUMENTS INCORPORATED
- SAMTEL AVIONICS
第15章 付録
- 発行日
- 発行
- MarketsandMarkets
- ページ情報
- 英文 240 Pages
- 納期
- 即納可能


