|
|
市場調査レポート
商品コード
1768279
GaaS(Gaming As A Service)の世界市場規模、シェア、業界分析レポート:最終用途別、プラットフォーム別、収益モデル別、ゲームタイプ別、地域別、展望と予測、2025年~2032年Global Gaming As A Service Market Size, Share & Industry Analysis Report By End Use, By Platform, By Revenue Model, By Game Type, By Regional Outlook and Forecast, 2025 - 2032 |
||||||
|
|||||||
|
|||||||

| GaaS(Gaming As A Service)の世界市場規模、シェア、業界分析レポート:最終用途別、プラットフォーム別、収益モデル別、ゲームタイプ別、地域別、展望と予測、2025年~2032年 |
|
出版日: 2025年06月09日
発行: KBV Research
ページ情報: 英文 360 Pages
納期: 即納可能
|

全表示
- 概要
- 図表
- 目次
世界のGaaS(Gaming As A Service)の市場規模は、予測期間中に24.4%のCAGRで市場成長し、2032年までに223億1,000万米ドルに達すると予想されています。
さらに、クロスプラットフォームゲーミングは市場拡大の重要な推進力として浮上しています。ゲーマーは、PC、ゲーム機、スマートフォン、タブレットなど、異なるデバイス間でシームレスな体験を求めるようになっています。GaaSプラットフォームは、ユーザーが1つのデバイスでゲームを開始し、進行状況を失うことなく別のデバイスでゲームを続けることができるようにすることで、このトレンドを活用しています。このクロスデバイス互換性は、利便性を高め、包括性を促進し、ユーザーエンゲージメントを深めます。したがって、クロスプラットフォームゲーミングの台頭とデバイス非依存は、アクセシビリティを向上させ、プレイヤーコミュニティを強化し、GaaS(Gaming As A Service)市場の力強い成長を促進する触媒として機能します。
しかし、市場が直面する最も差し迫った課題の一つは、サービスプロバイダーがクラウドベースのゲームプラットフォームを構築・運用するために、多額の初期投資が必要となることです。従来のゲームモデルとは異なり、GaaSは、強力なGPUを備えたデータセンター、スケーラブルなサーバー、高帯域幅のネットワークシステムなど、大規模なインフラを必要とします。これらのコンポーネントには、少数の大手テクノロジー企業しか負担できない多額の資金投資が必要です。そのため、少数の大手企業による市場支配は市場のダイナミズムを阻害し、GaaS業界における独占傾向を生み出し、消費者の選択と価格競合に悪影響を及ぼす可能性があります。
バリューチェーン分析
GaaS(Gaming As A Service)のバリューチェーンは、魅力的なコンテンツを作成するゲーム開発から始まります。次に、クラウドインフラストラクチャのプロビジョニングが続き、世界アクセスのためのスケーラブルなサーバーリソースを確保します。ゲームストリーミングとプラットフォームの有効化により、ユーザーはデバイスを問わずオンデマンドでゲームをプレイできます。一方、サブスクリプション管理と収益化により、課金とユーザーアクセスを管理します。
シームレスな体験を提供するために、CDNとレイテンシー最適化によって遅延を最小限に抑えます。UI/UX最適化によってプレイヤーのインタラクションが洗練され、カスタマーサポートとコミュニティエンゲージメントによってロイヤルティが促進されます。セキュリティとコンプライアンスによってデータとプラットフォームの整合性が確保され、分析とフィードバックループによって将来の開発が策定され、継続的な改善によってバリューチェーンが完結します。
最終用途の展望
最終用途に基づいて、市場は個人向けと商業向けに分類されます。商業セグメントは2024年に市場の18%の収益シェアを獲得しました。このセグメントには、ゲーミングラウンジ、カフェ、eスポーツアリーナ、その他顧客にゲーミングサービスを提供するエンターテイメント施設が含まれます。競技ゲーミングや組織化されたeスポーツイベントの増加に伴い、GaaS(Gaming As A Service)の商業利用が勢いを増しています。これらの施設は、クラウドゲーミングプラットフォームを活用することでインフラコストを削減し、ハードウェアに多額の投資をすることなく、複数のユーザーにシームレスで高品質なゲーミング体験を提供しています。
プラットフォームの展望
プラットフォーム別に見ると、市場はスマートフォン・タブレット、PC・ノートパソコン、ゲーム機に分類されます。PC・ノートパソコンセグメントは、2024年に市場収益シェアの36%を獲得しました。このプラットフォームは、その汎用性、高性能、そして幅広いゲームジャンルへの対応により、忠実なユーザーベースを獲得し続けています。PCやノートパソコン向けのGaaS(Gaming As A Service)は、カスタマイズ可能な設定、高解像度グラフィックス、競争力の高いゲーム環境へのアクセスといった高度な機能を提供しています。クラウドゲームは、ハードウェアのアップグレードの必要性を軽減し、ユーザーがリソースを大量に消費するゲームを簡単にストリーミングできるようにすることで、このプラットフォームの魅力をさらに高めています。
収益モデルの展望
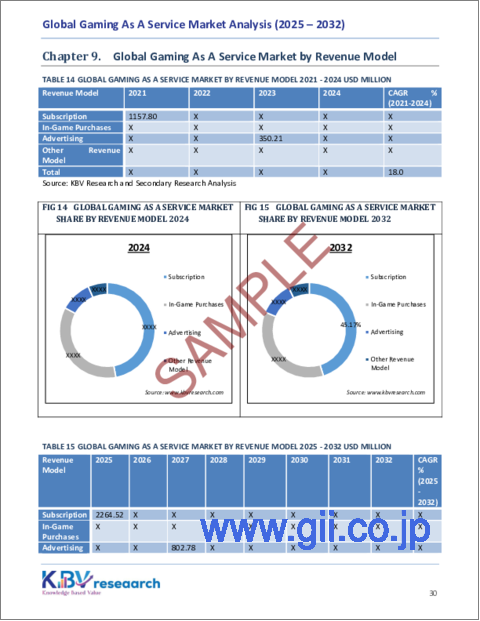
収益モデルに基づいて、市場はサブスクリプション、ゲーム内購入、広告、その他に分類されます。ゲーム内購入セグメントは、2024年に市場の36%の収益シェアを記録しました。このモデルは、プレイヤーがスキン、武器、キャラクター、進行ブーストなどの仮想アイテムを購入できるマイクロトランザクションを通じて収益を生み出します。これは、ユーザーが無料でゲームにアクセスし、より高度な体験のために購入を選択できる、無料プレイゲームの構造を支えています。この収益源は、プレイヤーのエンゲージメントとパーソナライゼーションによって成長し、最初のダウンロード後も長期間にわたる継続的な収益化パスを提供します。
ゲームタイプの展望
ゲームタイプに基づいて、市場はアクション、ロールプレイング、スポーツ、アドベンチャー、シミュレーション、ストラテジーなどに分類されます。ロールプレイングセグメントは、2024年に市場の19%の収益シェアを獲得しました。ロールプレイングゲーム(RPG)では、プレイヤーは架空の舞台でキャラクターの役割を演じることができ、複雑な物語やキャラクターの成長システムを備えていることがよくあります。このセグメントは、ストーリーテリングの奥深さとカスタマイズ機能により、高いユーザーエンゲージメントを得ています。クラウドプラットフォーム上でMMORPG(大規模多人数同時参加型オンラインロールプレイングゲーム)が利用可能になったことで、永続的で進化し続けるゲーム世界を求めるより幅広いユーザー層への訴求力も高まっています。
地域の展望
地域別に見ると、市場は北米、欧州、アジア太平洋、ラテンアメリカ、中東・アフリカにまたがって分析されています。アジア太平洋は、2024年に市場収益の45%を占めました。この成長は、中国、インド、日本、韓国などの国々における大規模かつ急速なゲーム人口の拡大、スマートフォン普及率の向上、そして強力なインターネット接続によって牽引されています。この地域では、モバイルゲームの導入とクラウドゲームインフラの開発が急増しています。デジタルイノベーションに対する政府の支援と、急成長するeスポーツエコシステムの発展も、この地域におけるGaaS(Gaming As A Service)への高い需要に貢献しています。
目次
第1章 市場範囲と調査手法
- 市場の定義
- 目的
- 市場範囲
- セグメンテーション
- 調査手法
第2章 市場要覧
- 主要なハイライト
第3章 市場概要
- イントロダクション
- 概要
- 市場構成とシナリオ
- 概要
- 市場に影響を与える主な要因
- 市場促進要因
- 市場抑制要因
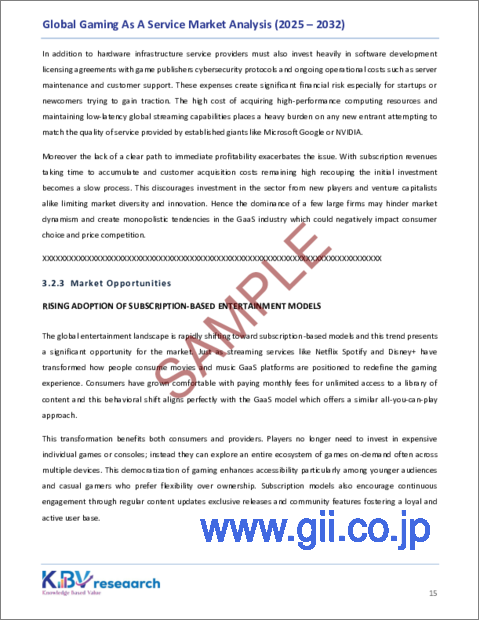
- 市場機会
- 市場の課題
第4章 GaaS(Gaming As A Service)市場のバリューチェーン分析
- ゲーム開発
- クラウドインフラストラクチャのプロビジョニング
- ゲームストリーミングとプラットフォームの有効化
- サブスクリプション管理と収益化
- コンテンツ配信ネットワーク(CDN)とレイテンシ最適化
- UI/UX最適化
- カスタマーサポートとコミュニティエンゲージメント
- セキュリティとコンプライアンス
- 分析とフィードバックループ
第5章 主要顧客基準:GaaS(Gaming As A Service)市場
- 低レイテンシとパフォーマンス
- ゲームライブラリの多様性と品質
- サブスクリプション費用/価格モデル
- クロスプラットフォームの互換性
- インターネット帯域幅の要件
- ユーザーインターフェースとエクスペリエンス(UI/UX)
- ゲームの保存と同期機能
- 定期的なアップデートと新しいコンテンツ
- 顧客サポートの品質
- コミュニティとソーシャル機能
第6章 競合分析-世界
- 市場シェア分析、2024年
- GaaS(Gaming As A Service)市場における最近の戦略
- ポーターファイブフォース分析
第7章 世界のGaaS(Gaming As A Service)市場:最終用途別
- 世界の個人市場:地域別
- 世界の商業市場:地域別
第8章 世界のGaaS(Gaming As A Service)市場:プラットフォーム別
- 世界のスマートフォン・タブレット市場:地域別
- 世界のPC・ラップトップ市場:地域別
- 世界のゲーム機市場:地域別
第9章 世界のGaaS(Gaming As A Service)市場:収益モデル別
- 世界サブスクリプション市場:地域別
- 世界のゲーム内購入市場:地域別
- 世界の広告市場:地域別
- 世界のその他の収益モデル市場:地域別
第10章 世界のGaaS(Gaming As A Service)市場:ゲームタイプ別
- 世界のアクションマーケット:地域別
- 世界のロールプレイング市場:地域別
- 世界のスポーツ市場:地域別
- 世界のアドベンチャーマーケット:地域別
- 世界のシミュレーション市場:地域別
- 世界の戦略市場:地域別
- 世界のその他のゲームタイプ市場:地域別
第11章 世界のGaaS(Gaming As A Service)市場:地域別
- 北米
- 北米の市場:国別
- 米国
- カナダ
- メキシコ
- その他北米地域
- 北米の市場:国別
- 欧州
- 欧州の市場:国別
- ドイツ
- 英国
- フランス
- ロシア
- スペイン
- イタリア
- その他欧州地域
- 欧州の市場:国別
- アジア太平洋
- アジア太平洋の市場:国別
- 中国
- 日本
- インド
- 韓国
- シンガポール
- マレーシア
- その他アジア太平洋
- アジア太平洋の市場:国別
- ラテンアメリカ、中東・アフリカ
- ラテンアメリカ、中東・アフリカの市場:国別
- ブラジル
- アルゼンチン
- アラブ首長国連邦
- サウジアラビア
- 南アフリカ
- ナイジェリア
- その他ラテンアメリカ、中東・アフリカ地域
- ラテンアメリカ、中東・アフリカの市場:国別
第12章 企業プロファイル
- Microsoft Corporation
- Tencent Holdings Ltd
- Electronic Arts, Inc
- Nintendo Co, Ltd.
- Amazoncom, Inc.(Amazon Luna)
- Apple, Inc(Apple TV)
- Sony Corporation
- Google LLC
- NEXON Co, Ltd.
- NetEase, Inc
第13章 GaaS(Gaming As A Service)市場の成功必須条件
LIST OF TABLES
- TABLE 1 Global Gaming As A Service Market, 2021 - 2024, USD Million
- TABLE 2 Global Gaming As A Service Market, 2025 - 2032, USD Million
- TABLE 3 Key Customer Criteria: Gaming As A Service Market
- TABLE 4 Global Gaming As A Service Market by End Use, 2021 - 2024, USD Million
- TABLE 5 Global Gaming As A Service Market by End Use, 2025 - 2032, USD Million
- TABLE 6 Global Individual Market by Region, 2021 - 2024, USD Million
- TABLE 7 Global Individual Market by Region, 2025 - 2032, USD Million
- TABLE 8 Global Commercial Market by Region, 2021 - 2024, USD Million
- TABLE 9 Global Commercial Market by Region, 2025 - 2032, USD Million
- TABLE 10 Comparison of Key Attributes - Gaming As A Service Market
- TABLE 11 Global Gaming As A Service Market by Platform, 2021 - 2024, USD Million
- TABLE 12 Global Gaming As A Service Market by Platform, 2025 - 2032, USD Million
- TABLE 13 Global Smartphones & Tablets Market by Region, 2021 - 2024, USD Million
- TABLE 14 Global Smartphones & Tablets Market by Region, 2025 - 2032, USD Million
- TABLE 15 Global PCs & Laptops Market by Region, 2021 - 2024, USD Million
- TABLE 16 Global PCs & Laptops Market by Region, 2025 - 2032, USD Million
- TABLE 17 Global Gaming Consoles Market by Region, 2021 - 2024, USD Million
- TABLE 18 Global Gaming Consoles Market by Region, 2025 - 2032, USD Million
- TABLE 19 Comparison of Key Attributes - Gaming As A Service Market
- TABLE 20 Global Gaming As A Service Market by Revenue Model, 2021 - 2024, USD Million
- TABLE 21 Global Gaming As A Service Market by Revenue Model, 2025 - 2032, USD Million
- TABLE 22 Global Subscription Market by Region, 2021 - 2024, USD Million
- TABLE 23 Global Subscription Market by Region, 2025 - 2032, USD Million
- TABLE 24 Global In-Game Purchases Market by Region, 2021 - 2024, USD Million
- TABLE 25 Global In-Game Purchases Market by Region, 2025 - 2032, USD Million
- TABLE 26 Global Advertising Market by Region, 2021 - 2024, USD Million
- TABLE 27 Global Advertising Market by Region, 2025 - 2032, USD Million
- TABLE 28 Global Other Revenue Model Market by Region, 2021 - 2024, USD Million
- TABLE 29 Global Other Revenue Model Market by Region, 2025 - 2032, USD Million
- TABLE 30 Comparison of Key Attributes - Gaming As A Service Market
- TABLE 31 Global Gaming As A Service Market by Game Type, 2021 - 2024, USD Million
- TABLE 32 Global Gaming As A Service Market by Game Type, 2025 - 2032, USD Million
- TABLE 33 Global Action Market by Region, 2021 - 2024, USD Million
- TABLE 34 Global Action Market by Region, 2025 - 2032, USD Million
- TABLE 35 Global Role-Playing Market by Region, 2021 - 2024, USD Million
- TABLE 36 Global Role-Playing Market by Region, 2025 - 2032, USD Million
- TABLE 37 Global Sports Market by Region, 2021 - 2024, USD Million
- TABLE 38 Global Sports Market by Region, 2025 - 2032, USD Million
- TABLE 39 Global Adventure Market by Region, 2021 - 2024, USD Million
- TABLE 40 Global Adventure Market by Region, 2025 - 2032, USD Million
- TABLE 41 Global Simulation Market by Region, 2021 - 2024, USD Million
- TABLE 42 Global Simulation Market by Region, 2025 - 2032, USD Million
- TABLE 43 Global Strategy Market by Region, 2021 - 2024, USD Million
- TABLE 44 Global Strategy Market by Region, 2025 - 2032, USD Million
- TABLE 45 Global Other Game Type Market by Region, 2021 - 2024, USD Million
- TABLE 46 Global Other Game Type Market by Region, 2025 - 2032, USD Million
- TABLE 47 Comparison of Key Attributes - Gaming As A Service Market
- TABLE 48 Global Gaming As A Service Market by Region, 2021 - 2024, USD Million
- TABLE 49 Global Gaming As A Service Market by Region, 2025 - 2032, USD Million
- TABLE 50 North America Gaming As A Service Market, 2021 - 2024, USD Million
- TABLE 51 North America Gaming As A Service Market, 2025 - 2032, USD Million
- TABLE 52 North America Gaming As A Service Market by End Use, 2021 - 2024, USD Million
- TABLE 53 North America Gaming As A Service Market by End Use, 2025 - 2032, USD Million
- TABLE 54 North America Individual Market by Region, 2021 - 2024, USD Million
- TABLE 55 North America Individual Market by Region, 2025 - 2032, USD Million
- TABLE 56 North America Commercial Market by Region, 2021 - 2024, USD Million
- TABLE 57 North America Commercial Market by Region, 2025 - 2032, USD Million
- TABLE 58 North America Gaming As A Service Market by Platform, 2021 - 2024, USD Million
- TABLE 59 North America Gaming As A Service Market by Platform, 2025 - 2032, USD Million
- TABLE 60 North America Smartphones & Tablets Market by Country, 2021 - 2024, USD Million
- TABLE 61 North America Smartphones & Tablets Market by Country, 2025 - 2032, USD Million
- TABLE 62 North America PCs & Laptops Market by Country, 2021 - 2024, USD Million
- TABLE 63 North America PCs & Laptops Market by Country, 2025 - 2032, USD Million
- TABLE 64 North America Gaming Consoles Market by Country, 2021 - 2024, USD Million
- TABLE 65 North America Gaming Consoles Market by Country, 2025 - 2032, USD Million
- TABLE 66 North America Gaming As A Service Market by Revenue Model, 2021 - 2024, USD Million
- TABLE 67 North America Gaming As A Service Market by Revenue Model, 2025 - 2032, USD Million
- TABLE 68 North America Subscription Market by Country, 2021 - 2024, USD Million
- TABLE 69 North America Subscription Market by Country, 2025 - 2032, USD Million
- TABLE 70 North America In-Game Purchases Market by Country, 2021 - 2024, USD Million
- TABLE 71 North America In-Game Purchases Market by Country, 2025 - 2032, USD Million
- TABLE 72 North America Advertising Market by Country, 2021 - 2024, USD Million
- TABLE 73 North America Advertising Market by Country, 2025 - 2032, USD Million
- TABLE 74 North America Other Revenue Model Market by Country, 2021 - 2024, USD Million
- TABLE 75 North America Other Revenue Model Market by Country, 2025 - 2032, USD Million
- TABLE 76 North America Gaming As A Service Market by Game Type, 2021 - 2024, USD Million
- TABLE 77 North America Gaming As A Service Market by Game Type, 2025 - 2032, USD Million
- TABLE 78 North America Action Market by Country, 2021 - 2024, USD Million
- TABLE 79 North America Action Market by Country, 2025 - 2032, USD Million
- TABLE 80 North America Role-Playing Market by Country, 2021 - 2024, USD Million
- TABLE 81 North America Role-Playing Market by Country, 2025 - 2032, USD Million
- TABLE 82 North America Sports Market by Country, 2021 - 2024, USD Million
- TABLE 83 North America Sports Market by Country, 2025 - 2032, USD Million
- TABLE 84 North America Adventure Market by Country, 2021 - 2024, USD Million
- TABLE 85 North America Adventure Market by Country, 2025 - 2032, USD Million
- TABLE 86 North America Simulation Market by Country, 2021 - 2024, USD Million
- TABLE 87 North America Simulation Market by Country, 2025 - 2032, USD Million
- TABLE 88 North America Strategy Market by Country, 2021 - 2024, USD Million
- TABLE 89 North America Strategy Market by Country, 2025 - 2032, USD Million
- TABLE 90 North America Other Game Type Market by Country, 2021 - 2024, USD Million
- TABLE 91 North America Other Game Type Market by Country, 2025 - 2032, USD Million
- TABLE 92 North America Gaming As A Service Market by Country, 2021 - 2024, USD Million
- TABLE 93 North America Gaming As A Service Market by Country, 2025 - 2032, USD Million
- TABLE 94 US Gaming As A Service Market, 2021 - 2024, USD Million
- TABLE 95 US Gaming As A Service Market, 2025 - 2032, USD Million
- TABLE 96 US Gaming As A Service Market by End Use, 2021 - 2024, USD Million
- TABLE 97 US Gaming As A Service Market by End Use, 2025 - 2032, USD Million
- TABLE 98 US Gaming As A Service Market by Platform, 2021 - 2024, USD Million
- TABLE 99 US Gaming As A Service Market by Platform, 2025 - 2032, USD Million
- TABLE 100 US Gaming As A Service Market by Revenue Model, 2021 - 2024, USD Million
- TABLE 101 US Gaming As A Service Market by Revenue Model, 2025 - 2032, USD Million
- TABLE 102 US Gaming As A Service Market by Game Type, 2021 - 2024, USD Million
- TABLE 103 US Gaming As A Service Market by Game Type, 2025 - 2032, USD Million
- TABLE 104 Canada Gaming As A Service Market, 2021 - 2024, USD Million
- TABLE 105 Canada Gaming As A Service Market, 2025 - 2032, USD Million
- TABLE 106 Canada Gaming As A Service Market by End Use, 2021 - 2024, USD Million
- TABLE 107 Canada Gaming As A Service Market by End Use, 2025 - 2032, USD Million
- TABLE 108 Canada Gaming As A Service Market by Platform, 2021 - 2024, USD Million
- TABLE 109 Canada Gaming As A Service Market by Platform, 2025 - 2032, USD Million
- TABLE 110 Canada Gaming As A Service Market by Revenue Model, 2021 - 2024, USD Million
- TABLE 111 Canada Gaming As A Service Market by Revenue Model, 2025 - 2032, USD Million
- TABLE 112 Canada Gaming As A Service Market by Game Type, 2021 - 2024, USD Million
- TABLE 113 Canada Gaming As A Service Market by Game Type, 2025 - 2032, USD Million
- TABLE 114 Mexico Gaming As A Service Market, 2021 - 2024, USD Million
- TABLE 115 Mexico Gaming As A Service Market, 2025 - 2032, USD Million
- TABLE 116 Mexico Gaming As A Service Market by End Use, 2021 - 2024, USD Million
- TABLE 117 Mexico Gaming As A Service Market by End Use, 2025 - 2032, USD Million
- TABLE 118 Mexico Gaming As A Service Market by Platform, 2021 - 2024, USD Million
- TABLE 119 Mexico Gaming As A Service Market by Platform, 2025 - 2032, USD Million
- TABLE 120 Mexico Gaming As A Service Market by Revenue Model, 2021 - 2024, USD Million
- TABLE 121 Mexico Gaming As A Service Market by Revenue Model, 2025 - 2032, USD Million
- TABLE 122 Mexico Gaming As A Service Market by Game Type, 2021 - 2024, USD Million
- TABLE 123 Mexico Gaming As A Service Market by Game Type, 2025 - 2032, USD Million
- TABLE 124 Rest of North America Gaming As A Service Market, 2021 - 2024, USD Million
- TABLE 125 Rest of North America Gaming As A Service Market, 2025 - 2032, USD Million
- TABLE 126 Rest of North America Gaming As A Service Market by End Use, 2021 - 2024, USD Million
- TABLE 127 Rest of North America Gaming As A Service Market by End Use, 2025 - 2032, USD Million
- TABLE 128 Rest of North America Gaming As A Service Market by Platform, 2021 - 2024, USD Million
- TABLE 129 Rest of North America Gaming As A Service Market by Platform, 2025 - 2032, USD Million
- TABLE 130 Rest of North America Gaming As A Service Market by Revenue Model, 2021 - 2024, USD Million
- TABLE 131 Rest of North America Gaming As A Service Market by Revenue Model, 2025 - 2032, USD Million
- TABLE 132 Rest of North America Gaming As A Service Market by Game Type, 2021 - 2024, USD Million
- TABLE 133 Rest of North America Gaming As A Service Market by Game Type, 2025 - 2032, USD Million
- TABLE 134 Europe Gaming As A Service Market, 2021 - 2024, USD Million
- TABLE 135 Europe Gaming As A Service Market, 2025 - 2032, USD Million
- TABLE 136 Europe Gaming As A Service Market by End Use, 2021 - 2024, USD Million
- TABLE 137 Europe Gaming As A Service Market by End Use, 2025 - 2032, USD Million
- TABLE 138 Europe Individual Market by Country, 2021 - 2024, USD Million
- TABLE 139 Europe Individual Market by Country, 2025 - 2032, USD Million
- TABLE 140 Europe Commercial Market by Country, 2021 - 2024, USD Million
- TABLE 141 Europe Commercial Market by Country, 2025 - 2032, USD Million
- TABLE 142 Europe Gaming As A Service Market by Platform, 2021 - 2024, USD Million
- TABLE 143 Europe Gaming As A Service Market by Platform, 2025 - 2032, USD Million
- TABLE 144 Europe Smartphones & Tablets Market by Country, 2021 - 2024, USD Million
- TABLE 145 Europe Smartphones & Tablets Market by Country, 2025 - 2032, USD Million
- TABLE 146 Europe PCs & Laptops Market by Country, 2021 - 2024, USD Million
- TABLE 147 Europe PCs & Laptops Market by Country, 2025 - 2032, USD Million
- TABLE 148 Europe Gaming Consoles Market by Country, 2021 - 2024, USD Million
- TABLE 149 Europe Gaming Consoles Market by Country, 2025 - 2032, USD Million
- TABLE 150 Europe Gaming As A Service Market by Revenue Model, 2021 - 2024, USD Million
- TABLE 151 Europe Gaming As A Service Market by Revenue Model, 2025 - 2032, USD Million
- TABLE 152 Europe Subscription Market by Country, 2021 - 2024, USD Million
- TABLE 153 Europe Subscription Market by Country, 2025 - 2032, USD Million
- TABLE 154 Europe In-Game Purchases Market by Country, 2021 - 2024, USD Million
- TABLE 155 Europe In-Game Purchases Market by Country, 2025 - 2032, USD Million
- TABLE 156 Europe Advertising Market by Country, 2021 - 2024, USD Million
- TABLE 157 Europe Advertising Market by Country, 2025 - 2032, USD Million
- TABLE 158 Europe Other Revenue Model Market by Country, 2021 - 2024, USD Million
- TABLE 159 Europe Other Revenue Model Market by Country, 2025 - 2032, USD Million
- TABLE 160 Europe Gaming As A Service Market by Game Type, 2021 - 2024, USD Million
- TABLE 161 Europe Gaming As A Service Market by Game Type, 2025 - 2032, USD Million
- TABLE 162 Europe Action Market by Country, 2021 - 2024, USD Million
- TABLE 163 Europe Action Market by Country, 2025 - 2032, USD Million
- TABLE 164 Europe Role-Playing Market by Country, 2021 - 2024, USD Million
- TABLE 165 Europe Role-Playing Market by Country, 2025 - 2032, USD Million
- TABLE 166 Europe Sports Market by Country, 2021 - 2024, USD Million
- TABLE 167 Europe Sports Market by Country, 2025 - 2032, USD Million
- TABLE 168 Europe Adventure Market by Country, 2021 - 2024, USD Million
- TABLE 169 Europe Adventure Market by Country, 2025 - 2032, USD Million
- TABLE 170 Europe Simulation Market by Country, 2021 - 2024, USD Million
- TABLE 171 Europe Simulation Market by Country, 2025 - 2032, USD Million
- TABLE 172 Europe Strategy Market by Country, 2021 - 2024, USD Million
- TABLE 173 Europe Strategy Market by Country, 2025 - 2032, USD Million
- TABLE 174 Europe Other Game Type Market by Country, 2021 - 2024, USD Million
- TABLE 175 Europe Other Game Type Market by Country, 2025 - 2032, USD Million
- TABLE 176 Europe Gaming As A Service Market by Country, 2021 - 2024, USD Million
- TABLE 177 Europe Gaming As A Service Market by Country, 2025 - 2032, USD Million
- TABLE 178 Germany Gaming As A Service Market, 2021 - 2024, USD Million
- TABLE 179 Germany Gaming As A Service Market, 2025 - 2032, USD Million
- TABLE 180 Germany Gaming As A Service Market by End Use, 2021 - 2024, USD Million
- TABLE 181 Germany Gaming As A Service Market by End Use, 2025 - 2032, USD Million
- TABLE 182 Germany Gaming As A Service Market by Platform, 2021 - 2024, USD Million
- TABLE 183 Germany Gaming As A Service Market by Platform, 2025 - 2032, USD Million
- TABLE 184 Germany Gaming As A Service Market by Revenue Model, 2021 - 2024, USD Million
- TABLE 185 Germany Gaming As A Service Market by Revenue Model, 2025 - 2032, USD Million
- TABLE 186 Germany Gaming As A Service Market by Game Type, 2021 - 2024, USD Million
- TABLE 187 Germany Gaming As A Service Market by Game Type, 2025 - 2032, USD Million
- TABLE 188 UK Gaming As A Service Market, 2021 - 2024, USD Million
- TABLE 189 UK Gaming As A Service Market, 2025 - 2032, USD Million
- TABLE 190 UK Gaming As A Service Market by End Use, 2021 - 2024, USD Million
- TABLE 191 UK Gaming As A Service Market by End Use, 2025 - 2032, USD Million
- TABLE 192 UK Gaming As A Service Market by Platform, 2021 - 2024, USD Million
- TABLE 193 UK Gaming As A Service Market by Platform, 2025 - 2032, USD Million
- TABLE 194 UK Gaming As A Service Market by Revenue Model, 2021 - 2024, USD Million
- TABLE 195 UK Gaming As A Service Market by Revenue Model, 2025 - 2032, USD Million
- TABLE 196 UK Gaming As A Service Market by Game Type, 2021 - 2024, USD Million
- TABLE 197 UK Gaming As A Service Market by Game Type, 2025 - 2032, USD Million
- TABLE 198 France Gaming As A Service Market, 2021 - 2024, USD Million
- TABLE 199 France Gaming As A Service Market, 2025 - 2032, USD Million
- TABLE 200 France Gaming As A Service Market by End Use, 2021 - 2024, USD Million
- TABLE 201 France Gaming As A Service Market by End Use, 2025 - 2032, USD Million
- TABLE 202 France Gaming As A Service Market by Platform, 2021 - 2024, USD Million
- TABLE 203 France Gaming As A Service Market by Platform, 2025 - 2032, USD Million
- TABLE 204 France Gaming As A Service Market by Revenue Model, 2021 - 2024, USD Million
- TABLE 205 France Gaming As A Service Market by Revenue Model, 2025 - 2032, USD Million
- TABLE 206 France Gaming As A Service Market by Game Type, 2021 - 2024, USD Million
- TABLE 207 France Gaming As A Service Market by Game Type, 2025 - 2032, USD Million
- TABLE 208 Russia Gaming As A Service Market, 2021 - 2024, USD Million
- TABLE 209 Russia Gaming As A Service Market, 2025 - 2032, USD Million
- TABLE 210 Russia Gaming As A Service Market by End Use, 2021 - 2024, USD Million
- TABLE 211 Russia Gaming As A Service Market by End Use, 2025 - 2032, USD Million
- TABLE 212 Russia Gaming As A Service Market by Platform, 2021 - 2024, USD Million
- TABLE 213 Russia Gaming As A Service Market by Platform, 2025 - 2032, USD Million
- TABLE 214 Russia Gaming As A Service Market by Revenue Model, 2021 - 2024, USD Million
- TABLE 215 Russia Gaming As A Service Market by Revenue Model, 2025 - 2032, USD Million
- TABLE 216 Russia Gaming As A Service Market by Game Type, 2021 - 2024, USD Million
- TABLE 217 Russia Gaming As A Service Market by Game Type, 2025 - 2032, USD Million
- TABLE 218 Spain Gaming As A Service Market, 2021 - 2024, USD Million
- TABLE 219 Spain Gaming As A Service Market, 2025 - 2032, USD Million
- TABLE 220 Spain Gaming As A Service Market by End Use, 2021 - 2024, USD Million
- TABLE 221 Spain Gaming As A Service Market by End Use, 2025 - 2032, USD Million
- TABLE 222 Spain Gaming As A Service Market by Platform, 2021 - 2024, USD Million
- TABLE 223 Spain Gaming As A Service Market by Platform, 2025 - 2032, USD Million
- TABLE 224 Spain Gaming As A Service Market by Revenue Model, 2021 - 2024, USD Million
- TABLE 225 Spain Gaming As A Service Market by Revenue Model, 2025 - 2032, USD Million
- TABLE 226 Spain Gaming As A Service Market by Game Type, 2021 - 2024, USD Million
- TABLE 227 Spain Gaming As A Service Market by Game Type, 2025 - 2032, USD Million
- TABLE 228 Italy Gaming As A Service Market, 2021 - 2024, USD Million
- TABLE 229 Italy Gaming As A Service Market, 2025 - 2032, USD Million
- TABLE 230 Italy Gaming As A Service Market by End Use, 2021 - 2024, USD Million
- TABLE 231 Italy Gaming As A Service Market by End Use, 2025 - 2032, USD Million
- TABLE 232 Italy Gaming As A Service Market by Platform, 2021 - 2024, USD Million
- TABLE 233 Italy Gaming As A Service Market by Platform, 2025 - 2032, USD Million
- TABLE 234 Italy Gaming As A Service Market by Revenue Model, 2021 - 2024, USD Million
- TABLE 235 Italy Gaming As A Service Market by Revenue Model, 2025 - 2032, USD Million
- TABLE 236 Italy Gaming As A Service Market by Game Type, 2021 - 2024, USD Million
- TABLE 237 Italy Gaming As A Service Market by Game Type, 2025 - 2032, USD Million
- TABLE 238 Rest of Europe Gaming As A Service Market, 2021 - 2024, USD Million
- TABLE 239 Rest of Europe Gaming As A Service Market, 2025 - 2032, USD Million
- TABLE 240 Rest of Europe Gaming As A Service Market by End Use, 2021 - 2024, USD Million
- TABLE 241 Rest of Europe Gaming As A Service Market by End Use, 2025 - 2032, USD Million
- TABLE 242 Rest of Europe Gaming As A Service Market by Platform, 2021 - 2024, USD Million
- TABLE 243 Rest of Europe Gaming As A Service Market by Platform, 2025 - 2032, USD Million
- TABLE 244 Rest of Europe Gaming As A Service Market by Revenue Model, 2021 - 2024, USD Million
- TABLE 245 Rest of Europe Gaming As A Service Market by Revenue Model, 2025 - 2032, USD Million
- TABLE 246 Rest of Europe Gaming As A Service Market by Game Type, 2021 - 2024, USD Million
- TABLE 247 Rest of Europe Gaming As A Service Market by Game Type, 2025 - 2032, USD Million
- TABLE 248 Asia Pacific Gaming As A Service Market, 2021 - 2024, USD Million
- TABLE 249 Asia Pacific Gaming As A Service Market, 2025 - 2032, USD Million
- TABLE 250 Asia Pacific Gaming As A Service Market by End Use, 2021 - 2024, USD Million
- TABLE 251 Asia Pacific Gaming As A Service Market by End Use, 2025 - 2032, USD Million
- TABLE 252 Asia Pacific Individual Market by Country, 2021 - 2024, USD Million
- TABLE 253 Asia Pacific Individual Market by Country, 2025 - 2032, USD Million
- TABLE 254 Asia Pacific Commercial Market by Country, 2021 - 2024, USD Million
- TABLE 255 Asia Pacific Commercial Market by Country, 2025 - 2032, USD Million
- TABLE 256 Asia Pacific Gaming As A Service Market by Platform, 2021 - 2024, USD Million
- TABLE 257 Asia Pacific Gaming As A Service Market by Platform, 2025 - 2032, USD Million
- TABLE 258 Asia Pacific Smartphones & Tablets Market by Country, 2021 - 2024, USD Million
- TABLE 259 Asia Pacific Smartphones & Tablets Market by Country, 2025 - 2032, USD Million
- TABLE 260 Asia Pacific PCs & Laptops Market by Country, 2021 - 2024, USD Million
- TABLE 261 Asia Pacific PCs & Laptops Market by Country, 2025 - 2032, USD Million
- TABLE 262 Asia Pacific Gaming Consoles Market by Country, 2021 - 2024, USD Million
- TABLE 263 Asia Pacific Gaming Consoles Market by Country, 2025 - 2032, USD Million
- TABLE 264 Asia Pacific Gaming As A Service Market by Revenue Model, 2021 - 2024, USD Million
- TABLE 265 Asia Pacific Gaming As A Service Market by Revenue Model, 2025 - 2032, USD Million
- TABLE 266 Asia Pacific Subscription Market by Country, 2021 - 2024, USD Million
- TABLE 267 Asia Pacific Subscription Market by Country, 2025 - 2032, USD Million
- TABLE 268 Asia Pacific In-Game Purchases Market by Country, 2021 - 2024, USD Million
- TABLE 269 Asia Pacific In-Game Purchases Market by Country, 2025 - 2032, USD Million
- TABLE 270 Asia Pacific Advertising Market by Country, 2021 - 2024, USD Million
- TABLE 271 Asia Pacific Advertising Market by Country, 2025 - 2032, USD Million
- TABLE 272 Asia Pacific Other Revenue Model Market by Country, 2021 - 2024, USD Million
- TABLE 273 Asia Pacific Other Revenue Model Market by Country, 2025 - 2032, USD Million
- TABLE 274 Asia Pacific Gaming As A Service Market by Game Type, 2021 - 2024, USD Million
- TABLE 275 Asia Pacific Gaming As A Service Market by Game Type, 2025 - 2032, USD Million
- TABLE 276 Asia Pacific Action Market by Country, 2021 - 2024, USD Million
- TABLE 277 Asia Pacific Action Market by Country, 2025 - 2032, USD Million
- TABLE 278 Asia Pacific Role-Playing Market by Country, 2021 - 2024, USD Million
- TABLE 279 Asia Pacific Role-Playing Market by Country, 2025 - 2032, USD Million
- TABLE 280 Asia Pacific Sports Market by Country, 2021 - 2024, USD Million
- TABLE 281 Asia Pacific Sports Market by Country, 2025 - 2032, USD Million
- TABLE 282 Asia Pacific Adventure Market by Country, 2021 - 2024, USD Million
- TABLE 283 Asia Pacific Adventure Market by Country, 2025 - 2032, USD Million
- TABLE 284 Asia Pacific Simulation Market by Country, 2021 - 2024, USD Million
- TABLE 285 Asia Pacific Simulation Market by Country, 2025 - 2032, USD Million
- TABLE 286 Asia Pacific Strategy Market by Country, 2021 - 2024, USD Million
- TABLE 287 Asia Pacific Strategy Market by Country, 2025 - 2032, USD Million
- TABLE 288 Asia Pacific Other Game Type Market by Country, 2021 - 2024, USD Million
- TABLE 289 Asia Pacific Other Game Type Market by Country, 2025 - 2032, USD Million
- TABLE 290 Asia Pacific Gaming As A Service Market by Country, 2021 - 2024, USD Million
- TABLE 291 Asia Pacific Gaming As A Service Market by Country, 2025 - 2032, USD Million
- TABLE 292 China Gaming As A Service Market, 2021 - 2024, USD Million
- TABLE 293 China Gaming As A Service Market, 2025 - 2032, USD Million
- TABLE 294 China Gaming As A Service Market by End Use, 2021 - 2024, USD Million
- TABLE 295 China Gaming As A Service Market by End Use, 2025 - 2032, USD Million
- TABLE 296 China Gaming As A Service Market by Platform, 2021 - 2024, USD Million
- TABLE 297 China Gaming As A Service Market by Platform, 2025 - 2032, USD Million
- TABLE 298 China Gaming As A Service Market by Revenue Model, 2021 - 2024, USD Million
- TABLE 299 China Gaming As A Service Market by Revenue Model, 2025 - 2032, USD Million
- TABLE 300 China Gaming As A Service Market by Game Type, 2021 - 2024, USD Million
- TABLE 301 China Gaming As A Service Market by Game Type, 2025 - 2032, USD Million
- TABLE 302 Japan Gaming As A Service Market, 2021 - 2024, USD Million
- TABLE 303 Japan Gaming As A Service Market, 2025 - 2032, USD Million
- TABLE 304 Japan Gaming As A Service Market by End Use, 2021 - 2024, USD Million
- TABLE 305 Japan Gaming As A Service Market by End Use, 2025 - 2032, USD Million
- TABLE 306 Japan Gaming As A Service Market by Platform, 2021 - 2024, USD Million
- TABLE 307 Japan Gaming As A Service Market by Platform, 2025 - 2032, USD Million
- TABLE 308 Japan Gaming As A Service Market by Revenue Model, 2021 - 2024, USD Million
- TABLE 309 Japan Gaming As A Service Market by Revenue Model, 2025 - 2032, USD Million
- TABLE 310 Japan Gaming As A Service Market by Game Type, 2021 - 2024, USD Million
- TABLE 311 Japan Gaming As A Service Market by Game Type, 2025 - 2032, USD Million
- TABLE 312 India Gaming As A Service Market, 2021 - 2024, USD Million
- TABLE 313 India Gaming As A Service Market, 2025 - 2032, USD Million
- TABLE 314 India Gaming As A Service Market by End Use, 2021 - 2024, USD Million
- TABLE 315 India Gaming As A Service Market by End Use, 2025 - 2032, USD Million
- TABLE 316 India Gaming As A Service Market by Platform, 2021 - 2024, USD Million
- TABLE 317 India Gaming As A Service Market by Platform, 2025 - 2032, USD Million
- TABLE 318 India Gaming As A Service Market by Revenue Model, 2021 - 2024, USD Million
- TABLE 319 India Gaming As A Service Market by Revenue Model, 2025 - 2032, USD Million
- TABLE 320 India Gaming As A Service Market by Game Type, 2021 - 2024, USD Million
- TABLE 321 India Gaming As A Service Market by Game Type, 2025 - 2032, USD Million
- TABLE 322 South Korea Gaming As A Service Market, 2021 - 2024, USD Million
- TABLE 323 South Korea Gaming As A Service Market, 2025 - 2032, USD Million
- TABLE 324 South Korea Gaming As A Service Market by End Use, 2021 - 2024, USD Million
- TABLE 325 South Korea Gaming As A Service Market by End Use, 2025 - 2032, USD Million
- TABLE 326 South Korea Gaming As A Service Market by Platform, 2021 - 2024, USD Million
- TABLE 327 South Korea Gaming As A Service Market by Platform, 2025 - 2032, USD Million
- TABLE 328 South Korea Gaming As A Service Market by Revenue Model, 2021 - 2024, USD Million
- TABLE 329 South Korea Gaming As A Service Market by Revenue Model, 2025 - 2032, USD Million
- TABLE 330 South Korea Gaming As A Service Market by Game Type, 2021 - 2024, USD Million
- TABLE 331 South Korea Gaming As A Service Market by Game Type, 2025 - 2032, USD Million
- TABLE 332 Singapore Gaming As A Service Market, 2021 - 2024, USD Million
- TABLE 333 Singapore Gaming As A Service Market, 2025 - 2032, USD Million
- TABLE 334 Singapore Gaming As A Service Market by End Use, 2021 - 2024, USD Million
- TABLE 335 Singapore Gaming As A Service Market by End Use, 2025 - 2032, USD Million
- TABLE 336 Singapore Gaming As A Service Market by Platform, 2021 - 2024, USD Million
- TABLE 337 Singapore Gaming As A Service Market by Platform, 2025 - 2032, USD Million
- TABLE 338 Singapore Gaming As A Service Market by Revenue Model, 2021 - 2024, USD Million
- TABLE 339 Singapore Gaming As A Service Market by Revenue Model, 2025 - 2032, USD Million
- TABLE 340 Singapore Gaming As A Service Market by Game Type, 2021 - 2024, USD Million
- TABLE 341 Singapore Gaming As A Service Market by Game Type, 2025 - 2032, USD Million
- TABLE 342 Malaysia Gaming As A Service Market, 2021 - 2024, USD Million
- TABLE 343 Malaysia Gaming As A Service Market, 2025 - 2032, USD Million
- TABLE 344 Malaysia Gaming As A Service Market by End Use, 2021 - 2024, USD Million
- TABLE 345 Malaysia Gaming As A Service Market by End Use, 2025 - 2032, USD Million
- TABLE 346 Malaysia Gaming As A Service Market by Platform, 2021 - 2024, USD Million
- TABLE 347 Malaysia Gaming As A Service Market by Platform, 2025 - 2032, USD Million
- TABLE 348 Malaysia Gaming As A Service Market by Revenue Model, 2021 - 2024, USD Million
- TABLE 349 Malaysia Gaming As A Service Market by Revenue Model, 2025 - 2032, USD Million
- TABLE 350 Malaysia Gaming As A Service Market by Game Type, 2021 - 2024, USD Million
- TABLE 351 Malaysia Gaming As A Service Market by Game Type, 2025 - 2032, USD Million
- TABLE 352 Rest of Asia Pacific Gaming As A Service Market, 2021 - 2024, USD Million
- TABLE 353 Rest of Asia Pacific Gaming As A Service Market, 2025 - 2032, USD Million
- TABLE 354 Rest of Asia Pacific Gaming As A Service Market by End Use, 2021 - 2024, USD Million
- TABLE 355 Rest of Asia Pacific Gaming As A Service Market by End Use, 2025 - 2032, USD Million
- TABLE 356 Rest of Asia Pacific Gaming As A Service Market by Platform, 2021 - 2024, USD Million
- TABLE 357 Rest of Asia Pacific Gaming As A Service Market by Platform, 2025 - 2032, USD Million
- TABLE 358 Rest of Asia Pacific Gaming As A Service Market by Revenue Model, 2021 - 2024, USD Million
- TABLE 359 Rest of Asia Pacific Gaming As A Service Market by Revenue Model, 2025 - 2032, USD Million
- TABLE 360 Rest of Asia Pacific Gaming As A Service Market by Game Type, 2021 - 2024, USD Million
- TABLE 361 Rest of Asia Pacific Gaming As A Service Market by Game Type, 2025 - 2032, USD Million
- TABLE 362 LAMEA Gaming As A Service Market, 2021 - 2024, USD Million
- TABLE 363 LAMEA Gaming As A Service Market, 2025 - 2032, USD Million
- TABLE 364 LAMEA Gaming As A Service Market by End Use, 2021 - 2024, USD Million
- TABLE 365 LAMEA Gaming As A Service Market by End Use, 2025 - 2032, USD Million
- TABLE 366 LAMEA Individual Market by Country, 2021 - 2024, USD Million
- TABLE 367 LAMEA Individual Market by Country, 2025 - 2032, USD Million
- TABLE 368 LAMEA Commercial Market by Country, 2021 - 2024, USD Million
- TABLE 369 LAMEA Commercial Market by Country, 2025 - 2032, USD Million
- TABLE 370 LAMEA Gaming As A Service Market by Platform, 2021 - 2024, USD Million
- TABLE 371 LAMEA Gaming As A Service Market by Platform, 2025 - 2032, USD Million
- TABLE 372 LAMEA Smartphones & Tablets Market by Country, 2021 - 2024, USD Million
- TABLE 373 LAMEA Smartphones & Tablets Market by Country, 2025 - 2032, USD Million
- TABLE 374 LAMEA PCs & Laptops Market by Country, 2021 - 2024, USD Million
- TABLE 375 LAMEA PCs & Laptops Market by Country, 2025 - 2032, USD Million
- TABLE 376 LAMEA Gaming Consoles Market by Country, 2021 - 2024, USD Million
- TABLE 377 LAMEA Gaming Consoles Market by Country, 2025 - 2032, USD Million
- TABLE 378 LAMEA Gaming As A Service Market by Revenue Model, 2021 - 2024, USD Million
- TABLE 379 LAMEA Gaming As A Service Market by Revenue Model, 2025 - 2032, USD Million
- TABLE 380 LAMEA Subscription Market by Country, 2021 - 2024, USD Million
- TABLE 381 LAMEA Subscription Market by Country, 2025 - 2032, USD Million
- TABLE 382 LAMEA In-Game Purchases Market by Country, 2021 - 2024, USD Million
- TABLE 383 LAMEA In-Game Purchases Market by Country, 2025 - 2032, USD Million
- TABLE 384 LAMEA Advertising Market by Country, 2021 - 2024, USD Million
- TABLE 385 LAMEA Advertising Market by Country, 2025 - 2032, USD Million
- TABLE 386 LAMEA Other Revenue Model Market by Country, 2021 - 2024, USD Million
- TABLE 387 LAMEA Other Revenue Model Market by Country, 2025 - 2032, USD Million
- TABLE 388 LAMEA Gaming As A Service Market by Game Type, 2021 - 2024, USD Million
- TABLE 389 LAMEA Gaming As A Service Market by Game Type, 2025 - 2032, USD Million
- TABLE 390 LAMEA Action Market by Country, 2021 - 2024, USD Million
- TABLE 391 LAMEA Action Market by Country, 2025 - 2032, USD Million
- TABLE 392 LAMEA Role-Playing Market by Country, 2021 - 2024, USD Million
- TABLE 393 LAMEA Role-Playing Market by Country, 2025 - 2032, USD Million
- TABLE 394 LAMEA Sports Market by Country, 2021 - 2024, USD Million
- TABLE 395 LAMEA Sports Market by Country, 2025 - 2032, USD Million
- TABLE 396 LAMEA Adventure Market by Country, 2021 - 2024, USD Million
- TABLE 397 LAMEA Adventure Market by Country, 2025 - 2032, USD Million
- TABLE 398 LAMEA Simulation Market by Country, 2021 - 2024, USD Million
- TABLE 399 LAMEA Simulation Market by Country, 2025 - 2032, USD Million
- TABLE 400 LAMEA Strategy Market by Country, 2021 - 2024, USD Million
- TABLE 401 LAMEA Strategy Market by Country, 2025 - 2032, USD Million
- TABLE 402 LAMEA Other Game Type Market by Country, 2021 - 2024, USD Million
- TABLE 403 LAMEA Other Game Type Market by Country, 2025 - 2032, USD Million
- TABLE 404 LAMEA Gaming As A Service Market by Country, 2021 - 2024, USD Million
- TABLE 405 LAMEA Gaming As A Service Market by Country, 2025 - 2032, USD Million
- TABLE 406 Brazil Gaming As A Service Market, 2021 - 2024, USD Million
- TABLE 407 Brazil Gaming As A Service Market, 2025 - 2032, USD Million
- TABLE 408 Brazil Gaming As A Service Market by End Use, 2021 - 2024, USD Million
- TABLE 409 Brazil Gaming As A Service Market by End Use, 2025 - 2032, USD Million
- TABLE 410 Brazil Gaming As A Service Market by Platform, 2021 - 2024, USD Million
- TABLE 411 Brazil Gaming As A Service Market by Platform, 2025 - 2032, USD Million
- TABLE 412 Brazil Gaming As A Service Market by Revenue Model, 2021 - 2024, USD Million
- TABLE 413 Brazil Gaming As A Service Market by Revenue Model, 2025 - 2032, USD Million
- TABLE 414 Brazil Gaming As A Service Market by Game Type, 2021 - 2024, USD Million
- TABLE 415 Brazil Gaming As A Service Market by Game Type, 2025 - 2032, USD Million
- TABLE 416 Argentina Gaming As A Service Market, 2021 - 2024, USD Million
- TABLE 417 Argentina Gaming As A Service Market, 2025 - 2032, USD Million
- TABLE 418 Argentina Gaming As A Service Market by End Use, 2021 - 2024, USD Million
- TABLE 419 Argentina Gaming As A Service Market by End Use, 2025 - 2032, USD Million
- TABLE 420 Argentina Gaming As A Service Market by Platform, 2021 - 2024, USD Million
- TABLE 421 Argentina Gaming As A Service Market by Platform, 2025 - 2032, USD Million
- TABLE 422 Argentina Gaming As A Service Market by Revenue Model, 2021 - 2024, USD Million
- TABLE 423 Argentina Gaming As A Service Market by Revenue Model, 2025 - 2032, USD Million
- TABLE 424 Argentina Gaming As A Service Market by Game Type, 2021 - 2024, USD Million
- TABLE 425 Argentina Gaming As A Service Market by Game Type, 2025 - 2032, USD Million
- TABLE 426 UAE Gaming As A Service Market, 2021 - 2024, USD Million
- TABLE 427 UAE Gaming As A Service Market, 2025 - 2032, USD Million
- TABLE 428 UAE Gaming As A Service Market by End Use, 2021 - 2024, USD Million
- TABLE 429 UAE Gaming As A Service Market by End Use, 2025 - 2032, USD Million
- TABLE 430 UAE Gaming As A Service Market by Platform, 2021 - 2024, USD Million
- TABLE 431 UAE Gaming As A Service Market by Platform, 2025 - 2032, USD Million
- TABLE 432 UAE Gaming As A Service Market by Revenue Model, 2021 - 2024, USD Million
- TABLE 433 UAE Gaming As A Service Market by Revenue Model, 2025 - 2032, USD Million
- TABLE 434 UAE Gaming As A Service Market by Game Type, 2021 - 2024, USD Million
- TABLE 435 UAE Gaming As A Service Market by Game Type, 2025 - 2032, USD Million
- TABLE 436 Saudi Arabia Gaming As A Service Market, 2021 - 2024, USD Million
- TABLE 437 Saudi Arabia Gaming As A Service Market, 2025 - 2032, USD Million
- TABLE 438 Saudi Arabia Gaming As A Service Market by End Use, 2021 - 2024, USD Million
- TABLE 439 Saudi Arabia Gaming As A Service Market by End Use, 2025 - 2032, USD Million
- TABLE 440 Saudi Arabia Gaming As A Service Market by Platform, 2021 - 2024, USD Million
- TABLE 441 Saudi Arabia Gaming As A Service Market by Platform, 2025 - 2032, USD Million
- TABLE 442 Saudi Arabia Gaming As A Service Market by Revenue Model, 2021 - 2024, USD Million
- TABLE 443 Saudi Arabia Gaming As A Service Market by Revenue Model, 2025 - 2032, USD Million
- TABLE 444 Saudi Arabia Gaming As A Service Market by Game Type, 2021 - 2024, USD Million
- TABLE 445 Saudi Arabia Gaming As A Service Market by Game Type, 2025 - 2032, USD Million
- TABLE 446 South Africa Gaming As A Service Market, 2021 - 2024, USD Million
- TABLE 447 South Africa Gaming As A Service Market, 2025 - 2032, USD Million
- TABLE 448 South Africa Gaming As A Service Market by End Use, 2021 - 2024, USD Million
- TABLE 449 South Africa Gaming As A Service Market by End Use, 2025 - 2032, USD Million
- TABLE 450 South Africa Gaming As A Service Market by Platform, 2021 - 2024, USD Million
- TABLE 451 South Africa Gaming As A Service Market by Platform, 2025 - 2032, USD Million
- TABLE 452 South Africa Gaming As A Service Market by Revenue Model, 2021 - 2024, USD Million
- TABLE 453 South Africa Gaming As A Service Market by Revenue Model, 2025 - 2032, USD Million
- TABLE 454 South Africa Gaming As A Service Market by Game Type, 2021 - 2024, USD Million
- TABLE 455 South Africa Gaming As A Service Market by Game Type, 2025 - 2032, USD Million
- TABLE 456 Nigeria Gaming As A Service Market, 2021 - 2024, USD Million
- TABLE 457 Nigeria Gaming As A Service Market, 2025 - 2032, USD Million
- TABLE 458 Nigeria Gaming As A Service Market by End Use, 2021 - 2024, USD Million
- TABLE 459 Nigeria Gaming As A Service Market by End Use, 2025 - 2032, USD Million
- TABLE 460 Nigeria Gaming As A Service Market by Platform, 2021 - 2024, USD Million
- TABLE 461 Nigeria Gaming As A Service Market by Platform, 2025 - 2032, USD Million
- TABLE 462 Nigeria Gaming As A Service Market by Revenue Model, 2021 - 2024, USD Million
- TABLE 463 Nigeria Gaming As A Service Market by Revenue Model, 2025 - 2032, USD Million
- TABLE 464 Nigeria Gaming As A Service Market by Game Type, 2021 - 2024, USD Million
- TABLE 465 Nigeria Gaming As A Service Market by Game Type, 2025 - 2032, USD Million
- TABLE 466 Rest of LAMEA Gaming As A Service Market, 2021 - 2024, USD Million
- TABLE 467 Rest of LAMEA Gaming As A Service Market, 2025 - 2032, USD Million
- TABLE 468 Rest of LAMEA Gaming As A Service Market by End Use, 2021 - 2024, USD Million
- TABLE 469 Rest of LAMEA Gaming As A Service Market by End Use, 2025 - 2032, USD Million
- TABLE 470 Rest of LAMEA Gaming As A Service Market by Platform, 2021 - 2024, USD Million
- TABLE 471 Rest of LAMEA Gaming As A Service Market by Platform, 2025 - 2032, USD Million
- TABLE 472 Rest of LAMEA Gaming As A Service Market by Revenue Model, 2021 - 2024, USD Million
- TABLE 473 Rest of LAMEA Gaming As A Service Market by Revenue Model, 2025 - 2032, USD Million
- TABLE 474 Rest of LAMEA Gaming As A Service Market by Game Type, 2021 - 2024, USD Million
- TABLE 475 Rest of LAMEA Gaming As A Service Market by Game Type, 2025 - 2032, USD Million
- TABLE 476 Key Information - Microsoft Corporation
- TABLE 477 Key Information - Tencent Holdings Ltd.
- TABLE 478 Key information - Electronic Arts, Inc.
- TABLE 479 key information - Nintendo Co., Ltd.
- TABLE 480 Key Information - Amazon.com, Inc.
- TABLE 481 Key Information - Apple, Inc.
- TABLE 482 Key Information - Sony Corporation
- TABLE 483 Key Information - Google LLC
- TABLE 484 Key Information - NEXON Co., Ltd.
- TABLE 485 key information - NetEase, Inc.
LIST OF FIGURES
- FIG 1 Methodology for the research
- FIG 2 Global Gaming As A Service Market, 2021 - 2032, USD Million
- FIG 3 Key Factors Impacting Gaming As A Service Market
- FIG 4 Value Chain Analysis of Gaming As A Service Market
- FIG 5 Key Customer Criteria: Gaming As A Service Market
- FIG 6 Market Share Analysis, 2024
- FIG 7 Porter's Five Forces Analysis - Gaming As A Service Market
- FIG 8 Global Gaming As A Service Market share by End Use, 2024
- FIG 9 Global Gaming As A Service Market share by End Use, 2032
- FIG 10 Global Gaming As A Service Market by End Use, 2021 - 2032, USD Million
- FIG 11 Global Gaming As A Service Market share by Platform, 2024
- FIG 12 Global Gaming As A Service Market share by Platform, 2032
- FIG 13 Global Gaming As A Service Market by Platform, 2021 - 2032, USD Million
- FIG 14 Global Gaming As A Service Market share by Revenue Model, 2024
- FIG 15 Global Gaming As A Service Market share by Revenue Model, 2032
- FIG 16 Global Gaming As A Service Market by Revenue Model, 2021 - 2032, USD Million
- FIG 17 Global Gaming As A Service Market share by Game Type, 2024
- FIG 18 Global Gaming As A Service Market share by Game Type, 2032
- FIG 19 Global Gaming As A Service Market by Game Type, 2021 - 2032, USD Million
- FIG 20 Global Gaming As A Service Market share by Region, 2024
- FIG 21 Global Gaming As A Service Market share by Region, 2032
- FIG 22 Global Gaming As A Service Market by Region, 2021 - 2032, USD Million
- FIG 23 North America Gaming As A Service Market, 2021 - 2032, USD Million
- FIG 24 North America Gaming As A Service Market share by End Use, 2024
- FIG 25 North America Gaming As A Service Market share by End Use, 2032
- FIG 26 North America Gaming As A Service Market by End Use, 2021 - 2032, USD Million
- FIG 27 North America Gaming As A Service Market share by Platform, 2024
- FIG 28 North America Gaming As A Service Market share by Platform, 2032
- FIG 29 North America Gaming As A Service Market by Platform, 2021 - 2032, USD Million
- FIG 30 North America Gaming As A Service Market share by Revenue Model, 2024
- FIG 31 North America Gaming As A Service Market share by Revenue Model, 2032
- FIG 32 North America Gaming As A Service Market by Revenue Model, 2021 - 2032, USD Million
- FIG 33 North America Gaming As A Service Market share by Game Type, 2024
- FIG 34 North America Gaming As A Service Market share by Game Type, 2032
- FIG 35 North America Gaming As A Service Market by Game Type, 2021 - 2032, USD Million
- FIG 36 North America Gaming As A Service Market share by Country, 2024
- FIG 37 North America Gaming As A Service Market share by Country, 2032
- FIG 38 North America Gaming As A Service Market by Country, 2021 - 2032, USD Million
- FIG 39 Europe Gaming As A Service Market, 2021 - 2032, USD Million
- FIG 40 Europe Gaming As A Service Market share by End Use, 2024
- FIG 41 Europe Gaming As A Service Market share by End Use, 2032
- FIG 42 Europe Gaming As A Service Market by End Use, 2021 - 2032, USD Million
- FIG 43 Europe Gaming As A Service Market share by Platform, 2024
- FIG 44 Europe Gaming As A Service Market share by Platform, 2032
- FIG 45 Europe Gaming As A Service Market by Platform, 2021 - 2032, USD Million
- FIG 46 Europe Gaming As A Service Market share by Revenue Model, 2024
- FIG 47 Europe Gaming As A Service Market share by Revenue Model, 2032
- FIG 48 Europe Gaming As A Service Market by Revenue Model, 2021 - 2032, USD Million
- FIG 49 Europe Gaming As A Service Market share by Game Type, 2024
- FIG 50 Europe Gaming As A Service Market share by Game Type, 2032
- FIG 51 Europe Gaming As A Service Market by Game Type, 2021 - 2032, USD Million
- FIG 52 Europe Gaming As A Service Market share by Country, 2024
- FIG 53 Europe Gaming As A Service Market share by Country, 2032
- FIG 54 Europe Gaming As A Service Market by Country, 2021 - 2032, USD Million
- FIG 55 Asia Pacific Gaming As A Service Market, 2021 - 2032, USD Million
- FIG 56 Asia Pacific Gaming As A Service Market share by End Use, 2024
- FIG 57 Asia Pacific Gaming As A Service Market share by End Use, 2032
- FIG 58 Asia Pacific Gaming As A Service Market by End Use, 2021 - 2032, USD Million
- FIG 59 Asia Pacific Gaming As A Service Market share by Platform, 2024
- FIG 60 Asia Pacific Gaming As A Service Market share by Platform, 2032
- FIG 61 Asia Pacific Gaming As A Service Market by Platform, 2021 - 2032, USD Million
- FIG 62 Asia Pacific Gaming As A Service Market share by Revenue Model, 2024
- FIG 63 Asia Pacific Gaming As A Service Market share by Revenue Model, 2032
- FIG 64 Asia Pacific Gaming As A Service Market by Revenue Model, 2021 - 2032, USD Million
- FIG 65 Asia Pacific Gaming As A Service Market share by Game Type, 2024
- FIG 66 Asia Pacific Gaming As A Service Market share by Game Type 2032
- FIG 67 Asia Pacific Gaming As A Service Market by Game Type, 2021 - 2032, USD Million
- FIG 68 Asia Pacific Gaming As A Service Market share by Country, 2024
- FIG 69 Asia Pacific Gaming As A Service Market share by Country, 2032
- FIG 70 Asia Pacific Gaming As A Service Market by Country, 2021 - 2032, USD Million
- FIG 71 LAMEA Gaming As A Service Market, 2021 - 2032, USD Million
- FIG 72 LAMEA Gaming As A Service Market share by End Use, 2024
- FIG 73 LAMEA Gaming As A Service Market share by End Use, 2032
- FIG 74 LAMEA Gaming As A Service Market by End Use, 2021 - 2032, USD Million
- FIG 75 LAMEA Gaming As A Service Market share by Platform, 2024
- FIG 76 LAMEA Gaming As A Service Market share by Platform, 2032
- FIG 77 LAMEA Gaming As A Service Market by Platform, 2021 - 2032, USD Million
- FIG 78 LAMEA Gaming As A Service Market share by Revenue Model, 2024
- FIG 79 LAMEA Gaming As A Service Market share by Revenue Model, 2032
- FIG 80 LAMEA Gaming As A Service Market by Revenue Model, 2021 - 2032, USD Million
- FIG 81 LAMEA Gaming As A Service Market share by Game Type, 2024
- FIG 82 LAMEA Gaming As A Service Market share by Game Type, 2032
- FIG 83 LAMEA Gaming As A Service Market by Game Type, 2021 - 2032, USD Million
- FIG 84 LAMEA Gaming As A Service Market share by Country, 2024
- FIG 85 LAMEA Gaming As A Service Market share by Country, 2032
- FIG 86 LAMEA Gaming As A Service Market by Country, 2021 - 2032, USD Million
- FIG 87 Recent strategies and developments: Microsoft Corporation
- FIG 88 SWOT Analysis: Microsoft Corporation
- FIG 89 SWOT Analysis: Electronic Arts, Inc.
- FIG 90 SWOT Analysis: Nintendo Co., Ltd.
- FIG 91 SWOT Analysis: Amazon.com, Inc.
- FIG 92 SWOT Analysis: Apple, Inc.
- FIG 93 SWOT Analysis: Sony Corporation
- FIG 94 SWOT Analysis: Google LLC
The Global Gaming As A Service Market size is expected to reach $22.31 billion by 2032, rising at a market growth of 24.4% CAGR during the forecast period.
The individual end-use segment is expected to continue growing as accessibility and affordability improve globally. The expansion of 5G and cloud infrastructure will reduce latency and increase game quality on mobile devices, broadening the potential user base. Competitive dynamics will revolve around delivering unique, high-quality content and seamless experiences that justify recurring payments or purchases. The individual segment remains the core driver of the market, where innovation and user-centric offerings dictate success.
The market is experiencing significant growth due to the surging demand for on-demand gaming access. Modern gamers seek flexibility and instant access to a vast library of titles without the need to purchase physical copies or download large files. GaaS meets this need by offering subscription-based or pay-as-you-go access to a wide array of games through cloud platforms. This eliminates hardware limitations and empowers users to experience high-end gaming even on mid-range devices, making gaming more inclusive and accessible. Thus, the surging demand for on-demand gaming access empowers players with unprecedented convenience and choice, driving widespread adoption and accelerating the expansion of the market.
Additionally, Cross-platform gaming has emerged as a crucial driver in the expansion of the market. Gamers increasingly demand seamless experiences across different devices such as PCs, consoles, smartphones, and tablets. GaaS platforms capitalize on this trend by enabling users to start playing a game on one device and continue on another without losing progress. This cross-device compatibility enhances convenience, fosters inclusivity, and deepens user engagement. Hence, the rise of cross-platform gaming and device agnosticism broadens accessibility and strengthens player communities, acting as a catalyst for the robust growth of the Gaming As A Service market.
However, One of the most pressing challenges facing the market is the high upfront capital required for service providers to establish and operate cloud-based gaming platforms. Unlike traditional gaming models, GaaS demands massive infrastructure, including data centers equipped with powerful GPUs, scalable servers, and high-bandwidth networking systems. These components require substantial financial investments that only a handful of established tech giants can afford. Hence, the dominance of a few large firms may hinder market dynamism and create monopolistic tendencies in the GaaS industry, which could negatively impact consumer choice and price competition.
Value Chain Analysis
The Gaming as a Service (GaaS) value chain starts with Game Development, where engaging content is created. This is followed by Cloud Infrastructure Provisioning, ensuring scalable server resources for global access. Game Streaming & Platform Enablement allows users to play on-demand across devices, while Subscription Management & Monetization handles billing and user access.
To deliver a seamless experience, CDNs and Latency Optimization minimize delays. UI/UX Optimization refines player interaction, and Customer Support & Community Engagement fosters loyalty. Security & Compliance safeguard data and platform integrity, and The cycle ends with an Analytics & Feedback Loop informs future development, closing the value chain with continuous improvement.
End Use Outlook
Based on end use, the market is segmented into individual and commercial. The commercial segment acquired 18% revenue share in the market in 2024. This segment encompasses gaming lounges, cafes, eSports arenas, and other entertainment venues that provide gaming services to customers. With the rise of competitive gaming and organized eSports events, commercial use of gaming as a service has gained momentum. These establishments rely on cloud gaming platforms to reduce infrastructure costs and offer seamless, high-quality gaming experiences to multiple users without investing heavily in hardware.
Platform Outlook
By platform, the market is divided into smartphones & tablets, PCs & laptops, and gaming consoles. The PCs & laptops segment garnered 36% revenue share in the market in 2024. This platform continues to attract a loyal user base due to its versatility, high-performance capabilities, and support for a wide range of game genres. Gaming services on PCs and laptops offer advanced features like customizable settings, high-resolution graphics, and access to competitive gaming environments. Cloud gaming has further enhanced the appeal of this platform by reducing the need for hardware upgrades, allowing users to stream resource-intensive games with ease.
Revenue Model Outlook
On the basis of revenue model, the market is classified into subscription, in-game purchases, advertising, and others. The in-game purchases segment recorded 36% revenue share in the market in 2024. This model generates revenue through microtransactions, allowing players to buy virtual goods such as skins, weapons, characters, or progression boosts. It supports the free-to-play game structure, where users can access games for free and choose to make purchases for enhanced experiences. This revenue stream thrives on player engagement and personalization, offering a continuous monetization path long after the initial download.
Game Type Outlook
Based on game type, the market is characterized into action, role-playing, sports, adventure, simulation, strategy, and others. The role-playing segment procured 19% revenue share in the market in 2024. Role-playing games (RPGs) allow players to assume the roles of characters in a fictional setting, often featuring intricate narratives and character progression systems. The segment benefits from strong user engagement due to its storytelling depth and customization features. The availability of MMORPGs (massively multiplayer online role-playing games) on cloud platforms has also expanded the segment's appeal to a broader audience seeking persistent and evolving game worlds.
Regional Outlook
Region-wise, the market is analyzed across North America, Europe, Asia Pacific, and LAMEA. The Asia Pacific segment recorded 45% revenue share in the market in 2024. This growth is driven by a massive and rapidly expanding gaming population, increasing smartphone penetration, and strong internet connectivity in countries such as China, India, Japan, and South Korea. The region has seen a surge in mobile gaming adoption and cloud gaming infrastructure development. Government support for digital innovation and a booming eSports ecosystem further contribute to the high demand for gaming services across the region.
Recent Strategies Deployed in the Market
- Feb-2025: Tencent Holdings Ltd. announced the partnership with The Game Company (TGC), a game studio dedicated to creating timeless interactive entertainment to enhance its AI-driven cloud gaming platform, expanding access to over 1,300 AAA games globally. Leveraging Tencent's infrastructure, TGC aims to deliver seamless, low-latency gameplay, boost esports offerings, and promote gaming accessibility across APAC, LATAM, and NORAM regions.
- Jun-2024: Microsoft Corporation announced the partnership with Amazon, an E-commerce company to bring the Xbox cloud gaming app to select Fire TV devices in July. Xbox Game Pass Ultimate subscribers can stream games on TVs without a console. While not all titles are available via cloud, popular games like Fallout and Halo Infinite's campaign can be streamed.
- Jan-2023: Google LLC announced the partnership with Unity, a Game engine to support game developers by offering Unity Gaming Services like Multiplayer Server Hosting and Voice/Text Chat on Google Cloud Marketplace. They're also integrating Google Ads into Unity LevelPlay to improve mobile game monetization, helping developers build, grow, and scale live multiplayer games globally.
- Nov-2022: Google LLC teamed up with Indian startup SuperGaming, specialize in creating and publishing mobile games, particularly focusing on battle royale and other multiplayer titles to offer its SuperPlatform gaming engine globally. This collaboration helps developers manage live ops, matchmaking, analytics, and scaling. SuperGaming, known for titles like MaskGun, prefers Google Cloud after migrating from AWS, aiming to enhance game services and developer support worldwide.
- Aug-2022: Tencent Holdings Ltd. announced the partnership with Logitech G to launch a handheld cloud gaming device combining Logitech's hardware expertise with Tencent's software services. Supporting multiple cloud platforms like Xbox Cloud Gaming and NVIDIA GeForce NOW, the device enables gamers to stream AAA games anywhere without downloads or installations, advancing cloud gaming innovation.
List of Key Companies Profiled
- Microsoft Corporation
- Tencent Holdings Ltd.
- Electronic Arts, Inc.
- Nintendo Co., Ltd.
- Amazon.com, Inc. ( Amazon Luna)
- Apple, Inc. (Apple TV)
- Sony Corporation
- Google LLC
- NEXON Co., Ltd.
- NetEase, Inc.
Global Gaming As A Service Market Report Segmentation
By End Use
- Individual
- Commercial
By Platform
- Smartphones & Tablets
- PCs & Laptops
- Gaming Consoles
By Revenue Model
- Subscription
- In-Game Purchases
- Advertising
- Other Revenue Model
By Game Type
- Action
- Role-Playing
- Sports
- Adventure
- Simulation
- Strategy
- Other Game Type
By Geography
- North America
- US
- Canada
- Mexico
- Rest of North America
- Europe
- Germany
- UK
- France
- Russia
- Spain
- Italy
- Rest of Europe
- Asia Pacific
- China
- Japan
- India
- South Korea
- Singapore
- Malaysia
- Rest of Asia Pacific
- LAMEA
- Brazil
- Argentina
- UAE
- Saudi Arabia
- South Africa
- Nigeria
- Rest of LAMEA
Table of Contents
Chapter 1. Market Scope & Methodology
- 1.1 Market Definition
- 1.2 Objectives
- 1.3 Market Scope
- 1.4 Segmentation
- 1.4.1 Global Gaming As A Service Market, by End Use
- 1.4.2 Global Gaming As A Service Market, by Platform
- 1.4.3 Global Gaming As A Service Market, by Revenue Model
- 1.4.4 Global Gaming As A Service Market, by Game Type
- 1.4.5 Global Gaming As A Service Market, by Geography
- 1.5 Methodology for the research
Chapter 2. Market at a Glance
- 2.1 Key Highlights
Chapter 3. Market Overview
- 3.1 Introduction
- 3.1.1 Overview
- 3.1.1.1 Market Composition and Scenario
- 3.1.1 Overview
- 3.2 Key Factors Impacting the Market
- 3.2.1 Market Drivers
- 3.2.2 Market Restraints
- 3.2.3 Market Opportunities
- 3.2.4 Market Challenges
Chapter 4. Value Chain Analysis of Gaming As A Service Market
- 4.1 Game Development
- 4.2 Cloud Infrastructure Provisioning
- 4.3 Game Streaming & Platform Enablement
- 4.4 Subscription Management & Monetization
- 4.5 Content Delivery Networks (CDNs) & Latency Optimization
- 4.6 UI/UX Optimization
- 4.7 Customer Support & Community Engagement
- 4.8 Security & Compliance
- 4.9 Analytics & Feedback Loop
Chapter 5. Key Customer Criteria: Gaming As A Service Market
- 5.1 Low Latency & Performance
- 5.2 Game Library Diversity & Quality
- 5.3 Subscription Cost / Pricing Model
- 5.4 Cross-Platform Compatibility
- 5.5 Internet Bandwidth Requirements
- 5.6 User Interface and Experience (UI/UX)
- 5.7 Game Save & Sync Functionality
- 5.8 Regular Updates & New Content
- 5.9 Customer Support Quality
- 5.1 Community and Social Features
Chapter 6. Competition Analysis - Global
- 6.1 Market Share Analysis, 2024
- 6.2 Recent Strategies Deployed in Gaming As A Service Market
- 6.3 Porter Five Forces Analysis
Chapter 7. Global Gaming As A Service Market by End Use
- 7.1 Global Individual Market by Region
- 7.2 Global Commercial Market by Region
Chapter 8. Global Gaming As A Service Market by Platform
- 8.1 Global Smartphones & Tablets Market by Region
- 8.2 Global PCs & Laptops Market by Region
- 8.3 Global Gaming Consoles Market by Region
Chapter 9. Global Gaming As A Service Market by Revenue Model
- 9.1 Global Subscription Market by Region
- 9.2 Global In-Game Purchases Market by Region
- 9.3 Global Advertising Market by Region
- 9.4 Global Other Revenue Model Market by Region
Chapter 10. Global Gaming As A Service Market by Game Type
- 10.1 Global Action Market by Region
- 10.2 Global Role-Playing Market by Region
- 10.3 Global Sports Market by Region
- 10.4 Global Adventure Market by Region
- 10.5 Global Simulation Market by Region
- 10.6 Global Strategy Market by Region
- 10.7 Global Other Game Type Market by Region
Chapter 11. Global Gaming As A Service Market by Region
- 11.1 North America Gaming As A Service Market
- 11.1.1 North America Gaming As A Service Market by End Use
- 11.1.1.1 North America Individual Market by Region
- 11.1.1.2 North America Commercial Market by Region
- 11.1.2 North America Gaming As A Service Market by Platform
- 11.1.2.1 North America Smartphones & Tablets Market by Country
- 11.1.2.2 North America PCs & Laptops Market by Country
- 11.1.2.3 North America Gaming Consoles Market by Country
- 11.1.3 North America Gaming As A Service Market by Revenue Model
- 11.1.3.1 North America Subscription Market by Country
- 11.1.3.2 North America In-Game Purchases Market by Country
- 11.1.3.3 North America Advertising Market by Country
- 11.1.3.4 North America Other Revenue Model Market by Country
- 11.1.4 North America Gaming As A Service Market by Game Type
- 11.1.4.1 North America Action Market by Country
- 11.1.4.2 North America Role-Playing Market by Country
- 11.1.4.3 North America Sports Market by Country
- 11.1.4.4 North America Adventure Market by Country
- 11.1.4.5 North America Simulation Market by Country
- 11.1.4.6 North America Strategy Market by Country
- 11.1.4.7 North America Other Game Type Market by Country
- 11.1.5 North America Gaming As A Service Market by Country
- 11.1.5.1 US Gaming As A Service Market
- 11.1.5.1.1 US Gaming As A Service Market by End Use
- 11.1.5.1.2 US Gaming As A Service Market by Platform
- 11.1.5.1.3 US Gaming As A Service Market by Revenue Model
- 11.1.5.1.4 US Gaming As A Service Market by Game Type
- 11.1.5.2 Canada Gaming As A Service Market
- 11.1.5.2.1 Canada Gaming As A Service Market by End Use
- 11.1.5.2.2 Canada Gaming As A Service Market by Platform
- 11.1.5.2.3 Canada Gaming As A Service Market by Revenue Model
- 11.1.5.2.4 Canada Gaming As A Service Market by Game Type
- 11.1.5.3 Mexico Gaming As A Service Market
- 11.1.5.3.1 Mexico Gaming As A Service Market by End Use
- 11.1.5.3.2 Mexico Gaming As A Service Market by Platform
- 11.1.5.3.3 Mexico Gaming As A Service Market by Revenue Model
- 11.1.5.3.4 Mexico Gaming As A Service Market by Game Type
- 11.1.5.4 Rest of North America Gaming As A Service Market
- 11.1.5.4.1 Rest of North America Gaming As A Service Market by End Use
- 11.1.5.4.2 Rest of North America Gaming As A Service Market by Platform
- 11.1.5.4.3 Rest of North America Gaming As A Service Market by Revenue Model
- 11.1.5.4.4 Rest of North America Gaming As A Service Market by Game Type
- 11.1.5.1 US Gaming As A Service Market
- 11.1.1 North America Gaming As A Service Market by End Use
- 11.2 Europe Gaming As A Service Market
- 11.2.1 Europe Gaming As A Service Market by End Use
- 11.2.1.1 Europe Individual Market by Country
- 11.2.1.2 Europe Commercial Market by Country
- 11.2.2 Europe Gaming As A Service Market by Platform
- 11.2.2.1 Europe Smartphones & Tablets Market by Country
- 11.2.2.2 Europe PCs & Laptops Market by Country
- 11.2.2.3 Europe Gaming Consoles Market by Country
- 11.2.3 Europe Gaming As A Service Market by Revenue Model
- 11.2.3.1 Europe Subscription Market by Country
- 11.2.3.2 Europe In-Game Purchases Market by Country
- 11.2.3.3 Europe Advertising Market by Country
- 11.2.3.4 Europe Other Revenue Model Market by Country
- 11.2.4 Europe Gaming As A Service Market by Game Type
- 11.2.4.1 Europe Action Market by Country
- 11.2.4.2 Europe Role-Playing Market by Country
- 11.2.4.3 Europe Sports Market by Country
- 11.2.4.4 Europe Adventure Market by Country
- 11.2.4.5 Europe Simulation Market by Country
- 11.2.4.6 Europe Strategy Market by Country
- 11.2.4.7 Europe Other Game Type Market by Country
- 11.2.5 Europe Gaming As A Service Market by Country
- 11.2.5.1 Germany Gaming As A Service Market
- 11.2.5.1.1 Germany Gaming As A Service Market by End Use
- 11.2.5.1.2 Germany Gaming As A Service Market by Platform
- 11.2.5.1.3 Germany Gaming As A Service Market by Revenue Model
- 11.2.5.1.4 Germany Gaming As A Service Market by Game Type
- 11.2.5.2 UK Gaming As A Service Market
- 11.2.5.2.1 UK Gaming As A Service Market by End Use
- 11.2.5.2.2 UK Gaming As A Service Market by Platform
- 11.2.5.2.3 UK Gaming As A Service Market by Revenue Model
- 11.2.5.2.4 UK Gaming As A Service Market by Game Type
- 11.2.5.3 France Gaming As A Service Market
- 11.2.5.3.1 France Gaming As A Service Market by End Use
- 11.2.5.3.2 France Gaming As A Service Market by Platform
- 11.2.5.3.3 France Gaming As A Service Market by Revenue Model
- 11.2.5.3.4 France Gaming As A Service Market by Game Type
- 11.2.5.4 Russia Gaming As A Service Market
- 11.2.5.4.1 Russia Gaming As A Service Market by End Use
- 11.2.5.4.2 Russia Gaming As A Service Market by Platform
- 11.2.5.4.3 Russia Gaming As A Service Market by Revenue Model
- 11.2.5.4.4 Russia Gaming As A Service Market by Game Type
- 11.2.5.5 Spain Gaming As A Service Market
- 11.2.5.5.1 Spain Gaming As A Service Market by End Use
- 11.2.5.5.2 Spain Gaming As A Service Market by Platform
- 11.2.5.5.3 Spain Gaming As A Service Market by Revenue Model
- 11.2.5.5.4 Spain Gaming As A Service Market by Game Type
- 11.2.5.6 Italy Gaming As A Service Market
- 11.2.5.6.1 Italy Gaming As A Service Market by End Use
- 11.2.5.6.2 Italy Gaming As A Service Market by Platform
- 11.2.5.6.3 Italy Gaming As A Service Market by Revenue Model
- 11.2.5.6.4 Italy Gaming As A Service Market by Game Type
- 11.2.5.7 Rest of Europe Gaming As A Service Market
- 11.2.5.7.1 Rest of Europe Gaming As A Service Market by End Use
- 11.2.5.7.2 Rest of Europe Gaming As A Service Market by Platform
- 11.2.5.7.3 Rest of Europe Gaming As A Service Market by Revenue Model
- 11.2.5.7.4 Rest of Europe Gaming As A Service Market by Game Type
- 11.2.5.1 Germany Gaming As A Service Market
- 11.2.1 Europe Gaming As A Service Market by End Use
- 11.3 Asia Pacific Gaming As A Service Market
- 11.3.1 Asia Pacific Gaming As A Service Market by End Use
- 11.3.1.1 Asia Pacific Individual Market by Country
- 11.3.1.2 Asia Pacific Commercial Market by Country
- 11.3.2 Asia Pacific Gaming As A Service Market by Platform
- 11.3.2.1 Asia Pacific Smartphones & Tablets Market by Country
- 11.3.2.2 Asia Pacific PCs & Laptops Market by Country
- 11.3.2.3 Asia Pacific Gaming Consoles Market by Country
- 11.3.3 Asia Pacific Gaming As A Service Market by Revenue Model
- 11.3.3.1 Asia Pacific Subscription Market by Country
- 11.3.3.2 Asia Pacific In-Game Purchases Market by Country
- 11.3.3.3 Asia Pacific Advertising Market by Country
- 11.3.3.4 Asia Pacific Other Revenue Model Market by Country
- 11.3.4 Asia Pacific Gaming As A Service Market by Game Type
- 11.3.4.1 Asia Pacific Action Market by Country
- 11.3.4.2 Asia Pacific Role-Playing Market by Country
- 11.3.4.3 Asia Pacific Sports Market by Country
- 11.3.4.4 Asia Pacific Adventure Market by Country
- 11.3.4.5 Asia Pacific Simulation Market by Country
- 11.3.4.6 Asia Pacific Strategy Market by Country
- 11.3.4.7 Asia Pacific Other Game Type Market by Country
- 11.3.5 Asia Pacific Gaming As A Service Market by Country
- 11.3.5.1 China Gaming As A Service Market
- 11.3.5.1.1 China Gaming As A Service Market by End Use
- 11.3.5.1.2 China Gaming As A Service Market by Platform
- 11.3.5.1.3 China Gaming As A Service Market by Revenue Model
- 11.3.5.1.4 China Gaming As A Service Market by Game Type
- 11.3.5.2 Japan Gaming As A Service Market
- 11.3.5.2.1 Japan Gaming As A Service Market by End Use
- 11.3.5.2.2 Japan Gaming As A Service Market by Platform
- 11.3.5.2.3 Japan Gaming As A Service Market by Revenue Model
- 11.3.5.2.4 Japan Gaming As A Service Market by Game Type
- 11.3.5.3 India Gaming As A Service Market
- 11.3.5.3.1 India Gaming As A Service Market by End Use
- 11.3.5.3.2 India Gaming As A Service Market by Platform
- 11.3.5.3.3 India Gaming As A Service Market by Revenue Model
- 11.3.5.3.4 India Gaming As A Service Market by Game Type
- 11.3.5.4 South Korea Gaming As A Service Market
- 11.3.5.4.1 South Korea Gaming As A Service Market by End Use
- 11.3.5.4.2 South Korea Gaming As A Service Market by Platform
- 11.3.5.4.3 South Korea Gaming As A Service Market by Revenue Model
- 11.3.5.4.4 South Korea Gaming As A Service Market by Game Type
- 11.3.5.5 Singapore Gaming As A Service Market
- 11.3.5.5.1 Singapore Gaming As A Service Market by End Use
- 11.3.5.5.2 Singapore Gaming As A Service Market by Platform
- 11.3.5.5.3 Singapore Gaming As A Service Market by Revenue Model
- 11.3.5.5.4 Singapore Gaming As A Service Market by Game Type
- 11.3.5.6 Malaysia Gaming As A Service Market
- 11.3.5.6.1 Malaysia Gaming As A Service Market by End Use
- 11.3.5.6.2 Malaysia Gaming As A Service Market by Platform
- 11.3.5.6.3 Malaysia Gaming As A Service Market by Revenue Model
- 11.3.5.6.4 Malaysia Gaming As A Service Market by Game Type
- 11.3.5.7 Rest of Asia Pacific Gaming As A Service Market
- 11.3.5.7.1 Rest of Asia Pacific Gaming As A Service Market by End Use
- 11.3.5.7.2 Rest of Asia Pacific Gaming As A Service Market by Platform
- 11.3.5.7.3 Rest of Asia Pacific Gaming As A Service Market by Revenue Model
- 11.3.5.7.4 Rest of Asia Pacific Gaming As A Service Market by Game Type
- 11.3.5.1 China Gaming As A Service Market
- 11.3.1 Asia Pacific Gaming As A Service Market by End Use
- 11.4 LAMEA Gaming As A Service Market
- 11.4.1 LAMEA Gaming As A Service Market by End Use
- 11.4.1.1 LAMEA Individual Market by Country
- 11.4.1.2 LAMEA Commercial Market by Country
- 11.4.2 LAMEA Gaming As A Service Market by Platform
- 11.4.2.1 LAMEA Smartphones & Tablets Market by Country
- 11.4.2.2 LAMEA PCs & Laptops Market by Country
- 11.4.2.3 LAMEA Gaming Consoles Market by Country
- 11.4.3 LAMEA Gaming As A Service Market by Revenue Model
- 11.4.3.1 LAMEA Subscription Market by Country
- 11.4.3.2 LAMEA In-Game Purchases Market by Country
- 11.4.3.3 LAMEA Advertising Market by Country
- 11.4.3.4 LAMEA Other Revenue Model Market by Country
- 11.4.4 LAMEA Gaming As A Service Market by Game Type
- 11.4.4.1 LAMEA Action Market by Country
- 11.4.4.2 LAMEA Role-Playing Market by Country
- 11.4.4.3 LAMEA Sports Market by Country
- 11.4.4.4 LAMEA Adventure Market by Country
- 11.4.4.5 LAMEA Simulation Market by Country
- 11.4.4.6 LAMEA Strategy Market by Country
- 11.4.4.7 LAMEA Other Game Type Market by Country
- 11.4.5 LAMEA Gaming As A Service Market by Country
- 11.4.5.1 Brazil Gaming As A Service Market
- 11.4.5.1.1 Brazil Gaming As A Service Market by End Use
- 11.4.5.1.2 Brazil Gaming As A Service Market by Platform
- 11.4.5.1.3 Brazil Gaming As A Service Market by Revenue Model
- 11.4.5.1.4 Brazil Gaming As A Service Market by Game Type
- 11.4.5.2 Argentina Gaming As A Service Market
- 11.4.5.2.1 Argentina Gaming As A Service Market by End Use
- 11.4.5.2.2 Argentina Gaming As A Service Market by Platform
- 11.4.5.2.3 Argentina Gaming As A Service Market by Revenue Model
- 11.4.5.2.4 Argentina Gaming As A Service Market by Game Type
- 11.4.5.3 UAE Gaming As A Service Market
- 11.4.5.3.1 UAE Gaming As A Service Market by End Use
- 11.4.5.3.2 UAE Gaming As A Service Market by Platform
- 11.4.5.3.3 UAE Gaming As A Service Market by Revenue Model
- 11.4.5.3.4 UAE Gaming As A Service Market by Game Type
- 11.4.5.4 Saudi Arabia Gaming As A Service Market
- 11.4.5.4.1 Saudi Arabia Gaming As A Service Market by End Use
- 11.4.5.4.2 Saudi Arabia Gaming As A Service Market by Platform
- 11.4.5.4.3 Saudi Arabia Gaming As A Service Market by Revenue Model
- 11.4.5.4.4 Saudi Arabia Gaming As A Service Market by Game Type
- 11.4.5.5 South Africa Gaming As A Service Market
- 11.4.5.5.1 South Africa Gaming As A Service Market by End Use
- 11.4.5.5.2 South Africa Gaming As A Service Market by Platform
- 11.4.5.5.3 South Africa Gaming As A Service Market by Revenue Model
- 11.4.5.5.4 South Africa Gaming As A Service Market by Game Type
- 11.4.5.6 Nigeria Gaming As A Service Market
- 11.4.5.6.1 Nigeria Gaming As A Service Market by End Use
- 11.4.5.6.2 Nigeria Gaming As A Service Market by Platform
- 11.4.5.6.3 Nigeria Gaming As A Service Market by Revenue Model
- 11.4.5.6.4 Nigeria Gaming As A Service Market by Game Type
- 11.4.5.7 Rest of LAMEA Gaming As A Service Market
- 11.4.5.7.1 Rest of LAMEA Gaming As A Service Market by End Use
- 11.4.5.7.2 Rest of LAMEA Gaming As A Service Market by Platform
- 11.4.5.7.3 Rest of LAMEA Gaming As A Service Market by Revenue Model
- 11.4.5.7.4 Rest of LAMEA Gaming As A Service Market by Game Type
- 11.4.5.1 Brazil Gaming As A Service Market
- 11.4.1 LAMEA Gaming As A Service Market by End Use
Chapter 12. Company Profiles
- 12.1 Microsoft Corporation
- 12.1.1 Company Overview
- 12.1.2 Financial Analysis
- 12.1.3 Segmental and Regional Analysis
- 12.1.4 Research & Development Expenses
- 12.1.5 Recent strategies and developments:
- 12.1.5.1 Partnerships, Collaborations, and Agreements:
- 12.1.5.2 Product Launches and Product Expansions:
- 12.1.5.3 Acquisition and Mergers:
- 12.1.6 SWOT Analysis
- 12.2 Tencent Holdings Ltd.
- 12.2.2 Financial Analysis
- 12.2.3 Segmental and Regional Analysis
- 12.2.4 Research & Development Expenses
- 12.2.5 Recent strategies and developments:
- 12.2.5.1 Partnerships, Collaborations, and Agreements:
- 12.3 Electronic Arts, Inc.
- 12.3.1 Company Overview
- 12.3.2 Financial Analysis
- 12.3.3 Research & Development Expenses
- 12.3.4 Recent strategies and developments:
- 12.3.4.1 Acquisition and Mergers:
- 12.3.5 SWOT Analysis
- 12.4 Nintendo Co., Ltd.
- 12.4.1 Company Overview
- 12.4.2 Financial Analysis
- 12.4.3 Regional Analysis
- 12.4.4 Research & Development Expenses
- 12.4.5 SWOT Analysis
- 12.5 Amazon.com, Inc. (Amazon Luna)
- 12.5.1 Company Overview
- 12.5.2 Financial Analysis
- 12.5.3 Segmental Analysis
- 12.5.4 SWOT Analysis
- 12.6 Apple, Inc. (Apple TV)
- 12.6.1 Company Overview
- 12.6.2 Financial Analysis
- 12.6.3 Regional Analysis
- 12.6.4 Research & Development Expense
- 12.6.5 SWOT Analysis
- 12.7 Sony Corporation
- 12.7.1 Company Overview
- 12.7.2 Financial Analysis
- 12.7.3 Segmental and Regional Analysis
- 12.7.4 Research & Development Expenses
- 12.7.5 SWOT Analysis
- 12.8 Google LLC
- 12.8.1 Company Overview
- 12.8.2 Financial Analysis
- 12.8.3 Segmental and Regional Analysis
- 12.8.4 Research & Development Expenses
- 12.8.5 Recent strategies and developments:
- 12.8.5.1 Partnerships, Collaborations, and Agreements:
- 12.8.6 SWOT Analysis
- 12.9 NEXON Co., Ltd.
- 12.9.1 Company Overview
- 12.9.2 Financial Analysis
- 12.9.3 Regional Analysis
- 12.10. NetEase, Inc.
- 12.10.1 Company Overview
- 12.10.2 Financial Analysis
- 12.10.3 Segmental Analysis
- 12.10.4 Research & Development Expenses
