|
|
市場調査レポート
商品コード
1682868
世界ビジョンガイドロボット市場規模、シェア、動向分析レポート - アプリケーション別、タイプ別、コンポーネント別、地域別展望と予測、2024年~2031年Global Vision Guided Robotics Market Size, Share & Trends Analysis Report By Application, By Type (2D Vision and 3D Vision), By Component (Hardware, Software, and Services), By Regional Outlook and Forecast, 2024 - 2031 |
||||||

|
|||||||
|
|||||||

| 世界ビジョンガイドロボット市場規模、シェア、動向分析レポート - アプリケーション別、タイプ別、コンポーネント別、地域別展望と予測、2024年~2031年 |
|
出版日: 2025年03月07日
発行: KBV Research
ページ情報: 英文 276 Pages
納期: 即納可能
|

全表示
- 概要
- 図表
- 目次
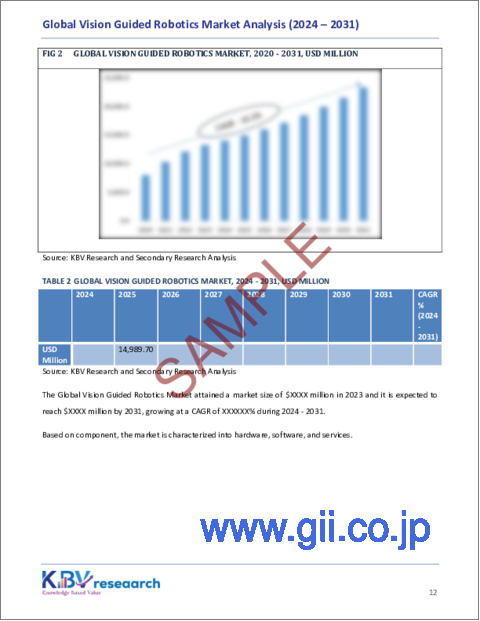
世界のビジョンガイドロボット市場規模は、予測期間中に7.5%のCAGRで市場成長し、2031年までに234億米ドルに達すると予想されています。
しかし、業界が完全に自律的な生産環境へと移行するにつれて、プログラミングの簡素化と、ビジョンガイドロボットと他の自動化技術間の相互運用性の向上が重要になります。企業は、専門のプログラマーへの依存を減らし、導入しやすくする、ユーザーフレンドリーなインターフェースとローコードまたはノーコードのソリューションを求めるようになっています。結論として、プログラミングの複雑さと既存のシステムとの統合が市場の成長を妨げています。
コンポーネントの展望
コンポーネントに基づいて、市場はハードウェア、ソフトウェア、およびサービスに分類されます。ハードウェアセグメントは、2023年に市場で60%の収益シェアを獲得しました。このセグメントの優位性は、カメラ、センサー、プロセッサ、ロボットアームなどの重要なロボットコンポーネントの需要の増加によって推進されています。3DカメラやLiDARセンサーなどの高度なビジョンシステムは、産業オートメーションの精度と効率を高めるためにロボットに広く統合されています。さらに、自動車、エレクトロニクス、ヘルスケアなどの分野でAIを搭載したビジョンテクノロジーの採用が増えていることで、高性能ハードウェアソリューションの需要が高まっています。イメージングテクノロジーの継続的な進歩とハードウェアコンポーネントの小型化は、このセグメントの拡大にさらに貢献しています。
タイプの見通し
タイプ別に見ると、市場は2Dビジョンと3Dビジョンに分類されます。3Dビジョンセグメントは、2023年に市場で45%の収益シェアを占めました。正確な物体認識、奥行き知覚、複雑な形状分析の需要の高まりにより、3Dビジョンシステムの採用が促進されています。これらのシステムは、ロボットガイダンス、ビンピッキング、自律ナビゲーションの機能が強化されており、自動車、航空宇宙、ヘルスケアなどの業界に最適です。スマートファクトリーや産業オートメーションにおける3Dビジョンの導入が増え、AIや機械学習の進歩と相まって、市場拡大を促進しています。さらに、業界がより洗練された自動化ソリューションへと移行するにつれて、3Dビジョンガイドロボットの需要が高まり、2Dビジョン技術とのギャップがさらに埋まると予想されます。
アプリケーションの見通し
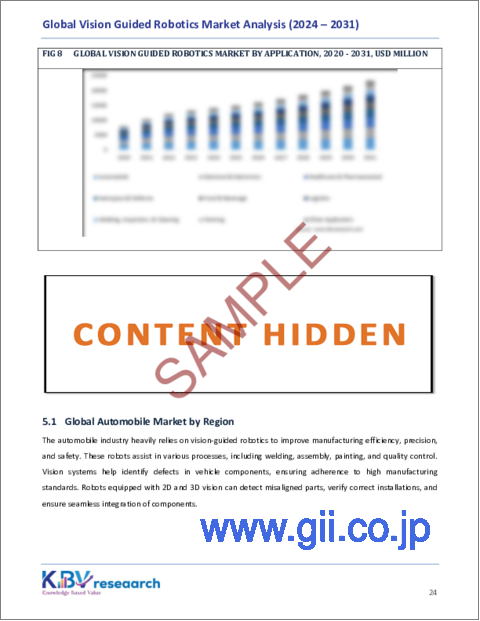
アプリケーションに基づいて、市場は自動車、電気・電子、飲食品、航空宇宙・防衛、ヘルスケア・製薬、物流、溶接・検査・清掃、塗装などに分類されています。自動車セグメントは、2023年に市場で20%の収益シェアを獲得しました。組立ライン、溶接、塗装、検査プロセスを含む自動車製造における自動化の採用の増加により、ビジョンガイドロボットの需要が高まっています。自動車メーカーは、高度なロボットシステムを活用して、精度を高め、生産効率を改善し、運用コストを削減しています。さらに、電気自動車(EV)と自動運転技術の需要の高まりにより、自動車分野でのビジョンガイドロボットの統合がさらに加速しています。
地域展望
地域別に見ると、市場は北米、欧州、アジア太平洋、ラテンアメリカ・中東・アフリカにわたって分析されています。アジア太平洋セグメントは、2023年に市場で36%の収益シェアを記録しました。急速な工業化と製造業の自動化の需要増加が、この地域の市場成長を牽引しています。中国、日本、韓国などの国は、スマート製造を推進する政府の取り組みに牽引され、ロボットの導入をリードしています。電子機器や物流などの業界で精度、効率、コスト削減のニーズが高まっているため、アジア太平洋地域でビジョンガイドロボットの導入が加速しています。
目次
第1章 市場範囲と調査手法
- 市場の定義
- 目的
- 市場範囲
- セグメンテーション
- 調査手法
第2章 市場要覧
- 主なハイライト
第3章 市場概要
- イントロダクション
- 概要
- 市場構成とシナリオ
- 概要
- 市場に影響を与える主な要因
- 市場促進要因
- 市場抑制要因
- 市場機会
- 市場の課題
第4章 競合分析- 世界
- 市場シェア分析、2023年
- ビジョンガイドロボット市場で展開される戦略
- ポーターのファイブフォース分析
第5章 世界のビジョンガイドロボット市場:アプリケーション別
- 世界の自動車市場:地域別
- 世界の電気・電子機器市場:地域別
- 世界のヘルスケア・医薬品市場:地域別
- 世界の航空宇宙・防衛市場:地域別
- 世界の飲食品市場:地域別
- 世界の物流市場:地域別
- 世界の溶接、検査、洗浄市場:地域別
- 世界の塗装市場:地域別
- 世界のその他のアプリケーション市場:地域別
第6章 世界のビジョンガイドロボット市場:タイプ別
- 世界の2Dビジョン市場:地域別
- 世界の3Dビジョン市場:地域別
第7章 世界のビジョンガイドロボット市場:コンポーネント別
- 世界のハードウェア市場:地域別
- 世界のソフトウェア市場:地域別
- 世界のサービス市場:地域別
第8章 世界のビジョンガイドロボット市場:地域別
- 北米
- 北米のビジョンガイドロボット市場:国別
- 米国
- カナダ
- メキシコ
- その他北米地域
- 北米のビジョンガイドロボット市場:国別
- 欧州
- 欧州のビジョンガイドロボット市場:国別
- ドイツ
- 英国
- フランス
- ロシア
- スペイン
- イタリア
- その他欧州地域
- 欧州のビジョンガイドロボット市場:国別
- アジア太平洋地域
- アジア太平洋のビジョンガイドロボット市場:国別
- 中国
- 日本
- インド
- 韓国
- シンガポール
- マレーシア
- その他アジア太平洋地域
- アジア太平洋のビジョンガイドロボット市場:国別
- ラテンアメリカ・中東・アフリカ
- ラテンアメリカ・中東・アフリカのビジョンガイドロボット市場:国別
- ブラジル
- アルゼンチン
- アラブ首長国連邦
- サウジアラビア
- 南アフリカ
- ナイジェリア
- その他ラテンアメリカ・中東・アフリカ地域
- ラテンアメリカ・中東・アフリカのビジョンガイドロボット市場:国別
第9章 企業プロファイル
- Omron Corporation
- Denso Corporation
- FANUC Corporation
- Hexagon AB
- Cognex Corporation
- Basler AG
- ABB Ltd
- Mitsubishi Electric Corporation
- Kawasaki Heavy Industries Ltd
- Qualcomm Incorporated(Qualcomm Technologies, Inc)
- Universal Robots A/S(Teradyne, Inc)
第10章 ビジョンガイドロボット市場の成功必須条件
LIST OF TABLES
- TABLE 1 Global Vision Guided Robotics Market, 2020 - 2023, USD Million
- TABLE 2 Global Vision Guided Robotics Market, 2024 - 2031, USD Million
- TABLE 3 Global Vision Guided Robotics Market by Application, 2020 - 2023, USD Million
- TABLE 4 Global Vision Guided Robotics Market by Application, 2024 - 2031, USD Million
- TABLE 5 Global Automobile Market by Region, 2020 - 2023, USD Million
- TABLE 6 Global Automobile Market by Region, 2024 - 2031, USD Million
- TABLE 7 Global Electrical & Electronics Market by Region, 2020 - 2023, USD Million
- TABLE 8 Global Electrical & Electronics Market by Region, 2024 - 2031, USD Million
- TABLE 9 Global Healthcare & Pharmaceutical Market by Region, 2020 - 2023, USD Million
- TABLE 10 Global Healthcare & Pharmaceutical Market by Region, 2024 - 2031, USD Million
- TABLE 11 Global Aerospace & Defense Market by Region, 2020 - 2023, USD Million
- TABLE 12 Global Aerospace & Defense Market by Region, 2024 - 2031, USD Million
- TABLE 13 Global Food & Beverage Market by Region, 2020 - 2023, USD Million
- TABLE 14 Global Food & Beverage Market by Region, 2024 - 2031, USD Million
- TABLE 15 Global Logistics Market by Region, 2020 - 2023, USD Million
- TABLE 16 Global Logistics Market by Region, 2024 - 2031, USD Million
- TABLE 17 Global Welding, Inspection, & Cleaning Market by Region, 2020 - 2023, USD Million
- TABLE 18 Global Welding, Inspection, & Cleaning Market by Region, 2024 - 2031, USD Million
- TABLE 19 Global Painting Market by Region, 2020 - 2023, USD Million
- TABLE 20 Global Painting Market by Region, 2024 - 2031, USD Million
- TABLE 21 Global Other Application Market by Region, 2020 - 2023, USD Million
- TABLE 22 Global Other Application Market by Region, 2024 - 2031, USD Million
- TABLE 23 Global Vision Guided Robotics Market by Type, 2020 - 2023, USD Million
- TABLE 24 Global Vision Guided Robotics Market by Type, 2024 - 2031, USD Million
- TABLE 25 Global 2D Vision Market by Region, 2020 - 2023, USD Million
- TABLE 26 Global 2D Vision Market by Region, 2024 - 2031, USD Million
- TABLE 27 Global 3D Vision Market by Region, 2020 - 2023, USD Million
- TABLE 28 Global 3D Vision Market by Region, 2024 - 2031, USD Million
- TABLE 29 Global Vision Guided Robotics Market by Component, 2020 - 2023, USD Million
- TABLE 30 Global Vision Guided Robotics Market by Component, 2024 - 2031, USD Million
- TABLE 31 Global Hardware Market by Region, 2020 - 2023, USD Million
- TABLE 32 Global Hardware Market by Region, 2024 - 2031, USD Million
- TABLE 33 Global Software Market by Region, 2020 - 2023, USD Million
- TABLE 34 Global Software Market by Region, 2024 - 2031, USD Million
- TABLE 35 Global Services Market by Region, 2020 - 2023, USD Million
- TABLE 36 Global Services Market by Region, 2024 - 2031, USD Million
- TABLE 37 Global Vision Guided Robotics Market by Region, 2020 - 2023, USD Million
- TABLE 38 Global Vision Guided Robotics Market by Region, 2024 - 2031, USD Million
- TABLE 39 North America Vision Guided Robotics Market, 2020 - 2023, USD Million
- TABLE 40 North America Vision Guided Robotics Market, 2024 - 2031, USD Million
- TABLE 41 North America Vision Guided Robotics Market by Application, 2020 - 2023, USD Million
- TABLE 42 North America Vision Guided Robotics Market by Application, 2024 - 2031, USD Million
- TABLE 43 North America Automobile Market by Country, 2020 - 2023, USD Million
- TABLE 44 North America Automobile Market by Country, 2024 - 2031, USD Million
- TABLE 45 North America Electrical & Electronics Market by Country, 2020 - 2023, USD Million
- TABLE 46 North America Electrical & Electronics Market by Country, 2024 - 2031, USD Million
- TABLE 47 North America Healthcare & Pharmaceutical Market by Country, 2020 - 2023, USD Million
- TABLE 48 North America Healthcare & Pharmaceutical Market by Country, 2024 - 2031, USD Million
- TABLE 49 North America Aerospace & Defense Market by Country, 2020 - 2023, USD Million
- TABLE 50 North America Aerospace & Defense Market by Country, 2024 - 2031, USD Million
- TABLE 51 North America Food & Beverage Market by Country, 2020 - 2023, USD Million
- TABLE 52 North America Food & Beverage Market by Country, 2024 - 2031, USD Million
- TABLE 53 North America Logistics Market by Country, 2020 - 2023, USD Million
- TABLE 54 North America Logistics Market by Country, 2024 - 2031, USD Million
- TABLE 55 North America Welding, Inspection, & Cleaning Market by Country, 2020 - 2023, USD Million
- TABLE 56 North America Welding, Inspection, & Cleaning Market by Country, 2024 - 2031, USD Million
- TABLE 57 North America Painting Market by Country, 2020 - 2023, USD Million
- TABLE 58 North America Painting Market by Country, 2024 - 2031, USD Million
- TABLE 59 North America Other Application Market by Country, 2020 - 2023, USD Million
- TABLE 60 North America Other Application Market by Country, 2024 - 2031, USD Million
- TABLE 61 North America Vision Guided Robotics Market by Type, 2020 - 2023, USD Million
- TABLE 62 North America Vision Guided Robotics Market by Type, 2024 - 2031, USD Million
- TABLE 63 North America 2D Vision Market by Country, 2020 - 2023, USD Million
- TABLE 64 North America 2D Vision Market by Country, 2024 - 2031, USD Million
- TABLE 65 North America 3D Vision Market by Country, 2020 - 2023, USD Million
- TABLE 66 North America 3D Vision Market by Country, 2024 - 2031, USD Million
- TABLE 67 North America Vision Guided Robotics Market by Component, 2020 - 2023, USD Million
- TABLE 68 North America Vision Guided Robotics Market by Component, 2024 - 2031, USD Million
- TABLE 69 North America Hardware Market by Country, 2020 - 2023, USD Million
- TABLE 70 North America Hardware Market by Country, 2024 - 2031, USD Million
- TABLE 71 North America Software Market by Country, 2020 - 2023, USD Million
- TABLE 72 North America Software Market by Country, 2024 - 2031, USD Million
- TABLE 73 North America Services Market by Country, 2020 - 2023, USD Million
- TABLE 74 North America Services Market by Country, 2024 - 2031, USD Million
- TABLE 75 North America Vision Guided Robotics Market by Country, 2020 - 2023, USD Million
- TABLE 76 North America Vision Guided Robotics Market by Country, 2024 - 2031, USD Million
- TABLE 77 US Vision Guided Robotics Market, 2020 - 2023, USD Million
- TABLE 78 US Vision Guided Robotics Market, 2024 - 2031, USD Million
- TABLE 79 US Vision Guided Robotics Market by Application, 2020 - 2023, USD Million
- TABLE 80 US Vision Guided Robotics Market by Application, 2024 - 2031, USD Million
- TABLE 81 US Vision Guided Robotics Market by Type, 2020 - 2023, USD Million
- TABLE 82 US Vision Guided Robotics Market by Type, 2024 - 2031, USD Million
- TABLE 83 US Vision Guided Robotics Market by Component, 2020 - 2023, USD Million
- TABLE 84 US Vision Guided Robotics Market by Component, 2024 - 2031, USD Million
- TABLE 85 Canada Vision Guided Robotics Market, 2020 - 2023, USD Million
- TABLE 86 Canada Vision Guided Robotics Market, 2024 - 2031, USD Million
- TABLE 87 Canada Vision Guided Robotics Market by Application, 2020 - 2023, USD Million
- TABLE 88 Canada Vision Guided Robotics Market by Application, 2024 - 2031, USD Million
- TABLE 89 Canada Vision Guided Robotics Market by Type, 2020 - 2023, USD Million
- TABLE 90 Canada Vision Guided Robotics Market by Type, 2024 - 2031, USD Million
- TABLE 91 Canada Vision Guided Robotics Market by Component, 2020 - 2023, USD Million
- TABLE 92 Canada Vision Guided Robotics Market by Component, 2024 - 2031, USD Million
- TABLE 93 Mexico Vision Guided Robotics Market, 2020 - 2023, USD Million
- TABLE 94 Mexico Vision Guided Robotics Market, 2024 - 2031, USD Million
- TABLE 95 Mexico Vision Guided Robotics Market by Application, 2020 - 2023, USD Million
- TABLE 96 Mexico Vision Guided Robotics Market by Application, 2024 - 2031, USD Million
- TABLE 97 Mexico Vision Guided Robotics Market by Type, 2020 - 2023, USD Million
- TABLE 98 Mexico Vision Guided Robotics Market by Type, 2024 - 2031, USD Million
- TABLE 99 Mexico Vision Guided Robotics Market by Component, 2020 - 2023, USD Million
- TABLE 100 Mexico Vision Guided Robotics Market by Component, 2024 - 2031, USD Million
- TABLE 101 Rest of North America Vision Guided Robotics Market, 2020 - 2023, USD Million
- TABLE 102 Rest of North America Vision Guided Robotics Market, 2024 - 2031, USD Million
- TABLE 103 Rest of North America Vision Guided Robotics Market by Application, 2020 - 2023, USD Million
- TABLE 104 Rest of North America Vision Guided Robotics Market by Application, 2024 - 2031, USD Million
- TABLE 105 Rest of North America Vision Guided Robotics Market by Type, 2020 - 2023, USD Million
- TABLE 106 Rest of North America Vision Guided Robotics Market by Type, 2024 - 2031, USD Million
- TABLE 107 Rest of North America Vision Guided Robotics Market by Component, 2020 - 2023, USD Million
- TABLE 108 Rest of North America Vision Guided Robotics Market by Component, 2024 - 2031, USD Million
- TABLE 109 Europe Vision Guided Robotics Market, 2020 - 2023, USD Million
- TABLE 110 Europe Vision Guided Robotics Market, 2024 - 2031, USD Million
- TABLE 111 Europe Vision Guided Robotics Market by Application, 2020 - 2023, USD Million
- TABLE 112 Europe Vision Guided Robotics Market by Application, 2024 - 2031, USD Million
- TABLE 113 Europe Automobile Market by Country, 2020 - 2023, USD Million
- TABLE 114 Europe Automobile Market by Country, 2024 - 2031, USD Million
- TABLE 115 Europe Electrical & Electronics Market by Country, 2020 - 2023, USD Million
- TABLE 116 Europe Electrical & Electronics Market by Country, 2024 - 2031, USD Million
- TABLE 117 Europe Healthcare & Pharmaceutical Market by Country, 2020 - 2023, USD Million
- TABLE 118 Europe Healthcare & Pharmaceutical Market by Country, 2024 - 2031, USD Million
- TABLE 119 Europe Aerospace & Defense Market by Country, 2020 - 2023, USD Million
- TABLE 120 Europe Aerospace & Defense Market by Country, 2024 - 2031, USD Million
- TABLE 121 Europe Food & Beverage Market by Country, 2020 - 2023, USD Million
- TABLE 122 Europe Food & Beverage Market by Country, 2024 - 2031, USD Million
- TABLE 123 Europe Logistics Market by Country, 2020 - 2023, USD Million
- TABLE 124 Europe Logistics Market by Country, 2024 - 2031, USD Million
- TABLE 125 Europe Welding, Inspection, & Cleaning Market by Country, 2020 - 2023, USD Million
- TABLE 126 Europe Welding, Inspection, & Cleaning Market by Country, 2024 - 2031, USD Million
- TABLE 127 Europe Painting Market by Country, 2020 - 2023, USD Million
- TABLE 128 Europe Painting Market by Country, 2024 - 2031, USD Million
- TABLE 129 Europe Other Application Market by Country, 2020 - 2023, USD Million
- TABLE 130 Europe Other Application Market by Country, 2024 - 2031, USD Million
- TABLE 131 Europe Vision Guided Robotics Market by Type, 2020 - 2023, USD Million
- TABLE 132 Europe Vision Guided Robotics Market by Type, 2024 - 2031, USD Million
- TABLE 133 Europe 2D Vision Market by Country, 2020 - 2023, USD Million
- TABLE 134 Europe 2D Vision Market by Country, 2024 - 2031, USD Million
- TABLE 135 Europe 3D Vision Market by Country, 2020 - 2023, USD Million
- TABLE 136 Europe 3D Vision Market by Country, 2024 - 2031, USD Million
- TABLE 137 Europe Vision Guided Robotics Market by Component, 2020 - 2023, USD Million
- TABLE 138 Europe Vision Guided Robotics Market by Component, 2024 - 2031, USD Million
- TABLE 139 Europe Hardware Market by Country, 2020 - 2023, USD Million
- TABLE 140 Europe Hardware Market by Country, 2024 - 2031, USD Million
- TABLE 141 Europe Software Market by Country, 2020 - 2023, USD Million
- TABLE 142 Europe Software Market by Country, 2024 - 2031, USD Million
- TABLE 143 Europe Services Market by Country, 2020 - 2023, USD Million
- TABLE 144 Europe Services Market by Country, 2024 - 2031, USD Million
- TABLE 145 Europe Vision Guided Robotics Market by Country, 2020 - 2023, USD Million
- TABLE 146 Europe Vision Guided Robotics Market by Country, 2024 - 2031, USD Million
- TABLE 147 Germany Vision Guided Robotics Market, 2020 - 2023, USD Million
- TABLE 148 Germany Vision Guided Robotics Market, 2024 - 2031, USD Million
- TABLE 149 Germany Vision Guided Robotics Market by Application, 2020 - 2023, USD Million
- TABLE 150 Germany Vision Guided Robotics Market by Application, 2024 - 2031, USD Million
- TABLE 151 Germany Vision Guided Robotics Market by Type, 2020 - 2023, USD Million
- TABLE 152 Germany Vision Guided Robotics Market by Type, 2024 - 2031, USD Million
- TABLE 153 Germany Vision Guided Robotics Market by Component, 2020 - 2023, USD Million
- TABLE 154 Germany Vision Guided Robotics Market by Component, 2024 - 2031, USD Million
- TABLE 155 UK Vision Guided Robotics Market, 2020 - 2023, USD Million
- TABLE 156 UK Vision Guided Robotics Market, 2024 - 2031, USD Million
- TABLE 157 UK Vision Guided Robotics Market by Application, 2020 - 2023, USD Million
- TABLE 158 UK Vision Guided Robotics Market by Application, 2024 - 2031, USD Million
- TABLE 159 UK Vision Guided Robotics Market by Type, 2020 - 2023, USD Million
- TABLE 160 UK Vision Guided Robotics Market by Type, 2024 - 2031, USD Million
- TABLE 161 UK Vision Guided Robotics Market by Component, 2020 - 2023, USD Million
- TABLE 162 UK Vision Guided Robotics Market by Component, 2024 - 2031, USD Million
- TABLE 163 France Vision Guided Robotics Market, 2020 - 2023, USD Million
- TABLE 164 France Vision Guided Robotics Market, 2024 - 2031, USD Million
- TABLE 165 France Vision Guided Robotics Market by Application, 2020 - 2023, USD Million
- TABLE 166 France Vision Guided Robotics Market by Application, 2024 - 2031, USD Million
- TABLE 167 France Vision Guided Robotics Market by Type, 2020 - 2023, USD Million
- TABLE 168 France Vision Guided Robotics Market by Type, 2024 - 2031, USD Million
- TABLE 169 France Vision Guided Robotics Market by Component, 2020 - 2023, USD Million
- TABLE 170 France Vision Guided Robotics Market by Component, 2024 - 2031, USD Million
- TABLE 171 Russia Vision Guided Robotics Market, 2020 - 2023, USD Million
- TABLE 172 Russia Vision Guided Robotics Market, 2024 - 2031, USD Million
- TABLE 173 Russia Vision Guided Robotics Market by Application, 2020 - 2023, USD Million
- TABLE 174 Russia Vision Guided Robotics Market by Application, 2024 - 2031, USD Million
- TABLE 175 Russia Vision Guided Robotics Market by Type, 2020 - 2023, USD Million
- TABLE 176 Russia Vision Guided Robotics Market by Type, 2024 - 2031, USD Million
- TABLE 177 Russia Vision Guided Robotics Market by Component, 2020 - 2023, USD Million
- TABLE 178 Russia Vision Guided Robotics Market by Component, 2024 - 2031, USD Million
- TABLE 179 Spain Vision Guided Robotics Market, 2020 - 2023, USD Million
- TABLE 180 Spain Vision Guided Robotics Market, 2024 - 2031, USD Million
- TABLE 181 Spain Vision Guided Robotics Market by Application, 2020 - 2023, USD Million
- TABLE 182 Spain Vision Guided Robotics Market by Application, 2024 - 2031, USD Million
- TABLE 183 Spain Vision Guided Robotics Market by Type, 2020 - 2023, USD Million
- TABLE 184 Spain Vision Guided Robotics Market by Type, 2024 - 2031, USD Million
- TABLE 185 Spain Vision Guided Robotics Market by Component, 2020 - 2023, USD Million
- TABLE 186 Spain Vision Guided Robotics Market by Component, 2024 - 2031, USD Million
- TABLE 187 Italy Vision Guided Robotics Market, 2020 - 2023, USD Million
- TABLE 188 Italy Vision Guided Robotics Market, 2024 - 2031, USD Million
- TABLE 189 Italy Vision Guided Robotics Market by Application, 2020 - 2023, USD Million
- TABLE 190 Italy Vision Guided Robotics Market by Application, 2024 - 2031, USD Million
- TABLE 191 Italy Vision Guided Robotics Market by Type, 2020 - 2023, USD Million
- TABLE 192 Italy Vision Guided Robotics Market by Type, 2024 - 2031, USD Million
- TABLE 193 Italy Vision Guided Robotics Market by Component, 2020 - 2023, USD Million
- TABLE 194 Italy Vision Guided Robotics Market by Component, 2024 - 2031, USD Million
- TABLE 195 Rest of Europe Vision Guided Robotics Market, 2020 - 2023, USD Million
- TABLE 196 Rest of Europe Vision Guided Robotics Market, 2024 - 2031, USD Million
- TABLE 197 Rest of Europe Vision Guided Robotics Market by Application, 2020 - 2023, USD Million
- TABLE 198 Rest of Europe Vision Guided Robotics Market by Application, 2024 - 2031, USD Million
- TABLE 199 Rest of Europe Vision Guided Robotics Market by Type, 2020 - 2023, USD Million
- TABLE 200 Rest of Europe Vision Guided Robotics Market by Type, 2024 - 2031, USD Million
- TABLE 201 Rest of Europe Vision Guided Robotics Market by Component, 2020 - 2023, USD Million
- TABLE 202 Rest of Europe Vision Guided Robotics Market by Component, 2024 - 2031, USD Million
- TABLE 203 Asia Pacific Vision Guided Robotics Market, 2020 - 2023, USD Million
- TABLE 204 Asia Pacific Vision Guided Robotics Market, 2024 - 2031, USD Million
- TABLE 205 Asia Pacific Vision Guided Robotics Market by Application, 2020 - 2023, USD Million
- TABLE 206 Asia Pacific Vision Guided Robotics Market by Application, 2024 - 2031, USD Million
- TABLE 207 Asia Pacific Automobile Market by Country, 2020 - 2023, USD Million
- TABLE 208 Asia Pacific Automobile Market by Country, 2024 - 2031, USD Million
- TABLE 209 Asia Pacific Electrical & Electronics Market by Country, 2020 - 2023, USD Million
- TABLE 210 Asia Pacific Electrical & Electronics Market by Country, 2024 - 2031, USD Million
- TABLE 211 Asia Pacific Healthcare & Pharmaceutical Market by Country, 2020 - 2023, USD Million
- TABLE 212 Asia Pacific Healthcare & Pharmaceutical Market by Country, 2024 - 2031, USD Million
- TABLE 213 Asia Pacific Aerospace & Defense Market by Country, 2020 - 2023, USD Million
- TABLE 214 Asia Pacific Aerospace & Defense Market by Country, 2024 - 2031, USD Million
- TABLE 215 Asia Pacific Food & Beverage Market by Country, 2020 - 2023, USD Million
- TABLE 216 Asia Pacific Food & Beverage Market by Country, 2024 - 2031, USD Million
- TABLE 217 Asia Pacific Logistics Market by Country, 2020 - 2023, USD Million
- TABLE 218 Asia Pacific Logistics Market by Country, 2024 - 2031, USD Million
- TABLE 219 Asia Pacific Welding, Inspection, & Cleaning Market by Country, 2020 - 2023, USD Million
- TABLE 220 Asia Pacific Welding, Inspection, & Cleaning Market by Country, 2024 - 2031, USD Million
- TABLE 221 Asia Pacific Painting Market by Country, 2020 - 2023, USD Million
- TABLE 222 Asia Pacific Painting Market by Country, 2024 - 2031, USD Million
- TABLE 223 Asia Pacific Other Application Market by Country, 2020 - 2023, USD Million
- TABLE 224 Asia Pacific Other Application Market by Country, 2024 - 2031, USD Million
- TABLE 225 Asia Pacific Vision Guided Robotics Market by Type, 2020 - 2023, USD Million
- TABLE 226 Asia Pacific Vision Guided Robotics Market by Type, 2024 - 2031, USD Million
- TABLE 227 Asia Pacific 2D Vision Market by Country, 2020 - 2023, USD Million
- TABLE 228 Asia Pacific 2D Vision Market by Country, 2024 - 2031, USD Million
- TABLE 229 Asia Pacific 3D Vision Market by Country, 2020 - 2023, USD Million
- TABLE 230 Asia Pacific 3D Vision Market by Country, 2024 - 2031, USD Million
- TABLE 231 Asia Pacific Vision Guided Robotics Market by Component, 2020 - 2023, USD Million
- TABLE 232 Asia Pacific Vision Guided Robotics Market by Component, 2024 - 2031, USD Million
- TABLE 233 Asia Pacific Hardware Market by Country, 2020 - 2023, USD Million
- TABLE 234 Asia Pacific Hardware Market by Country, 2024 - 2031, USD Million
- TABLE 235 Asia Pacific Software Market by Country, 2020 - 2023, USD Million
- TABLE 236 Asia Pacific Software Market by Country, 2024 - 2031, USD Million
- TABLE 237 Asia Pacific Services Market by Country, 2020 - 2023, USD Million
- TABLE 238 Asia Pacific Services Market by Country, 2024 - 2031, USD Million
- TABLE 239 Asia Pacific Vision Guided Robotics Market by Country, 2020 - 2023, USD Million
- TABLE 240 Asia Pacific Vision Guided Robotics Market by Country, 2024 - 2031, USD Million
- TABLE 241 China Vision Guided Robotics Market, 2020 - 2023, USD Million
- TABLE 242 China Vision Guided Robotics Market, 2024 - 2031, USD Million
- TABLE 243 China Vision Guided Robotics Market by Application, 2020 - 2023, USD Million
- TABLE 244 China Vision Guided Robotics Market by Application, 2024 - 2031, USD Million
- TABLE 245 China Vision Guided Robotics Market by Type, 2020 - 2023, USD Million
- TABLE 246 China Vision Guided Robotics Market by Type, 2024 - 2031, USD Million
- TABLE 247 China Vision Guided Robotics Market by Component, 2020 - 2023, USD Million
- TABLE 248 China Vision Guided Robotics Market by Component, 2024 - 2031, USD Million
- TABLE 249 Japan Vision Guided Robotics Market, 2020 - 2023, USD Million
- TABLE 250 Japan Vision Guided Robotics Market, 2024 - 2031, USD Million
- TABLE 251 Japan Vision Guided Robotics Market by Application, 2020 - 2023, USD Million
- TABLE 252 Japan Vision Guided Robotics Market by Application, 2024 - 2031, USD Million
- TABLE 253 Japan Vision Guided Robotics Market by Type, 2020 - 2023, USD Million
- TABLE 254 Japan Vision Guided Robotics Market by Type, 2024 - 2031, USD Million
- TABLE 255 Japan Vision Guided Robotics Market by Component, 2020 - 2023, USD Million
- TABLE 256 Japan Vision Guided Robotics Market by Component, 2024 - 2031, USD Million
- TABLE 257 India Vision Guided Robotics Market, 2020 - 2023, USD Million
- TABLE 258 India Vision Guided Robotics Market, 2024 - 2031, USD Million
- TABLE 259 India Vision Guided Robotics Market by Application, 2020 - 2023, USD Million
- TABLE 260 India Vision Guided Robotics Market by Application, 2024 - 2031, USD Million
- TABLE 261 India Vision Guided Robotics Market by Type, 2020 - 2023, USD Million
- TABLE 262 India Vision Guided Robotics Market by Type, 2024 - 2031, USD Million
- TABLE 263 India Vision Guided Robotics Market by Component, 2020 - 2023, USD Million
- TABLE 264 India Vision Guided Robotics Market by Component, 2024 - 2031, USD Million
- TABLE 265 South Korea Vision Guided Robotics Market, 2020 - 2023, USD Million
- TABLE 266 South Korea Vision Guided Robotics Market, 2024 - 2031, USD Million
- TABLE 267 South Korea Vision Guided Robotics Market by Application, 2020 - 2023, USD Million
- TABLE 268 South Korea Vision Guided Robotics Market by Application, 2024 - 2031, USD Million
- TABLE 269 South Korea Vision Guided Robotics Market by Type, 2020 - 2023, USD Million
- TABLE 270 South Korea Vision Guided Robotics Market by Type, 2024 - 2031, USD Million
- TABLE 271 South Korea Vision Guided Robotics Market by Component, 2020 - 2023, USD Million
- TABLE 272 South Korea Vision Guided Robotics Market by Component, 2024 - 2031, USD Million
- TABLE 273 Singapore Vision Guided Robotics Market, 2020 - 2023, USD Million
- TABLE 274 Singapore Vision Guided Robotics Market, 2024 - 2031, USD Million
- TABLE 275 Singapore Vision Guided Robotics Market by Application, 2020 - 2023, USD Million
- TABLE 276 Singapore Vision Guided Robotics Market by Application, 2024 - 2031, USD Million
- TABLE 277 Singapore Vision Guided Robotics Market by Type, 2020 - 2023, USD Million
- TABLE 278 Singapore Vision Guided Robotics Market by Type, 2024 - 2031, USD Million
- TABLE 279 Singapore Vision Guided Robotics Market by Component, 2020 - 2023, USD Million
- TABLE 280 Singapore Vision Guided Robotics Market by Component, 2024 - 2031, USD Million
- TABLE 281 Malaysia Vision Guided Robotics Market, 2020 - 2023, USD Million
- TABLE 282 Malaysia Vision Guided Robotics Market, 2024 - 2031, USD Million
- TABLE 283 Malaysia Vision Guided Robotics Market by Application, 2020 - 2023, USD Million
- TABLE 284 Malaysia Vision Guided Robotics Market by Application, 2024 - 2031, USD Million
- TABLE 285 Malaysia Vision Guided Robotics Market by Type, 2020 - 2023, USD Million
- TABLE 286 Malaysia Vision Guided Robotics Market by Type, 2024 - 2031, USD Million
- TABLE 287 Malaysia Vision Guided Robotics Market by Component, 2020 - 2023, USD Million
- TABLE 288 Malaysia Vision Guided Robotics Market by Component, 2024 - 2031, USD Million
- TABLE 289 Rest of Asia Pacific Vision Guided Robotics Market, 2020 - 2023, USD Million
- TABLE 290 Rest of Asia Pacific Vision Guided Robotics Market, 2024 - 2031, USD Million
- TABLE 291 Rest of Asia Pacific Vision Guided Robotics Market by Application, 2020 - 2023, USD Million
- TABLE 292 Rest of Asia Pacific Vision Guided Robotics Market by Application, 2024 - 2031, USD Million
- TABLE 293 Rest of Asia Pacific Vision Guided Robotics Market by Type, 2020 - 2023, USD Million
- TABLE 294 Rest of Asia Pacific Vision Guided Robotics Market by Type, 2024 - 2031, USD Million
- TABLE 295 Rest of Asia Pacific Vision Guided Robotics Market by Component, 2020 - 2023, USD Million
- TABLE 296 Rest of Asia Pacific Vision Guided Robotics Market by Component, 2024 - 2031, USD Million
- TABLE 297 LAMEA Vision Guided Robotics Market, 2020 - 2023, USD Million
- TABLE 298 LAMEA Vision Guided Robotics Market, 2024 - 2031, USD Million
- TABLE 299 LAMEA Vision Guided Robotics Market by Application, 2020 - 2023, USD Million
- TABLE 300 LAMEA Vision Guided Robotics Market by Application, 2024 - 2031, USD Million
- TABLE 301 LAMEA Automobile Market by Country, 2020 - 2023, USD Million
- TABLE 302 LAMEA Automobile Market by Country, 2024 - 2031, USD Million
- TABLE 303 LAMEA Electrical & Electronics Market by Country, 2020 - 2023, USD Million
- TABLE 304 LAMEA Electrical & Electronics Market by Country, 2024 - 2031, USD Million
- TABLE 305 LAMEA Healthcare & Pharmaceutical Market by Country, 2020 - 2023, USD Million
- TABLE 306 LAMEA Healthcare & Pharmaceutical Market by Country, 2024 - 2031, USD Million
- TABLE 307 LAMEA Aerospace & Defense Market by Country, 2020 - 2023, USD Million
- TABLE 308 LAMEA Aerospace & Defense Market by Country, 2024 - 2031, USD Million
- TABLE 309 LAMEA Food & Beverage Market by Country, 2020 - 2023, USD Million
- TABLE 310 LAMEA Food & Beverage Market by Country, 2024 - 2031, USD Million
- TABLE 311 LAMEA Logistics Market by Country, 2020 - 2023, USD Million
- TABLE 312 LAMEA Logistics Market by Country, 2024 - 2031, USD Million
- TABLE 313 LAMEA Welding, Inspection, & Cleaning Market by Country, 2020 - 2023, USD Million
- TABLE 314 LAMEA Welding, Inspection, & Cleaning Market by Country, 2024 - 2031, USD Million
- TABLE 315 LAMEA Painting Market by Country, 2020 - 2023, USD Million
- TABLE 316 LAMEA Painting Market by Country, 2024 - 2031, USD Million
- TABLE 317 LAMEA Other Application Market by Country, 2020 - 2023, USD Million
- TABLE 318 LAMEA Other Application Market by Country, 2024 - 2031, USD Million
- TABLE 319 LAMEA Vision Guided Robotics Market by Type, 2020 - 2023, USD Million
- TABLE 320 LAMEA Vision Guided Robotics Market by Type, 2024 - 2031, USD Million
- TABLE 321 LAMEA 2D Vision Market by Country, 2020 - 2023, USD Million
- TABLE 322 LAMEA 2D Vision Market by Country, 2024 - 2031, USD Million
- TABLE 323 LAMEA 3D Vision Market by Country, 2020 - 2023, USD Million
- TABLE 324 LAMEA 3D Vision Market by Country, 2024 - 2031, USD Million
- TABLE 325 LAMEA Vision Guided Robotics Market by Component, 2020 - 2023, USD Million
- TABLE 326 LAMEA Vision Guided Robotics Market by Component, 2024 - 2031, USD Million
- TABLE 327 LAMEA Hardware Market by Country, 2020 - 2023, USD Million
- TABLE 328 LAMEA Hardware Market by Country, 2024 - 2031, USD Million
- TABLE 329 LAMEA Software Market by Country, 2020 - 2023, USD Million
- TABLE 330 LAMEA Software Market by Country, 2024 - 2031, USD Million
- TABLE 331 LAMEA Services Market by Country, 2020 - 2023, USD Million
- TABLE 332 LAMEA Services Market by Country, 2024 - 2031, USD Million
- TABLE 333 LAMEA Vision Guided Robotics Market by Country, 2020 - 2023, USD Million
- TABLE 334 LAMEA Vision Guided Robotics Market by Country, 2024 - 2031, USD Million
- TABLE 335 Brazil Vision Guided Robotics Market, 2020 - 2023, USD Million
- TABLE 336 Brazil Vision Guided Robotics Market, 2024 - 2031, USD Million
- TABLE 337 Brazil Vision Guided Robotics Market by Application, 2020 - 2023, USD Million
- TABLE 338 Brazil Vision Guided Robotics Market by Application, 2024 - 2031, USD Million
- TABLE 339 Brazil Vision Guided Robotics Market by Type, 2020 - 2023, USD Million
- TABLE 340 Brazil Vision Guided Robotics Market by Type, 2024 - 2031, USD Million
- TABLE 341 Brazil Vision Guided Robotics Market by Component, 2020 - 2023, USD Million
- TABLE 342 Brazil Vision Guided Robotics Market by Component, 2024 - 2031, USD Million
- TABLE 343 Argentina Vision Guided Robotics Market, 2020 - 2023, USD Million
- TABLE 344 Argentina Vision Guided Robotics Market, 2024 - 2031, USD Million
- TABLE 345 Argentina Vision Guided Robotics Market by Application, 2020 - 2023, USD Million
- TABLE 346 Argentina Vision Guided Robotics Market by Application, 2024 - 2031, USD Million
- TABLE 347 Argentina Vision Guided Robotics Market by Type, 2020 - 2023, USD Million
- TABLE 348 Argentina Vision Guided Robotics Market by Type, 2024 - 2031, USD Million
- TABLE 349 Argentina Vision Guided Robotics Market by Component, 2020 - 2023, USD Million
- TABLE 350 Argentina Vision Guided Robotics Market by Component, 2024 - 2031, USD Million
- TABLE 351 UAE Vision Guided Robotics Market, 2020 - 2023, USD Million
- TABLE 352 UAE Vision Guided Robotics Market, 2024 - 2031, USD Million
- TABLE 353 UAE Vision Guided Robotics Market by Application, 2020 - 2023, USD Million
- TABLE 354 UAE Vision Guided Robotics Market by Application, 2024 - 2031, USD Million
- TABLE 355 UAE Vision Guided Robotics Market by Type, 2020 - 2023, USD Million
- TABLE 356 UAE Vision Guided Robotics Market by Type, 2024 - 2031, USD Million
- TABLE 357 UAE Vision Guided Robotics Market by Component, 2020 - 2023, USD Million
- TABLE 358 UAE Vision Guided Robotics Market by Component, 2024 - 2031, USD Million
- TABLE 359 Saudi Arabia Vision Guided Robotics Market, 2020 - 2023, USD Million
- TABLE 360 Saudi Arabia Vision Guided Robotics Market, 2024 - 2031, USD Million
- TABLE 361 Saudi Arabia Vision Guided Robotics Market by Application, 2020 - 2023, USD Million
- TABLE 362 Saudi Arabia Vision Guided Robotics Market by Application, 2024 - 2031, USD Million
- TABLE 363 Saudi Arabia Vision Guided Robotics Market by Type, 2020 - 2023, USD Million
- TABLE 364 Saudi Arabia Vision Guided Robotics Market by Type, 2024 - 2031, USD Million
- TABLE 365 Saudi Arabia Vision Guided Robotics Market by Component, 2020 - 2023, USD Million
- TABLE 366 Saudi Arabia Vision Guided Robotics Market by Component, 2024 - 2031, USD Million
- TABLE 367 South Africa Vision Guided Robotics Market, 2020 - 2023, USD Million
- TABLE 368 South Africa Vision Guided Robotics Market, 2024 - 2031, USD Million
- TABLE 369 South Africa Vision Guided Robotics Market by Application, 2020 - 2023, USD Million
- TABLE 370 South Africa Vision Guided Robotics Market by Application, 2024 - 2031, USD Million
- TABLE 371 South Africa Vision Guided Robotics Market by Type, 2020 - 2023, USD Million
- TABLE 372 South Africa Vision Guided Robotics Market by Type, 2024 - 2031, USD Million
- TABLE 373 South Africa Vision Guided Robotics Market by Component, 2020 - 2023, USD Million
- TABLE 374 South Africa Vision Guided Robotics Market by Component, 2024 - 2031, USD Million
- TABLE 375 Nigeria Vision Guided Robotics Market, 2020 - 2023, USD Million
- TABLE 376 Nigeria Vision Guided Robotics Market, 2024 - 2031, USD Million
- TABLE 377 Nigeria Vision Guided Robotics Market by Application, 2020 - 2023, USD Million
- TABLE 378 Nigeria Vision Guided Robotics Market by Application, 2024 - 2031, USD Million
- TABLE 379 Nigeria Vision Guided Robotics Market by Type, 2020 - 2023, USD Million
- TABLE 380 Nigeria Vision Guided Robotics Market by Type, 2024 - 2031, USD Million
- TABLE 381 Nigeria Vision Guided Robotics Market by Component, 2020 - 2023, USD Million
- TABLE 382 Nigeria Vision Guided Robotics Market by Component, 2024 - 2031, USD Million
- TABLE 383 Rest of LAMEA Vision Guided Robotics Market, 2020 - 2023, USD Million
- TABLE 384 Rest of LAMEA Vision Guided Robotics Market, 2024 - 2031, USD Million
- TABLE 385 Rest of LAMEA Vision Guided Robotics Market by Application, 2020 - 2023, USD Million
- TABLE 386 Rest of LAMEA Vision Guided Robotics Market by Application, 2024 - 2031, USD Million
- TABLE 387 Rest of LAMEA Vision Guided Robotics Market by Type, 2020 - 2023, USD Million
- TABLE 388 Rest of LAMEA Vision Guided Robotics Market by Type, 2024 - 2031, USD Million
- TABLE 389 Rest of LAMEA Vision Guided Robotics Market by Component, 2020 - 2023, USD Million
- TABLE 390 Rest of LAMEA Vision Guided Robotics Market by Component, 2024 - 2031, USD Million
- TABLE 391 Key Information - Omron Corporation
- TABLE 392 Key Information - Denso Corporation
- TABLE 393 key information - FANUC Corporation
- TABLE 394 Key Information - Hexagon AB
- TABLE 395 Key information - Cognex Corporation
- TABLE 396 Key Information - Basler AG
- TABLE 397 Key Information - ABB Ltd.
- TABLE 398 Key Information - Mitsubishi Electric Corporation
- TABLE 399 Key Information - Kawasaki Heavy Industries, Ltd.
- TABLE 400 Key Information - Qualcomm Incorporated
- TABLE 401 Key Information - Universal Robots A/S
LIST OF FIGURES
- FIG 1 Methodology for the research
- FIG 2 Global Vision Guided Robotics Market, 2020 - 2031, USD Million
- FIG 3 Key Factors Impacting Vision Guided Robotics Market
- FIG 4 Market Share Analysis, 2023
- FIG 5 Porter's Five Forces Analysis - Vision Guided Robotics Market
- FIG 6 Global Vision Guided Robotics Market share by Application, 2023
- FIG 7 Global Vision Guided Robotics Market share by Application, 2031
- FIG 8 Global Vision Guided Robotics Market by Application, 2020 - 2031, USD Million
- FIG 9 Global Vision Guided Robotics Market share by Type, 2023
- FIG 10 Global Vision Guided Robotics Market share by Type, 2031
- FIG 11 Global Vision Guided Robotics Market by Type, 2020 - 2031, USD Million
- FIG 12 Global Vision Guided Robotics Market share by Component, 2023
- FIG 13 Global Vision Guided Robotics Market share by Component, 2031
- FIG 14 Global Vision Guided Robotics Market by Component, 2020 - 2031, USD Million
- FIG 15 Global Vision Guided Robotics Market share by Region, 2023
- FIG 16 Global Vision Guided Robotics Market share by Region, 2031
- FIG 17 Global Vision Guided Robotics Market by Region, 2020 - 2031, USD Million
- FIG 18 Recent strategies and developments: Omron Corporation
- FIG 19 SWOT Analysis: Omron Corporation
- FIG 20 SWOT Analysis: Denso Corporation
- FIG 21 SWOT Analysis: FANUC Corporation
- FIG 22 SWOT Analysis: Hexagon AB
- FIG 23 SWOT Analysis: Cognex Corporation
- FIG 24 SWOT Analysis: Basler AG
- FIG 25 SWOT Analysis: ABB ltd.
- FIG 26 SWOT Analysis: Mitsubishi Electric Corporation
- FIG 27 SWOT Analysis: Kawasaki Heavy Industries, Ltd.
- FIG 28 SWOT Analysis: QUALCOMM Incorporated
- FIG 29 SWOT Analysis: Universal Robots A/S
The Global Vision Guided Robotics Market size is expected to reach $23.40 billion by 2031, rising at a market growth of 7.5% CAGR during the forecast period.
The rising need for automation in drug manufacturing, laboratory testing, and medical device production has significantly contributed to the segment's growth. Vision guided robotics is widely used for precise handling of sensitive materials, quality inspection of medicines, and sterile packaging processes. Therefore, the healthcare & pharmaceutical segment garnered 14% revenue share in the market in 2023. Additionally, the increasing adoption of robotics in surgical procedures and pharmaceutical research has further driven market expansion. The demand for accuracy, efficiency, and compliance with strict regulatory standards continues to propel the use of vision guided robotics in the pharmaceutical and medical sectors.
The demand for automation is also rising in non-traditional sectors like agriculture, construction, and retail, where vision-guided robots are used for tasks such as sorting, inspection, and warehouse automation. In e-commerce fulfilment centers, for example, robotic arms with AI-powered vision systems streamline order picking and packing, reducing turnaround times and improving supply chain efficiency. As automation becomes a key driver of competitiveness, industries increasingly invest in vision-guided robotics to stay ahead in a rapidly evolving market. Furthermore, precision manufacturing is essential in industries like aerospace, medical devices, and pharmaceuticals, where strict compliance with regulatory standards is mandatory. Vision-guided robotics enables manufacturers to achieve near-zero defect rates by conducting continuous, non-contact quality assessments. This capability reduces material waste, enhances customer satisfaction, and strengthens brand reputation by delivering consistently high-quality products. Therefore, the increasing need for quality inspection and precision manufacturing is propelling the market's growth.
However, as industries move toward fully autonomous production environments, simplifying programming and improving interoperability between vision-guided robots and other automation technologies will be critical. Companies increasingly seek user-friendly interfaces and low-code or no-code solutions that reduce reliance on specialized programmers, making adoption more accessible. In conclusion, complexity in programming and integration with existing systems is impeding the market's growth.
Component Outlook
Based on component, the market is characterized into hardware, software, and services. The hardware segment garnered 60% revenue share in the market in 2023. The dominance of this segment is driven by the increasing demand for essential robotic components such as cameras, sensors, processors, and robotic arms. Advanced vision systems, including 3D cameras and LiDAR sensors, are widely integrated into robotics to enhance accuracy and efficiency in industrial automation. Additionally, the growing adoption of AI-powered vision technologies in sectors such as automotive, electronics, and healthcare has fuelled the demand for high-performance hardware solutions. The continuous advancements in imaging technologies and miniaturization of hardware components further contribute to the expansion of this segment.
Type Outlook
By type, the market is categorized into 2D vision and 3D vision. The 3D vision segment held 45% revenue share in the market in 2023. The growing demand for precise object recognition, depth perception, and complex shape analysis has fuelled the adoption of 3D vision systems. These systems offer enhanced capabilities for robotic guidance, bin picking, and autonomous navigation, making them ideal for industries such as automotive, aerospace, and healthcare. The increasing deployment of 3D vision in smart factories and industrial automation, combined with advancements in AI and machine learning, is driving market expansion. Additionally, as industries move towards more sophisticated automation solutions, the demand for 3D vision guided robotics is expected to rise, further bridging the gap with 2D vision technologies.
Application Outlook
On the basis of application, the market is classified into automobile, electrical & electronics, food & beverage, aerospace & defense, healthcare & pharmaceutical, logistics, welding, inspection, & cleaning, painting, and others. The automobile segment acquired 20% revenue share in the market in 2023. The increasing adoption of automation in automotive manufacturing, including assembly lines, welding, painting, and inspection processes, has driven the demand for vision guided robotics. Automakers leverage advanced robotic systems to enhance precision, improve production efficiency, and reduce operational costs. Additionally, the rising demand for electric vehicles (EVs) and autonomous driving technology has further accelerated the integration of vision guided robotics in the automotive sector.
Regional Outlook
Region-wise, the market is analyzed across North America, Europe, Asia Pacific, and LAMEA. The Asia Pacific segment witnessed 36% revenue share in the market in 2023. Rapid industrialization and increasing demand for automation in manufacturing have fuelled market growth in the region. Countries like China, Japan, and South Korea are leading robotics adoption, driven by government initiatives promoting smart manufacturing. The rising need for precision, efficiency, and cost reduction in industries like electronics and logistics has accelerated the adoption of vision guided robotics across Asia Pacific.
Recent Strategies Deployed in the Market
- Dec-2024: ABB Ltd. acquired Swiss start-up Sevensense, integrating its AI-enabled 3D vision navigation and Visual SLAM technology into ABB's AMR portfolio. This move bolsters ABB's leadership in next-generation autonomous mobile robots, enhancing speed, accuracy, and efficiency across industrial applications to drive transformation.
- Apr-2024: Omron Corporation and NEURA Robotics partnered to enhance cognitive robotics in manufacturing. Integrating AI and sensors, their collaboration aims to improve automation, enabling robots to learn, adapt, and perform complex tasks, advancing vision-guided robotics for assembly, inspection, and material handling.
- Sep-2023: Cognex launches In-Sight SnAPP vision sensor, simplifying machine vision with a user-friendly interface and edge learning technology. The sensor enables presence/absence inspections, assembly verification, and defect detection, broadening Cognex's industrial sensor market and significantly boosting overall operational performance in manufacturing.
- Mar-2023: FANUC showcased innovative automated warehouse solutions at Promat 2023, featuring expanded CRX cobots with integrated iRVision sensors. The demos highlighted vision-guided order fulfillment, palletizing, and packing, improving efficiency and addressing labor shortages in warehousing and logistics through robust, intuitive automation.
- Oct-2022: Omron Corporation has introduced the FH-SMD Series 3D Vision Sensor, designed to enhance robot arms with human-like detection for automated picking, assembly, and inspection. This compact, lightweight sensor enables fast, accurate 3D recognition in just 0.4 seconds, improving efficiency and flexibility in industrial automation. Its easy setup and ability to detect randomly placed parts reduce blind spots, addressing labor shortages and enhancing productivity. With this launch, Omron continues to drive innovation in vision-guided robotics for manufacturing applications.
List of Key Companies Profiled
- Omron Corporation
- DENSO CORPORATION
- FANUC Corporation
- Hexagon AB
- Cognex Corporation
- Basler AG
- ABB Ltd.
- Mitsubishi Electric Corporation
- Kawasaki Heavy Industries, Ltd.
- Qualcomm Incorporated (Qualcomm Technologies, Inc.)
Global Vision Guided Robotics Market Report Segmentation
By Application
- Automobile
- Electrical & Electronics
- Healthcare & Pharmaceutical
- Aerospace & Defense
- Food & Beverage
- Logistics
- Welding, Inspection, & Cleaning
- Painting
- Other Application
By Type
- 2D Vision
- 3D Vision
By Component
- Hardware
- Software
- Services
By Geography
- North America
- US
- Canada
- Mexico
- Rest of North America
- Europe
- Germany
- UK
- France
- Russia
- Spain
- Italy
- Rest of Europe
- Asia Pacific
- China
- Japan
- India
- South Korea
- Singapore
- Malaysia
- Rest of Asia Pacific
- LAMEA
- Brazil
- Argentina
- UAE
- Saudi Arabia
- South Africa
- Nigeria
- Rest of LAMEA
Table of Contents
Chapter 1. Market Scope & Methodology
- 1.1 Market Definition
- 1.2 Objectives
- 1.3 Market Scope
- 1.4 Segmentation
- 1.4.1 Global Vision Guided Robotics Market, by Application
- 1.4.2 Global Vision Guided Robotics Market, by Type
- 1.4.3 Global Vision Guided Robotics Market, by Component
- 1.4.4 Global Vision Guided Robotics Market, by Geography
- 1.5 Methodology for the research
Chapter 2. Market at a Glance
- 2.1 Key Highlights
Chapter 3. Market Overview
- 3.1 Introduction
- 3.1.1 Overview
- 3.1.1.1 Market Composition and Scenario
- 3.1.1 Overview
- 3.2 Key Factors Impacting the Market
- 3.2.1 Market Drivers
- 3.2.2 Market Restraints
- 3.2.3 Market Opportunities
- 3.2.4 Market Challenges
Chapter 4. Competition Analysis - Global
- 4.1 Market Share Analysis, 2023
- 4.2 Strategies Deployed in Vision Guided Robotics Market
- 4.3 Porter Five Forces Analysis
Chapter 5. Global Vision Guided Robotics Market by Application
- 5.1 Global Automobile Market by Region
- 5.2 Global Electrical & Electronics Market by Region
- 5.3 Global Healthcare & Pharmaceutical Market by Region
- 5.4 Global Aerospace & Defense Market by Region
- 5.5 Global Food & Beverage Market by Region
- 5.6 Global Logistics Market by Region
- 5.7 Global Welding, Inspection, & Cleaning Market by Region
- 5.8 Global Painting Market by Region
- 5.9 Global Other Application Market by Region
Chapter 6. Global Vision Guided Robotics Market by Type
- 6.1 Global 2D Vision Market by Region
- 6.2 Global 3D Vision Market by Region
Chapter 7. Global Vision Guided Robotics Market by Component
- 7.1 Global Hardware Market by Region
- 7.2 Global Software Market by Region
- 7.3 Global Services Market by Region
Chapter 8. Global Vision Guided Robotics Market by Region
- 8.1 North America Vision Guided Robotics Market
- 8.1.1 North America Vision Guided Robotics Market by Application
- 8.1.1.1 North America Automobile Market by Country
- 8.1.1.2 North America Electrical & Electronics Market by Country
- 8.1.1.3 North America Healthcare & Pharmaceutical Market by Country
- 8.1.1.4 North America Aerospace & Defense Market by Country
- 8.1.1.5 North America Food & Beverage Market by Country
- 8.1.1.6 North America Logistics Market by Country
- 8.1.1.7 North America Welding, Inspection, & Cleaning Market by Country
- 8.1.1.8 North America Painting Market by Country
- 8.1.1.9 North America Other Application Market by Country
- 8.1.2 North America Vision Guided Robotics Market by Type
- 8.1.2.1 North America 2D Vision Market by Country
- 8.1.2.2 North America 3D Vision Market by Country
- 8.1.3 North America Vision Guided Robotics Market by Component
- 8.1.3.1 North America Hardware Market by Country
- 8.1.3.2 North America Software Market by Country
- 8.1.3.3 North America Services Market by Country
- 8.1.4 North America Vision Guided Robotics Market by Country
- 8.1.4.1 US Vision Guided Robotics Market
- 8.1.4.1.1 US Vision Guided Robotics Market by Application
- 8.1.4.1.2 US Vision Guided Robotics Market by Type
- 8.1.4.1.3 US Vision Guided Robotics Market by Component
- 8.1.4.2 Canada Vision Guided Robotics Market
- 8.1.4.2.1 Canada Vision Guided Robotics Market by Application
- 8.1.4.2.2 Canada Vision Guided Robotics Market by Type
- 8.1.4.2.3 Canada Vision Guided Robotics Market by Component
- 8.1.4.3 Mexico Vision Guided Robotics Market
- 8.1.4.3.1 Mexico Vision Guided Robotics Market by Application
- 8.1.4.3.2 Mexico Vision Guided Robotics Market by Type
- 8.1.4.3.3 Mexico Vision Guided Robotics Market by Component
- 8.1.4.4 Rest of North America Vision Guided Robotics Market
- 8.1.4.4.1 Rest of North America Vision Guided Robotics Market by Application
- 8.1.4.4.2 Rest of North America Vision Guided Robotics Market by Type
- 8.1.4.4.3 Rest of North America Vision Guided Robotics Market by Component
- 8.1.4.1 US Vision Guided Robotics Market
- 8.1.1 North America Vision Guided Robotics Market by Application
- 8.2 Europe Vision Guided Robotics Market
- 8.2.1 Europe Vision Guided Robotics Market by Application
- 8.2.1.1 Europe Automobile Market by Country
- 8.2.1.2 Europe Electrical & Electronics Market by Country
- 8.2.1.3 Europe Healthcare & Pharmaceutical Market by Country
- 8.2.1.4 Europe Aerospace & Defense Market by Country
- 8.2.1.5 Europe Food & Beverage Market by Country
- 8.2.1.6 Europe Logistics Market by Country
- 8.2.1.7 Europe Welding, Inspection, & Cleaning Market by Country
- 8.2.1.8 Europe Painting Market by Country
- 8.2.1.9 Europe Other Application Market by Country
- 8.2.2 Europe Vision Guided Robotics Market by Type
- 8.2.2.1 Europe 2D Vision Market by Country
- 8.2.2.2 Europe 3D Vision Market by Country
- 8.2.3 Europe Vision Guided Robotics Market by Component
- 8.2.3.1 Europe Hardware Market by Country
- 8.2.3.2 Europe Software Market by Country
- 8.2.3.3 Europe Services Market by Country
- 8.2.4 Europe Vision Guided Robotics Market by Country
- 8.2.4.1 Germany Vision Guided Robotics Market
- 8.2.4.1.1 Germany Vision Guided Robotics Market by Application
- 8.2.4.1.2 Germany Vision Guided Robotics Market by Type
- 8.2.4.1.3 Germany Vision Guided Robotics Market by Component
- 8.2.4.2 UK Vision Guided Robotics Market
- 8.2.4.2.1 UK Vision Guided Robotics Market by Application
- 8.2.4.2.2 UK Vision Guided Robotics Market by Type
- 8.2.4.2.3 UK Vision Guided Robotics Market by Component
- 8.2.4.3 France Vision Guided Robotics Market
- 8.2.4.3.1 France Vision Guided Robotics Market by Application
- 8.2.4.3.2 France Vision Guided Robotics Market by Type
- 8.2.4.3.3 France Vision Guided Robotics Market by Component
- 8.2.4.4 Russia Vision Guided Robotics Market
- 8.2.4.4.1 Russia Vision Guided Robotics Market by Application
- 8.2.4.4.2 Russia Vision Guided Robotics Market by Type
- 8.2.4.4.3 Russia Vision Guided Robotics Market by Component
- 8.2.4.5 Spain Vision Guided Robotics Market
- 8.2.4.5.1 Spain Vision Guided Robotics Market by Application
- 8.2.4.5.2 Spain Vision Guided Robotics Market by Type
- 8.2.4.5.3 Spain Vision Guided Robotics Market by Component
- 8.2.4.6 Italy Vision Guided Robotics Market
- 8.2.4.6.1 Italy Vision Guided Robotics Market by Application
- 8.2.4.6.2 Italy Vision Guided Robotics Market by Type
- 8.2.4.6.3 Italy Vision Guided Robotics Market by Component
- 8.2.4.7 Rest of Europe Vision Guided Robotics Market
- 8.2.4.7.1 Rest of Europe Vision Guided Robotics Market by Application
- 8.2.4.7.2 Rest of Europe Vision Guided Robotics Market by Type
- 8.2.4.7.3 Rest of Europe Vision Guided Robotics Market by Component
- 8.2.4.1 Germany Vision Guided Robotics Market
- 8.2.1 Europe Vision Guided Robotics Market by Application
- 8.3 Asia Pacific Vision Guided Robotics Market
- 8.3.1 Asia Pacific Vision Guided Robotics Market by Application
- 8.3.1.1 Asia Pacific Automobile Market by Country
- 8.3.1.2 Asia Pacific Electrical & Electronics Market by Country
- 8.3.1.3 Asia Pacific Healthcare & Pharmaceutical Market by Country
- 8.3.1.4 Asia Pacific Aerospace & Defense Market by Country
- 8.3.1.5 Asia Pacific Food & Beverage Market by Country
- 8.3.1.6 Asia Pacific Logistics Market by Country
- 8.3.1.7 Asia Pacific Welding, Inspection, & Cleaning Market by Country
- 8.3.1.8 Asia Pacific Painting Market by Country
- 8.3.1.9 Asia Pacific Other Application Market by Country
- 8.3.2 Asia Pacific Vision Guided Robotics Market by Type
- 8.3.2.1 Asia Pacific 2D Vision Market by Country
- 8.3.2.2 Asia Pacific 3D Vision Market by Country
- 8.3.3 Asia Pacific Vision Guided Robotics Market by Component
- 8.3.3.1 Asia Pacific Hardware Market by Country
- 8.3.3.2 Asia Pacific Software Market by Country
- 8.3.3.3 Asia Pacific Services Market by Country
- 8.3.4 Asia Pacific Vision Guided Robotics Market by Country
- 8.3.4.1 China Vision Guided Robotics Market
- 8.3.4.1.1 China Vision Guided Robotics Market by Application
- 8.3.4.1.2 China Vision Guided Robotics Market by Type
- 8.3.4.1.3 China Vision Guided Robotics Market by Component
- 8.3.4.2 Japan Vision Guided Robotics Market
- 8.3.4.2.1 Japan Vision Guided Robotics Market by Application
- 8.3.4.2.2 Japan Vision Guided Robotics Market by Type
- 8.3.4.2.3 Japan Vision Guided Robotics Market by Component
- 8.3.4.3 India Vision Guided Robotics Market
- 8.3.4.3.1 India Vision Guided Robotics Market by Application
- 8.3.4.3.2 India Vision Guided Robotics Market by Type
- 8.3.4.3.3 India Vision Guided Robotics Market by Component
- 8.3.4.4 South Korea Vision Guided Robotics Market
- 8.3.4.4.1 South Korea Vision Guided Robotics Market by Application
- 8.3.4.4.2 South Korea Vision Guided Robotics Market by Type
- 8.3.4.4.3 South Korea Vision Guided Robotics Market by Component
- 8.3.4.5 Singapore Vision Guided Robotics Market
- 8.3.4.5.1 Singapore Vision Guided Robotics Market by Application
- 8.3.4.5.2 Singapore Vision Guided Robotics Market by Type
- 8.3.4.5.3 Singapore Vision Guided Robotics Market by Component
- 8.3.4.6 Malaysia Vision Guided Robotics Market
- 8.3.4.6.1 Malaysia Vision Guided Robotics Market by Application
- 8.3.4.6.2 Malaysia Vision Guided Robotics Market by Type
- 8.3.4.6.3 Malaysia Vision Guided Robotics Market by Component
- 8.3.4.7 Rest of Asia Pacific Vision Guided Robotics Market
- 8.3.4.7.1 Rest of Asia Pacific Vision Guided Robotics Market by Application
- 8.3.4.7.2 Rest of Asia Pacific Vision Guided Robotics Market by Type
- 8.3.4.7.3 Rest of Asia Pacific Vision Guided Robotics Market by Component
- 8.3.4.1 China Vision Guided Robotics Market
- 8.3.1 Asia Pacific Vision Guided Robotics Market by Application
- 8.4 LAMEA Vision Guided Robotics Market
- 8.4.1 LAMEA Vision Guided Robotics Market by Application
- 8.4.1.1 LAMEA Automobile Market by Country
- 8.4.1.2 LAMEA Electrical & Electronics Market by Country
- 8.4.1.3 LAMEA Healthcare & Pharmaceutical Market by Country
- 8.4.1.4 LAMEA Aerospace & Defense Market by Country
- 8.4.1.5 LAMEA Food & Beverage Market by Country
- 8.4.1.6 LAMEA Logistics Market by Country
- 8.4.1.7 LAMEA Welding, Inspection, & Cleaning Market by Country
- 8.4.1.8 LAMEA Painting Market by Country
- 8.4.1.9 LAMEA Other Application Market by Country
- 8.4.2 LAMEA Vision Guided Robotics Market by Type
- 8.4.2.1 LAMEA 2D Vision Market by Country
- 8.4.2.2 LAMEA 3D Vision Market by Country
- 8.4.3 LAMEA Vision Guided Robotics Market by Component
- 8.4.3.1 LAMEA Hardware Market by Country
- 8.4.3.2 LAMEA Software Market by Country
- 8.4.3.3 LAMEA Services Market by Country
- 8.4.4 LAMEA Vision Guided Robotics Market by Country
- 8.4.4.1 Brazil Vision Guided Robotics Market
- 8.4.4.1.1 Brazil Vision Guided Robotics Market by Application
- 8.4.4.1.2 Brazil Vision Guided Robotics Market by Type
- 8.4.4.1.3 Brazil Vision Guided Robotics Market by Component
- 8.4.4.2 Argentina Vision Guided Robotics Market
- 8.4.4.2.1 Argentina Vision Guided Robotics Market by Application
- 8.4.4.2.2 Argentina Vision Guided Robotics Market by Type
- 8.4.4.2.3 Argentina Vision Guided Robotics Market by Component
- 8.4.4.3 UAE Vision Guided Robotics Market
- 8.4.4.3.1 UAE Vision Guided Robotics Market by Application
- 8.4.4.3.2 UAE Vision Guided Robotics Market by Type
- 8.4.4.3.3 UAE Vision Guided Robotics Market by Component
- 8.4.4.4 Saudi Arabia Vision Guided Robotics Market
- 8.4.4.4.1 Saudi Arabia Vision Guided Robotics Market by Application
- 8.4.4.4.2 Saudi Arabia Vision Guided Robotics Market by Type
- 8.4.4.4.3 Saudi Arabia Vision Guided Robotics Market by Component
- 8.4.4.5 South Africa Vision Guided Robotics Market
- 8.4.4.5.1 South Africa Vision Guided Robotics Market by Application
- 8.4.4.5.2 South Africa Vision Guided Robotics Market by Type
- 8.4.4.5.3 South Africa Vision Guided Robotics Market by Component
- 8.4.4.6 Nigeria Vision Guided Robotics Market
- 8.4.4.6.1 Nigeria Vision Guided Robotics Market by Application
- 8.4.4.6.2 Nigeria Vision Guided Robotics Market by Type
- 8.4.4.6.3 Nigeria Vision Guided Robotics Market by Component
- 8.4.4.7 Rest of LAMEA Vision Guided Robotics Market
- 8.4.4.7.1 Rest of LAMEA Vision Guided Robotics Market by Application
- 8.4.4.7.2 Rest of LAMEA Vision Guided Robotics Market by Type
- 8.4.4.7.3 Rest of LAMEA Vision Guided Robotics Market by Component
- 8.4.4.1 Brazil Vision Guided Robotics Market
- 8.4.1 LAMEA Vision Guided Robotics Market by Application
Chapter 9. Company Profiles
- 9.1 Omron Corporation
- 9.1.1 Company Overview
- 9.1.2 Financial Analysis
- 9.1.3 Segmental and Regional Analysis
- 9.1.4 Research & Development Expenses
- 9.1.5 Recent strategies and developments:
- 9.1.5.1 Partnerships, Collaborations, and Agreements:
- 9.1.5.2 Product Launches and Product Expansions:
- 9.1.6 SWOT Analysis
- 9.2 Denso Corporation
- 9.2.1 Company Overview
- 9.2.2 Financial Analysis
- 9.2.3 Regional Analysis
- 9.2.4 Research & Development Expense
- 9.2.5 SWOT Analysis
- 9.3 FANUC Corporation
- 9.3.1 Company Overview
- 9.3.2 Financial Analysis
- 9.3.3 Regional Analysis
- 9.3.4 Recent strategies and developments:
- 9.3.4.1 Product Launches and Product Expansions:
- 9.3.5 SWOT Analysis
- 9.4 Hexagon AB
- 9.4.1 Company Overview
- 9.4.2 Financial Analysis
- 9.4.3 Regional & Segmental Analysis
- 9.4.4 Research & Development Expenses
- 9.4.5 SWOT Analysis
- 9.5 Cognex Corporation
- 9.5.1 Company Overview
- 9.5.2 Financial Analysis
- 9.5.3 Segmental and Regional Analysis
- 9.5.4 Research & Development Expenses
- 9.5.5 Recent strategies and developments:
- 9.5.5.1 Product Launches and Product Expansions:
- 9.5.6 SWOT Analysis
- 9.6 Basler AG
- 9.6.1 Company Overview
- 9.6.2 Financial Analysis
- 9.6.3 Segmental and Regional Analysis
- 9.6.4 Research & Development Expenses
- 9.6.5 SWOT Analysis
- 9.7 ABB Ltd.
- 9.7.1 Company Overview
- 9.7.2 Financial Analysis
- 9.7.3 Segmental and Regional Analysis
- 9.7.4 Research & Development Expense
- 9.7.5 Recent strategies and developments:
- 9.7.5.1 Acquisition and Mergers:
- 9.7.6 SWOT Analysis
- 9.8 Mitsubishi Electric Corporation
- 9.8.1 Company Overview
- 9.8.2 Financial Analysis
- 9.8.3 Segmental and Regional Analysis
- 9.8.4 Research & Development Expense
- 9.8.5 SWOT Analysis
- 9.9 Kawasaki Heavy Industries Ltd.
- 9.9.1 Company Overview
- 9.9.2 Financial Analysis
- 9.9.3 Segmental and Regional Analysis
- 9.9.4 Research & Development Expense
- 9.9.5 SWOT Analysis
- 9.10. Qualcomm Incorporated (Qualcomm Technologies, Inc.)
- 9.10.1 Company Overview
- 9.10.2 Financial Analysis
- 9.10.3 Segmental and Regional Analysis
- 9.10.4 Research & Development Expense
- 9.10.5 SWOT Analysis
- 9.11 Universal Robots A/S (Teradyne, Inc.)
- 9.11.1 Company Overview
- 9.11.2 Financial Analysis
- 9.11.3 Segmental and Regional Analysis
- 9.11.4 SWOT Analysis

