|
|
市場調査レポート
商品コード
1405231
抗体治療薬の世界市場規模、シェア、動向分析レポート:投与経路別、フォーマット別、由来別、エンドユーザー別、疾患領域別、地域別展望および予測、2023年~2030年Global Antibody Therapeutics Market Size, Share & Trends Analysis Report By Route of Administration (Intravenous, Subcutaneous, and Others), By Format, By Source, By End User, By Disease Areas, By Regional Outlook and Forecast, 2023 - 2030 |
||||||

|
|||||||
|
|||||||

| 抗体治療薬の世界市場規模、シェア、動向分析レポート:投与経路別、フォーマット別、由来別、エンドユーザー別、疾患領域別、地域別展望および予測、2023年~2030年 |
|
出版日: 2024年01月05日
発行: KBV Research
ページ情報: 英文 425 Pages
納期: 即納可能
|

全表示
- 概要
- 図表
- 目次
抗体治療薬市場規模は2030年までに6,313億米ドルに達すると予測され、予測期間中のCAGRは14.4%の市場成長率で上昇します。
さらに、パンデミックは世界のサプライチェーンの脆弱性を浮き彫りにし、抗体治療薬を中心とした医薬品の開発と流通に影響を与えました。サプライチェーンの混乱、重要な原材料の不足、物流の課題は、抗体治療薬品の製造とデリバリーに影響を与えました。モノクローナル抗体は、基礎疾患を持つ人や感染者と密接に接触している人など、COVID-19への曝露リスクが高い人への予防的使用にも展開されました。ファイザー・バイオNTech社やModerna社が開発したようなmRNAワクチンの成功により、核酸ベースの治療法に注目が移った。COVID-19の抗体治療薬を含む感染症研究への注目度が高まる一方で、他の治療分野では優先順位や資源配分の変化が見られました。そのため、COVID-19のパンデミックは市場に緩やかな影響を与えました。
しかし、抗体治療薬の研究開発には前臨床試験、臨床試験、製造費用など多額の費用がかかります。特に小規模のバイオテクノロジー企業にとっては、多額の投資が障壁となり、新規抗体の上市を阻む可能性があります。抗体開発に伴う経済的負担は、すでに確立された標的や治療領域に焦点を当てることにつながり、大きなアンメット・メディカル・ニーズのある領域での探索を制限する可能性があります。このような開発パイプラインの革新性や多様性の低下は、画期的な治療法の発見を妨げる可能性があります。抗体治療薬の開発コストが高いことも、市場の成長を妨げる大きな課題です。
投与経路別の展望
投与経路別に見ると、市場は静脈内投与、皮下投与、その他に分けられます。2022年には、静脈内投与セグメントが最大の収益シェアを占めて市場を独占しました。静脈内投与は、抗体治療薬の迅速かつ完全なバイオアベイラビリティを保証します。この経路では、吸収率に影響を及ぼす可能性のある消化管などの障壁を避けて、薬物が直接血流に入る。静脈内投与は、正確な投与と投与速度の制御を可能にします。ヘルスケア専門家は、血流中の治療レベルを達成するために点滴速度を注意深く調節することができ、抗体治療薬の有効性を最適化することができます。静脈内投与は、抗体治療薬に即効性をもたらします。これは、急性疾患や緊急事態の治療など、迅速な治療効果が必要な場合に極めて重要です。
フォーマット別展望
市場は形式別に、モノクローナル抗体、ポリクローナル抗体療法、二重特異性抗体、抗体フラグメント、その他に分類されます。抗体フラグメントセグメントは、2022年の市場において有望な成長率を確保しました。抗体フラグメントは通常、全長抗体と比較して循環系からのクリアランスが速いです。この迅速なクリアランスは、迅速な作用発現や半減期の短縮が望まれる場合に有益であり、治療効果のタイミングや持続時間をよりコントロールしやすくなります。抗体フラグメントは画像診断用途に広く使用されています。サイズが小さいため、非標的組織からのクリアランスが早く、画像コントラストが向上します。単光子放射断層撮影法(SPECT)や陽電子放射断層撮影法(PET)では、放射性標識抗体フラグメントが頻繁に使用されています。抗体フラグメントは、標的を絞った局所的な免疫抑制が望まれる自己免疫疾患における治療応用が検討されています。
由来別展望
由来別に見ると、市場はヒト、ヒト化、キメラ、その他に区分されます。2022年には、ヒト型が市場で最大の売上シェアを記録しました。遺伝子工学、モノクローナル抗体作製、新規ドラッグデリバリーシステムなど、ヒトの技術革新と技術の進歩は、より効果的で標的を絞った抗体療法の創出に貢献しています。ヘルスケア専門家、患者、一般市民を対象に、抗体治療薬の利点や利用可能性について啓蒙する人間の努力は、抗体治療薬の受容と利用に貢献しています。ヒトは、抗体治療薬の有効性と安全性を検証する臨床試験に参加します。その参加は、開発プロセスや規制当局の承認に役立つ貴重なデータを生み出します。
エンドユーザー別展望
エンドユーザー別に見ると、市場は病院、介護施設、その他に細分化されます。長期介護施設セグメントは、2022年の市場でかなりの収益シェアを占めています。長期療養施設は高齢化社会に対応していることが多く、特定の種類のがん、関節リウマチ、神経変性疾患など、抗体治療薬が有効な疾患に罹患しやすいです。長期療養施設における抗体治療薬の使用は、入院率を低下させる可能性があります。これは、病院への通院が困難であったり、入院による合併症のリスクが高い入居者にとっては特に重要です。抗体治療薬、特にモノクローナル抗体は感染症を予防・管理することができます。これらの治療薬は、感染症に罹患しやすい可能性のある長期療養環境において、全体的な健康維持をサポートすることができます。
疾患領域別展望
疾患領域別に見ると、市場は自己免疫・炎症性疾患、腫瘍、血液、感染症、骨、免疫、神経、その他に分類されます。2022年の市場では、腫瘍分野が有望な成長率を示しました。抗体治療薬は、化学療法、標的療法、放射線療法などの他のがん治療と併用されることが多いです。コンビナトリアル・アプローチは、治療効果を最大化し、がん生物学の複数の側面に対処することを目的としています。抗体治療薬は、様々なリンパ腫や白血病を含む血液がんの治療に有効であることが証明されています。リツキシマブやアレムツズマブなどのモノクローナル抗体は、がん細胞上の特定のマーカーを標的とし、治療成績の向上につながります。放射性免疫療法では、放射性同位元素で標識した抗体を用いて、がん細胞に選択的に放射線を照射します。イブリツモマブ、チウキセタン、トシツモマブは特定のリンパ腫に使用される放射免疫療法の例です。
地域別展望
地域別に見ると、市場は北米、欧州、アジア太平洋、LAMEAで分析されます。2022年には、北米地域が最も高い収益シェアを獲得して市場をリードしました。北米、特に米国は、活気に満ちた確立された医薬品研究開発エコシステムの本拠地です。北米は臨床試験の世界の拠点であり、大規模かつ多様な試験を実施するための強固なインフラを提供しています。北米の人口は、関節リウマチ、乾癬、炎症性腸疾患のような自己免疫疾患の有病率が比較的高いです。
抗体治療薬市場で展開されている戦略。
目次
第1章 市場範囲と調査手法
- 市場の定義
- 目的
- 市場範囲
- セグメンテーション
- 調査手法
第2章 市場要覧
- 主なハイライト
第3章 市場概要
- イントロダクション
- 概要
- 市場構成とシナリオ
- 概要
- 市場に影響を与える主な要因
- 市場促進要因
- 市場抑制要因
- ポーターファイブフォース分析
第4章 抗体治療薬市場に展開される戦略。
第5章 世界市場:投与経路別
- 世界の点滴市場:地域別
- 世界の皮下市場:地域別
- 世界のその他の市場:地域別
第6章 世界市場:フォーマット別
- 世界のモノクローナル抗体市場:地域別
- 世界のポリクローナル抗体治療市場:地域別
- 世界の二重特異性抗体市場:地域別
- 世界の抗体フラグメントおよびその他の市場:地域別
第7章 世界市場:由来別
- 世界の人間市場:地域別
- 世界の人間化市場:地域別
- 世界のキメラ市場:地域別
- 世界のその他の市場:地域別
第8章 世界市場:エンドユーザー別
- 世界の病院市場:地域別
- 世界の介護施設市場:地域別
- 世界のその他の市場:地域別
第9章 世界市場:疾患領域別
- 世界の自己免疫および炎症性疾患市場:地域別
- 世界の神経学市場:地域別
- 世界の骨学市場:地域別
- 世界の血液学市場:地域別
- 世界の腫瘍学市場:地域別
- 世界の感染症市場:地域別
- 世界の免疫学市場:地域別
- 世界のその他の市場:地域別
第10章 世界市場:地域別
- 北米
- 北米の市場:国別
- 米国
- カナダ
- メキシコ
- その他北米地域
- 北米の市場:国別
- 欧州
- 欧州の市場:国別
- ドイツ
- 英国
- フランス
- ロシア
- スペイン
- イタリア
- その他欧州地域
- 欧州の市場:国別
- アジア太平洋
- アジア太平洋の市場:国別
- 中国
- 日本
- インド
- 韓国
- シンガポール
- マレーシア
- その他アジア太平洋地域
- アジア太平洋の市場:国別
- ラテンアメリカ・中東・アフリカ
- ラテンアメリカ・中東・アフリカの市場:国別
- ブラジル
- アルゼンチン
- アラブ首長国連邦
- サウジアラビア
- 南アフリカ
- ナイジェリア
- その他ラテンアメリカ・中東・アフリカ地域
- ラテンアメリカ・中東・アフリカの市場:国別
第11章 企業プロファイル
- F Hoffmann-La Roche Ltd.
- AbbVie, Inc
- Johnson & Johnson(Johnson & Johnson Services, Inc)
- Merck KGaA
- Bristol Myers Squibb Company
- AstraZeneca PLC
- Sanofi SA
- Novartis AG
- Biogen, Inc
- Amgen, Inc
第12章 市場の成功必須条件
LIST OF TABLES
- TABLE 1 Global Antibody Therapeutics Market, 2019 - 2022, USD Million
- TABLE 2 Global Antibody Therapeutics Market, 2023 - 2030, USD Million
- TABLE 3 Global Antibody Therapeutics Market by Route of Administration, 2019 - 2022, USD Million
- TABLE 4 Global Antibody Therapeutics Market by Route of Administration, 2023 - 2030, USD Million
- TABLE 5 Global Intravenous Market by Region, 2019 - 2022, USD Million
- TABLE 6 Global Intravenous Market by Region, 2023 - 2030, USD Million
- TABLE 7 Global Subcutaneous Market by Region, 2019 - 2022, USD Million
- TABLE 8 Global Subcutaneous Market by Region, 2023 - 2030, USD Million
- TABLE 9 Global Others Market by Region, 2019 - 2022, USD Million
- TABLE 10 Global Others Market by Region, 2023 - 2030, USD Million
- TABLE 11 Global Antibody Therapeutics Market by Format, 2019 - 2022, USD Million
- TABLE 12 Global Antibody Therapeutics Market by Format, 2023 - 2030, USD Million
- TABLE 13 Global Monoclonal Antibody Market by Region, 2019 - 2022, USD Million
- TABLE 14 Global Monoclonal Antibody Market by Region, 2023 - 2030, USD Million
- TABLE 15 Global Polyclonal Antibody Therapy Market by Region, 2019 - 2022, USD Million
- TABLE 16 Global Polyclonal Antibody Therapy Market by Region, 2023 - 2030, USD Million
- TABLE 17 Global Bispecific Antibody Market by Region, 2019 - 2022, USD Million
- TABLE 18 Global Bispecific Antibody Market by Region, 2023 - 2030, USD Million
- TABLE 19 Global Antibody fragment & Others Market by Region, 2019 - 2022, USD Million
- TABLE 20 Global Antibody fragment & Others Market by Region, 2023 - 2030, USD Million
- TABLE 21 Global Antibody Therapeutics Market by Source, 2019 - 2022, USD Million
- TABLE 22 Global Antibody Therapeutics Market by Source, 2023 - 2030, USD Million
- TABLE 23 Global Human Market by Region, 2019 - 2022, USD Million
- TABLE 24 Global Human Market by Region, 2023 - 2030, USD Million
- TABLE 25 Global Humanized Market by Region, 2019 - 2022, USD Million
- TABLE 26 Global Humanized Market by Region, 2023 - 2030, USD Million
- TABLE 27 Global Chimeric Market by Region, 2019 - 2022, USD Million
- TABLE 28 Global Chimeric Market by Region, 2023 - 2030, USD Million
- TABLE 29 Global Others Market by Region, 2019 - 2022, USD Million
- TABLE 30 Global Others Market by Region, 2023 - 2030, USD Million
- TABLE 31 Global Antibody Therapeutics Market by End User, 2019 - 2022, USD Million
- TABLE 32 Global Antibody Therapeutics Market by End User, 2023 - 2030, USD Million
- TABLE 33 Global Hospitals Market by Region, 2019 - 2022, USD Million
- TABLE 34 Global Hospitals Market by Region, 2023 - 2030, USD Million
- TABLE 35 Global Long-term care facilities Market by Region, 2019 - 2022, USD Million
- TABLE 36 Global Long-term care facilities Market by Region, 2023 - 2030, USD Million
- TABLE 37 Global Others Market by Region, 2019 - 2022, USD Million
- TABLE 38 Global Others Market by Region, 2023 - 2030, USD Million
- TABLE 39 Global Antibody Therapeutics Market by Disease Areas, 2019 - 2022, USD Million
- TABLE 40 Global Antibody Therapeutics Market by Disease Areas, 2023 - 2030, USD Million
- TABLE 41 Global Autoimmune & Inflammatory Diseases Market by Region, 2019 - 2022, USD Million
- TABLE 42 Global Autoimmune & Inflammatory Diseases Market by Region, 2023 - 2030, USD Million
- TABLE 43 Global Neurology Market by Region, 2019 - 2022, USD Million
- TABLE 44 Global Neurology Market by Region, 2023 - 2030, USD Million
- TABLE 45 Global Osteology Market by Region, 2019 - 2022, USD Million
- TABLE 46 Global Osteology Market by Region, 2023 - 2030, USD Million
- TABLE 47 Global Hematology Market by Region, 2019 - 2022, USD Million
- TABLE 48 Global Hematology Market by Region, 2023 - 2030, USD Million
- TABLE 49 Global Oncology Market by Region, 2019 - 2022, USD Million
- TABLE 50 Global Oncology Market by Region, 2023 - 2030, USD Million
- TABLE 51 Global Infectious Diseases Market by Region, 2019 - 2022, USD Million
- TABLE 52 Global Infectious Diseases Market by Region, 2023 - 2030, USD Million
- TABLE 53 Global Immunology Market by Region, 2019 - 2022, USD Million
- TABLE 54 Global Immunology Market by Region, 2023 - 2030, USD Million
- TABLE 55 Global Others Market by Region, 2019 - 2022, USD Million
- TABLE 56 Global Others Market by Region, 2023 - 2030, USD Million
- TABLE 57 Global Antibody Therapeutics Market by Region, 2019 - 2022, USD Million
- TABLE 58 Global Antibody Therapeutics Market by Region, 2023 - 2030, USD Million
- TABLE 59 North America Antibody Therapeutics Market, 2019 - 2022, USD Million
- TABLE 60 North America Antibody Therapeutics Market, 2023 - 2030, USD Million
- TABLE 61 North America Antibody Therapeutics Market by Route of Administration, 2019 - 2022, USD Million
- TABLE 62 North America Antibody Therapeutics Market by Route of Administration, 2023 - 2030, USD Million
- TABLE 63 North America Intravenous Market by Country, 2019 - 2022, USD Million
- TABLE 64 North America Intravenous Market by Country, 2023 - 2030, USD Million
- TABLE 65 North America Subcutaneous Market by Country, 2019 - 2022, USD Million
- TABLE 66 North America Subcutaneous Market by Country, 2023 - 2030, USD Million
- TABLE 67 North America Others Market by Country, 2019 - 2022, USD Million
- TABLE 68 North America Others Market by Country, 2023 - 2030, USD Million
- TABLE 69 North America Antibody Therapeutics Market by Format, 2019 - 2022, USD Million
- TABLE 70 North America Antibody Therapeutics Market by Format, 2023 - 2030, USD Million
- TABLE 71 North America Monoclonal Antibody Market by Country, 2019 - 2022, USD Million
- TABLE 72 North America Monoclonal Antibody Market by Country, 2023 - 2030, USD Million
- TABLE 73 North America Polyclonal Antibody Therapy Market by Country, 2019 - 2022, USD Million
- TABLE 74 North America Polyclonal Antibody Therapy Market by Country, 2023 - 2030, USD Million
- TABLE 75 North America Bispecific Antibody Market by Country, 2019 - 2022, USD Million
- TABLE 76 North America Bispecific Antibody Market by Country, 2023 - 2030, USD Million
- TABLE 77 North America Antibody fragment & Others Market by Country, 2019 - 2022, USD Million
- TABLE 78 North America Antibody fragment & Others Market by Country, 2023 - 2030, USD Million
- TABLE 79 North America Antibody Therapeutics Market by Source, 2019 - 2022, USD Million
- TABLE 80 North America Antibody Therapeutics Market by Source, 2023 - 2030, USD Million
- TABLE 81 North America Human Market by Country, 2019 - 2022, USD Million
- TABLE 82 North America Human Market by Country, 2023 - 2030, USD Million
- TABLE 83 North America Humanized Market by Country, 2019 - 2022, USD Million
- TABLE 84 North America Humanized Market by Country, 2023 - 2030, USD Million
- TABLE 85 North America Chimeric Market by Country, 2019 - 2022, USD Million
- TABLE 86 North America Chimeric Market by Country, 2023 - 2030, USD Million
- TABLE 87 North America Others Market by Country, 2019 - 2022, USD Million
- TABLE 88 North America Others Market by Country, 2023 - 2030, USD Million
- TABLE 89 North America Antibody Therapeutics Market by End User, 2019 - 2022, USD Million
- TABLE 90 North America Antibody Therapeutics Market by End User, 2023 - 2030, USD Million
- TABLE 91 North America Hospitals Market by Country, 2019 - 2022, USD Million
- TABLE 92 North America Hospitals Market by Country, 2023 - 2030, USD Million
- TABLE 93 North America Long-term care facilities Market by Country, 2019 - 2022, USD Million
- TABLE 94 North America Long-term care facilities Market by Country, 2023 - 2030, USD Million
- TABLE 95 North America Others Market by Country, 2019 - 2022, USD Million
- TABLE 96 North America Others Market by Country, 2023 - 2030, USD Million
- TABLE 97 North America Antibody Therapeutics Market by Disease Areas, 2019 - 2022, USD Million
- TABLE 98 North America Antibody Therapeutics Market by Disease Areas, 2023 - 2030, USD Million
- TABLE 99 North America Autoimmune & Inflammatory Diseases Market by Country, 2019 - 2022, USD Million
- TABLE 100 North America Autoimmune & Inflammatory Diseases Market by Country, 2023 - 2030, USD Million
- TABLE 101 North America Neurology Market by Country, 2019 - 2022, USD Million
- TABLE 102 North America Neurology Market by Country, 2023 - 2030, USD Million
- TABLE 103 North America Osteology Market by Country, 2019 - 2022, USD Million
- TABLE 104 North America Osteology Market by Country, 2023 - 2030, USD Million
- TABLE 105 North America Hematology Market by Country, 2019 - 2022, USD Million
- TABLE 106 North America Hematology Market by Country, 2023 - 2030, USD Million
- TABLE 107 North America Oncology Market by Country, 2019 - 2022, USD Million
- TABLE 108 North America Oncology Market by Country, 2023 - 2030, USD Million
- TABLE 109 North America Infectious Diseases Market by Country, 2019 - 2022, USD Million
- TABLE 110 North America Infectious Diseases Market by Country, 2023 - 2030, USD Million
- TABLE 111 North America Immunology Market by Country, 2019 - 2022, USD Million
- TABLE 112 North America Immunology Market by Country, 2023 - 2030, USD Million
- TABLE 113 North America Others Market by Country, 2019 - 2022, USD Million
- TABLE 114 North America Others Market by Country, 2023 - 2030, USD Million
- TABLE 115 North America Antibody Therapeutics Market by Country, 2019 - 2022, USD Million
- TABLE 116 North America Antibody Therapeutics Market by Country, 2023 - 2030, USD Million
- TABLE 117 US Antibody Therapeutics Market, 2019 - 2022, USD Million
- TABLE 118 US Antibody Therapeutics Market, 2023 - 2030, USD Million
- TABLE 119 US Antibody Therapeutics Market by Route of Administration, 2019 - 2022, USD Million
- TABLE 120 US Antibody Therapeutics Market by Route of Administration, 2023 - 2030, USD Million
- TABLE 121 US Antibody Therapeutics Market by Format, 2019 - 2022, USD Million
- TABLE 122 US Antibody Therapeutics Market by Format, 2023 - 2030, USD Million
- TABLE 123 US Antibody Therapeutics Market by Source, 2019 - 2022, USD Million
- TABLE 124 US Antibody Therapeutics Market by Source, 2023 - 2030, USD Million
- TABLE 125 US Antibody Therapeutics Market by End User, 2019 - 2022, USD Million
- TABLE 126 US Antibody Therapeutics Market by End User, 2023 - 2030, USD Million
- TABLE 127 US Antibody Therapeutics Market by Disease Areas, 2019 - 2022, USD Million
- TABLE 128 US Antibody Therapeutics Market by Disease Areas, 2023 - 2030, USD Million
- TABLE 129 Canada Antibody Therapeutics Market, 2019 - 2022, USD Million
- TABLE 130 Canada Antibody Therapeutics Market, 2023 - 2030, USD Million
- TABLE 131 Canada Antibody Therapeutics Market by Route of Administration, 2019 - 2022, USD Million
- TABLE 132 Canada Antibody Therapeutics Market by Route of Administration, 2023 - 2030, USD Million
- TABLE 133 Canada Antibody Therapeutics Market by Format, 2019 - 2022, USD Million
- TABLE 134 Canada Antibody Therapeutics Market by Format, 2023 - 2030, USD Million
- TABLE 135 Canada Antibody Therapeutics Market by Source, 2019 - 2022, USD Million
- TABLE 136 Canada Antibody Therapeutics Market by Source, 2023 - 2030, USD Million
- TABLE 137 Canada Antibody Therapeutics Market by End User, 2019 - 2022, USD Million
- TABLE 138 Canada Antibody Therapeutics Market by End User, 2023 - 2030, USD Million
- TABLE 139 Canada Antibody Therapeutics Market by Disease Areas, 2019 - 2022, USD Million
- TABLE 140 Canada Antibody Therapeutics Market by Disease Areas, 2023 - 2030, USD Million
- TABLE 141 Mexico Antibody Therapeutics Market, 2019 - 2022, USD Million
- TABLE 142 Mexico Antibody Therapeutics Market, 2023 - 2030, USD Million
- TABLE 143 Mexico Antibody Therapeutics Market by Route of Administration, 2019 - 2022, USD Million
- TABLE 144 Mexico Antibody Therapeutics Market by Route of Administration, 2023 - 2030, USD Million
- TABLE 145 Mexico Antibody Therapeutics Market by Format, 2019 - 2022, USD Million
- TABLE 146 Mexico Antibody Therapeutics Market by Format, 2023 - 2030, USD Million
- TABLE 147 Mexico Antibody Therapeutics Market by Source, 2019 - 2022, USD Million
- TABLE 148 Mexico Antibody Therapeutics Market by Source, 2023 - 2030, USD Million
- TABLE 149 Mexico Antibody Therapeutics Market by End User, 2019 - 2022, USD Million
- TABLE 150 Mexico Antibody Therapeutics Market by End User, 2023 - 2030, USD Million
- TABLE 151 Mexico Antibody Therapeutics Market by Disease Areas, 2019 - 2022, USD Million
- TABLE 152 Mexico Antibody Therapeutics Market by Disease Areas, 2023 - 2030, USD Million
- TABLE 153 Rest of North America Antibody Therapeutics Market, 2019 - 2022, USD Million
- TABLE 154 Rest of North America Antibody Therapeutics Market, 2023 - 2030, USD Million
- TABLE 155 Rest of North America Antibody Therapeutics Market by Route of Administration, 2019 - 2022, USD Million
- TABLE 156 Rest of North America Antibody Therapeutics Market by Route of Administration, 2023 - 2030, USD Million
- TABLE 157 Rest of North America Antibody Therapeutics Market by Format, 2019 - 2022, USD Million
- TABLE 158 Rest of North America Antibody Therapeutics Market by Format, 2023 - 2030, USD Million
- TABLE 159 Rest of North America Antibody Therapeutics Market by Source, 2019 - 2022, USD Million
- TABLE 160 Rest of North America Antibody Therapeutics Market by Source, 2023 - 2030, USD Million
- TABLE 161 Rest of North America Antibody Therapeutics Market by End User, 2019 - 2022, USD Million
- TABLE 162 Rest of North America Antibody Therapeutics Market by End User, 2023 - 2030, USD Million
- TABLE 163 Rest of North America Antibody Therapeutics Market by Disease Areas, 2019 - 2022, USD Million
- TABLE 164 Rest of North America Antibody Therapeutics Market by Disease Areas, 2023 - 2030, USD Million
- TABLE 165 Europe Antibody Therapeutics Market, 2019 - 2022, USD Million
- TABLE 166 Europe Antibody Therapeutics Market, 2023 - 2030, USD Million
- TABLE 167 Europe Antibody Therapeutics Market by Route of Administration, 2019 - 2022, USD Million
- TABLE 168 Europe Antibody Therapeutics Market by Route of Administration, 2023 - 2030, USD Million
- TABLE 169 Europe Intravenous Market by Country, 2019 - 2022, USD Million
- TABLE 170 Europe Intravenous Market by Country, 2023 - 2030, USD Million
- TABLE 171 Europe Subcutaneous Market by Country, 2019 - 2022, USD Million
- TABLE 172 Europe Subcutaneous Market by Country, 2023 - 2030, USD Million
- TABLE 173 Europe Others Market by Country, 2019 - 2022, USD Million
- TABLE 174 Europe Others Market by Country, 2023 - 2030, USD Million
- TABLE 175 Europe Antibody Therapeutics Market by Format, 2019 - 2022, USD Million
- TABLE 176 Europe Antibody Therapeutics Market by Format, 2023 - 2030, USD Million
- TABLE 177 Europe Monoclonal Antibody Market by Country, 2019 - 2022, USD Million
- TABLE 178 Europe Monoclonal Antibody Market by Country, 2023 - 2030, USD Million
- TABLE 179 Europe Polyclonal Antibody Therapy Market by Country, 2019 - 2022, USD Million
- TABLE 180 Europe Polyclonal Antibody Therapy Market by Country, 2023 - 2030, USD Million
- TABLE 181 Europe Bispecific Antibody Market by Country, 2019 - 2022, USD Million
- TABLE 182 Europe Bispecific Antibody Market by Country, 2023 - 2030, USD Million
- TABLE 183 Europe Antibody fragment & Others Market by Country, 2019 - 2022, USD Million
- TABLE 184 Europe Antibody fragment & Others Market by Country, 2023 - 2030, USD Million
- TABLE 185 Europe Antibody Therapeutics Market by Source, 2019 - 2022, USD Million
- TABLE 186 Europe Antibody Therapeutics Market by Source, 2023 - 2030, USD Million
- TABLE 187 Europe Human Market by Country, 2019 - 2022, USD Million
- TABLE 188 Europe Human Market by Country, 2023 - 2030, USD Million
- TABLE 189 Europe Humanized Market by Country, 2019 - 2022, USD Million
- TABLE 190 Europe Humanized Market by Country, 2023 - 2030, USD Million
- TABLE 191 Europe Chimeric Market by Country, 2019 - 2022, USD Million
- TABLE 192 Europe Chimeric Market by Country, 2023 - 2030, USD Million
- TABLE 193 Europe Others Market by Country, 2019 - 2022, USD Million
- TABLE 194 Europe Others Market by Country, 2023 - 2030, USD Million
- TABLE 195 Europe Antibody Therapeutics Market by End User, 2019 - 2022, USD Million
- TABLE 196 Europe Antibody Therapeutics Market by End User, 2023 - 2030, USD Million
- TABLE 197 Europe Hospitals Market by Country, 2019 - 2022, USD Million
- TABLE 198 Europe Hospitals Market by Country, 2023 - 2030, USD Million
- TABLE 199 Europe Long-term care facilities Market by Country, 2019 - 2022, USD Million
- TABLE 200 Europe Long-term care facilities Market by Country, 2023 - 2030, USD Million
- TABLE 201 Europe Others Market by Country, 2019 - 2022, USD Million
- TABLE 202 Europe Others Market by Country, 2023 - 2030, USD Million
- TABLE 203 Europe Antibody Therapeutics Market by Disease Areas, 2019 - 2022, USD Million
- TABLE 204 Europe Antibody Therapeutics Market by Disease Areas, 2023 - 2030, USD Million
- TABLE 205 Europe Autoimmune & Inflammatory Diseases Market by Country, 2019 - 2022, USD Million
- TABLE 206 Europe Autoimmune & Inflammatory Diseases Market by Country, 2023 - 2030, USD Million
- TABLE 207 Europe Neurology Market by Country, 2019 - 2022, USD Million
- TABLE 208 Europe Neurology Market by Country, 2023 - 2030, USD Million
- TABLE 209 Europe Osteology Market by Country, 2019 - 2022, USD Million
- TABLE 210 Europe Osteology Market by Country, 2023 - 2030, USD Million
- TABLE 211 Europe Hematology Market by Country, 2019 - 2022, USD Million
- TABLE 212 Europe Hematology Market by Country, 2023 - 2030, USD Million
- TABLE 213 Europe Oncology Market by Country, 2019 - 2022, USD Million
- TABLE 214 Europe Oncology Market by Country, 2023 - 2030, USD Million
- TABLE 215 Europe Infectious Diseases Market by Country, 2019 - 2022, USD Million
- TABLE 216 Europe Infectious Diseases Market by Country, 2023 - 2030, USD Million
- TABLE 217 Europe Immunology Market by Country, 2019 - 2022, USD Million
- TABLE 218 Europe Immunology Market by Country, 2023 - 2030, USD Million
- TABLE 219 Europe Others Market by Country, 2019 - 2022, USD Million
- TABLE 220 Europe Others Market by Country, 2023 - 2030, USD Million
- TABLE 221 Europe Antibody Therapeutics Market by Country, 2019 - 2022, USD Million
- TABLE 222 Europe Antibody Therapeutics Market by Country, 2023 - 2030, USD Million
- TABLE 223 Germany Antibody Therapeutics Market, 2019 - 2022, USD Million
- TABLE 224 Germany Antibody Therapeutics Market, 2023 - 2030, USD Million
- TABLE 225 Germany Antibody Therapeutics Market by Route of Administration, 2019 - 2022, USD Million
- TABLE 226 Germany Antibody Therapeutics Market by Route of Administration, 2023 - 2030, USD Million
- TABLE 227 Germany Antibody Therapeutics Market by Format, 2019 - 2022, USD Million
- TABLE 228 Germany Antibody Therapeutics Market by Format, 2023 - 2030, USD Million
- TABLE 229 Germany Antibody Therapeutics Market by Source, 2019 - 2022, USD Million
- TABLE 230 Germany Antibody Therapeutics Market by Source, 2023 - 2030, USD Million
- TABLE 231 Germany Antibody Therapeutics Market by End User, 2019 - 2022, USD Million
- TABLE 232 Germany Antibody Therapeutics Market by End User, 2023 - 2030, USD Million
- TABLE 233 Germany Antibody Therapeutics Market by Disease Areas, 2019 - 2022, USD Million
- TABLE 234 Germany Antibody Therapeutics Market by Disease Areas, 2023 - 2030, USD Million
- TABLE 235 UK Antibody Therapeutics Market, 2019 - 2022, USD Million
- TABLE 236 UK Antibody Therapeutics Market, 2023 - 2030, USD Million
- TABLE 237 UK Antibody Therapeutics Market by Route of Administration, 2019 - 2022, USD Million
- TABLE 238 UK Antibody Therapeutics Market by Route of Administration, 2023 - 2030, USD Million
- TABLE 239 UK Antibody Therapeutics Market by Format, 2019 - 2022, USD Million
- TABLE 240 UK Antibody Therapeutics Market by Format, 2023 - 2030, USD Million
- TABLE 241 UK Antibody Therapeutics Market by Source, 2019 - 2022, USD Million
- TABLE 242 UK Antibody Therapeutics Market by Source, 2023 - 2030, USD Million
- TABLE 243 UK Antibody Therapeutics Market by End User, 2019 - 2022, USD Million
- TABLE 244 UK Antibody Therapeutics Market by End User, 2023 - 2030, USD Million
- TABLE 245 UK Antibody Therapeutics Market by Disease Areas, 2019 - 2022, USD Million
- TABLE 246 UK Antibody Therapeutics Market by Disease Areas, 2023 - 2030, USD Million
- TABLE 247 France Antibody Therapeutics Market, 2019 - 2022, USD Million
- TABLE 248 France Antibody Therapeutics Market, 2023 - 2030, USD Million
- TABLE 249 France Antibody Therapeutics Market by Route of Administration, 2019 - 2022, USD Million
- TABLE 250 France Antibody Therapeutics Market by Route of Administration, 2023 - 2030, USD Million
- TABLE 251 France Antibody Therapeutics Market by Format, 2019 - 2022, USD Million
- TABLE 252 France Antibody Therapeutics Market by Format, 2023 - 2030, USD Million
- TABLE 253 France Antibody Therapeutics Market by Source, 2019 - 2022, USD Million
- TABLE 254 France Antibody Therapeutics Market by Source, 2023 - 2030, USD Million
- TABLE 255 France Antibody Therapeutics Market by End User, 2019 - 2022, USD Million
- TABLE 256 France Antibody Therapeutics Market by End User, 2023 - 2030, USD Million
- TABLE 257 France Antibody Therapeutics Market by Disease Areas, 2019 - 2022, USD Million
- TABLE 258 France Antibody Therapeutics Market by Disease Areas, 2023 - 2030, USD Million
- TABLE 259 Russia Antibody Therapeutics Market, 2019 - 2022, USD Million
- TABLE 260 Russia Antibody Therapeutics Market, 2023 - 2030, USD Million
- TABLE 261 Russia Antibody Therapeutics Market by Route of Administration, 2019 - 2022, USD Million
- TABLE 262 Russia Antibody Therapeutics Market by Route of Administration, 2023 - 2030, USD Million
- TABLE 263 Russia Antibody Therapeutics Market by Format, 2019 - 2022, USD Million
- TABLE 264 Russia Antibody Therapeutics Market by Format, 2023 - 2030, USD Million
- TABLE 265 Russia Antibody Therapeutics Market by Source, 2019 - 2022, USD Million
- TABLE 266 Russia Antibody Therapeutics Market by Source, 2023 - 2030, USD Million
- TABLE 267 Russia Antibody Therapeutics Market by End User, 2019 - 2022, USD Million
- TABLE 268 Russia Antibody Therapeutics Market by End User, 2023 - 2030, USD Million
- TABLE 269 Russia Antibody Therapeutics Market by Disease Areas, 2019 - 2022, USD Million
- TABLE 270 Russia Antibody Therapeutics Market by Disease Areas, 2023 - 2030, USD Million
- TABLE 271 Spain Antibody Therapeutics Market, 2019 - 2022, USD Million
- TABLE 272 Spain Antibody Therapeutics Market, 2023 - 2030, USD Million
- TABLE 273 Spain Antibody Therapeutics Market by Route of Administration, 2019 - 2022, USD Million
- TABLE 274 Spain Antibody Therapeutics Market by Route of Administration, 2023 - 2030, USD Million
- TABLE 275 Spain Antibody Therapeutics Market by Format, 2019 - 2022, USD Million
- TABLE 276 Spain Antibody Therapeutics Market by Format, 2023 - 2030, USD Million
- TABLE 277 Spain Antibody Therapeutics Market by Source, 2019 - 2022, USD Million
- TABLE 278 Spain Antibody Therapeutics Market by Source, 2023 - 2030, USD Million
- TABLE 279 Spain Antibody Therapeutics Market by End User, 2019 - 2022, USD Million
- TABLE 280 Spain Antibody Therapeutics Market by End User, 2023 - 2030, USD Million
- TABLE 281 Spain Antibody Therapeutics Market by Disease Areas, 2019 - 2022, USD Million
- TABLE 282 Spain Antibody Therapeutics Market by Disease Areas, 2023 - 2030, USD Million
- TABLE 283 Italy Antibody Therapeutics Market, 2019 - 2022, USD Million
- TABLE 284 Italy Antibody Therapeutics Market, 2023 - 2030, USD Million
- TABLE 285 Italy Antibody Therapeutics Market by Route of Administration, 2019 - 2022, USD Million
- TABLE 286 Italy Antibody Therapeutics Market by Route of Administration, 2023 - 2030, USD Million
- TABLE 287 Italy Antibody Therapeutics Market by Format, 2019 - 2022, USD Million
- TABLE 288 Italy Antibody Therapeutics Market by Format, 2023 - 2030, USD Million
- TABLE 289 Italy Antibody Therapeutics Market by Source, 2019 - 2022, USD Million
- TABLE 290 Italy Antibody Therapeutics Market by Source, 2023 - 2030, USD Million
- TABLE 291 Italy Antibody Therapeutics Market by End User, 2019 - 2022, USD Million
- TABLE 292 Italy Antibody Therapeutics Market by End User, 2023 - 2030, USD Million
- TABLE 293 Italy Antibody Therapeutics Market by Disease Areas, 2019 - 2022, USD Million
- TABLE 294 Italy Antibody Therapeutics Market by Disease Areas, 2023 - 2030, USD Million
- TABLE 295 Rest of Europe Antibody Therapeutics Market, 2019 - 2022, USD Million
- TABLE 296 Rest of Europe Antibody Therapeutics Market, 2023 - 2030, USD Million
- TABLE 297 Rest of Europe Antibody Therapeutics Market by Route of Administration, 2019 - 2022, USD Million
- TABLE 298 Rest of Europe Antibody Therapeutics Market by Route of Administration, 2023 - 2030, USD Million
- TABLE 299 Rest of Europe Antibody Therapeutics Market by Format, 2019 - 2022, USD Million
- TABLE 300 Rest of Europe Antibody Therapeutics Market by Format, 2023 - 2030, USD Million
- TABLE 301 Rest of Europe Antibody Therapeutics Market by Source, 2019 - 2022, USD Million
- TABLE 302 Rest of Europe Antibody Therapeutics Market by Source, 2023 - 2030, USD Million
- TABLE 303 Rest of Europe Antibody Therapeutics Market by End User, 2019 - 2022, USD Million
- TABLE 304 Rest of Europe Antibody Therapeutics Market by End User, 2023 - 2030, USD Million
- TABLE 305 Rest of Europe Antibody Therapeutics Market by Disease Areas, 2019 - 2022, USD Million
- TABLE 306 Rest of Europe Antibody Therapeutics Market by Disease Areas, 2023 - 2030, USD Million
- TABLE 307 Asia Pacific Antibody Therapeutics Market, 2019 - 2022, USD Million
- TABLE 308 Asia Pacific Antibody Therapeutics Market, 2023 - 2030, USD Million
- TABLE 309 Asia Pacific Antibody Therapeutics Market by Route of Administration, 2019 - 2022, USD Million
- TABLE 310 Asia Pacific Antibody Therapeutics Market by Route of Administration, 2023 - 2030, USD Million
- TABLE 311 Asia Pacific Intravenous Market by Country, 2019 - 2022, USD Million
- TABLE 312 Asia Pacific Intravenous Market by Country, 2023 - 2030, USD Million
- TABLE 313 Asia Pacific Subcutaneous Market by Country, 2019 - 2022, USD Million
- TABLE 314 Asia Pacific Subcutaneous Market by Country, 2023 - 2030, USD Million
- TABLE 315 Asia Pacific Others Market by Country, 2019 - 2022, USD Million
- TABLE 316 Asia Pacific Others Market by Country, 2023 - 2030, USD Million
- TABLE 317 Asia Pacific Antibody Therapeutics Market by Format, 2019 - 2022, USD Million
- TABLE 318 Asia Pacific Antibody Therapeutics Market by Format, 2023 - 2030, USD Million
- TABLE 319 Asia Pacific Monoclonal Antibody Market by Country, 2019 - 2022, USD Million
- TABLE 320 Asia Pacific Monoclonal Antibody Market by Country, 2023 - 2030, USD Million
- TABLE 321 Asia Pacific Polyclonal Antibody Therapy Market by Country, 2019 - 2022, USD Million
- TABLE 322 Asia Pacific Polyclonal Antibody Therapy Market by Country, 2023 - 2030, USD Million
- TABLE 323 Asia Pacific Bispecific Antibody Market by Country, 2019 - 2022, USD Million
- TABLE 324 Asia Pacific Bispecific Antibody Market by Country, 2023 - 2030, USD Million
- TABLE 325 Asia Pacific Antibody fragment & Others Market by Country, 2019 - 2022, USD Million
- TABLE 326 Asia Pacific Antibody fragment & Others Market by Country, 2023 - 2030, USD Million
- TABLE 327 Asia Pacific Antibody Therapeutics Market by Source, 2019 - 2022, USD Million
- TABLE 328 Asia Pacific Antibody Therapeutics Market by Source, 2023 - 2030, USD Million
- TABLE 329 Asia Pacific Human Market by Country, 2019 - 2022, USD Million
- TABLE 330 Asia Pacific Human Market by Country, 2023 - 2030, USD Million
- TABLE 331 Asia Pacific Humanized Market by Country, 2019 - 2022, USD Million
- TABLE 332 Asia Pacific Humanized Market by Country, 2023 - 2030, USD Million
- TABLE 333 Asia Pacific Chimeric Market by Country, 2019 - 2022, USD Million
- TABLE 334 Asia Pacific Chimeric Market by Country, 2023 - 2030, USD Million
- TABLE 335 Asia Pacific Others Market by Country, 2019 - 2022, USD Million
- TABLE 336 Asia Pacific Others Market by Country, 2023 - 2030, USD Million
- TABLE 337 Asia Pacific Antibody Therapeutics Market by End User, 2019 - 2022, USD Million
- TABLE 338 Asia Pacific Antibody Therapeutics Market by End User, 2023 - 2030, USD Million
- TABLE 339 Asia Pacific Hospitals Market by Country, 2019 - 2022, USD Million
- TABLE 340 Asia Pacific Hospitals Market by Country, 2023 - 2030, USD Million
- TABLE 341 Asia Pacific Long-term care facilities Market by Country, 2019 - 2022, USD Million
- TABLE 342 Asia Pacific Long-term care facilities Market by Country, 2023 - 2030, USD Million
- TABLE 343 Asia Pacific Others Market by Country, 2019 - 2022, USD Million
- TABLE 344 Asia Pacific Others Market by Country, 2023 - 2030, USD Million
- TABLE 345 Asia Pacific Antibody Therapeutics Market by Disease Areas, 2019 - 2022, USD Million
- TABLE 346 Asia Pacific Antibody Therapeutics Market by Disease Areas, 2023 - 2030, USD Million
- TABLE 347 Asia Pacific Autoimmune & Inflammatory Diseases Market by Country, 2019 - 2022, USD Million
- TABLE 348 Asia Pacific Autoimmune & Inflammatory Diseases Market by Country, 2023 - 2030, USD Million
- TABLE 349 Asia Pacific Neurology Market by Country, 2019 - 2022, USD Million
- TABLE 350 Asia Pacific Neurology Market by Country, 2023 - 2030, USD Million
- TABLE 351 Asia Pacific Osteology Market by Country, 2019 - 2022, USD Million
- TABLE 352 Asia Pacific Osteology Market by Country, 2023 - 2030, USD Million
- TABLE 353 Asia Pacific Hematology Market by Country, 2019 - 2022, USD Million
- TABLE 354 Asia Pacific Hematology Market by Country, 2023 - 2030, USD Million
- TABLE 355 Asia Pacific Oncology Market by Country, 2019 - 2022, USD Million
- TABLE 356 Asia Pacific Oncology Market by Country, 2023 - 2030, USD Million
- TABLE 357 Asia Pacific Infectious Diseases Market by Country, 2019 - 2022, USD Million
- TABLE 358 Asia Pacific Infectious Diseases Market by Country, 2023 - 2030, USD Million
- TABLE 359 Asia Pacific Immunology Market by Country, 2019 - 2022, USD Million
- TABLE 360 Asia Pacific Immunology Market by Country, 2023 - 2030, USD Million
- TABLE 361 Asia Pacific Others Market by Country, 2019 - 2022, USD Million
- TABLE 362 Asia Pacific Others Market by Country, 2023 - 2030, USD Million
- TABLE 363 Asia Pacific Antibody Therapeutics Market by Country, 2019 - 2022, USD Million
- TABLE 364 Asia Pacific Antibody Therapeutics Market by Country, 2023 - 2030, USD Million
- TABLE 365 China Antibody Therapeutics Market, 2019 - 2022, USD Million
- TABLE 366 China Antibody Therapeutics Market, 2023 - 2030, USD Million
- TABLE 367 China Antibody Therapeutics Market by Route of Administration, 2019 - 2022, USD Million
- TABLE 368 China Antibody Therapeutics Market by Route of Administration, 2023 - 2030, USD Million
- TABLE 369 China Antibody Therapeutics Market by Format, 2019 - 2022, USD Million
- TABLE 370 China Antibody Therapeutics Market by Format, 2023 - 2030, USD Million
- TABLE 371 China Antibody Therapeutics Market by Source, 2019 - 2022, USD Million
- TABLE 372 China Antibody Therapeutics Market by Source, 2023 - 2030, USD Million
- TABLE 373 China Antibody Therapeutics Market by End User, 2019 - 2022, USD Million
- TABLE 374 China Antibody Therapeutics Market by End User, 2023 - 2030, USD Million
- TABLE 375 China Antibody Therapeutics Market by Disease Areas, 2019 - 2022, USD Million
- TABLE 376 China Antibody Therapeutics Market by Disease Areas, 2023 - 2030, USD Million
- TABLE 377 Japan Antibody Therapeutics Market, 2019 - 2022, USD Million
- TABLE 378 Japan Antibody Therapeutics Market, 2023 - 2030, USD Million
- TABLE 379 Japan Antibody Therapeutics Market by Route of Administration, 2019 - 2022, USD Million
- TABLE 380 Japan Antibody Therapeutics Market by Route of Administration, 2023 - 2030, USD Million
- TABLE 381 Japan Antibody Therapeutics Market by Format, 2019 - 2022, USD Million
- TABLE 382 Japan Antibody Therapeutics Market by Format, 2023 - 2030, USD Million
- TABLE 383 Japan Antibody Therapeutics Market by Source, 2019 - 2022, USD Million
- TABLE 384 Japan Antibody Therapeutics Market by Source, 2023 - 2030, USD Million
- TABLE 385 Japan Antibody Therapeutics Market by End User, 2019 - 2022, USD Million
- TABLE 386 Japan Antibody Therapeutics Market by End User, 2023 - 2030, USD Million
- TABLE 387 Japan Antibody Therapeutics Market by Disease Areas, 2019 - 2022, USD Million
- TABLE 388 Japan Antibody Therapeutics Market by Disease Areas, 2023 - 2030, USD Million
- TABLE 389 India Antibody Therapeutics Market, 2019 - 2022, USD Million
- TABLE 390 India Antibody Therapeutics Market, 2023 - 2030, USD Million
- TABLE 391 India Antibody Therapeutics Market by Route of Administration, 2019 - 2022, USD Million
- TABLE 392 India Antibody Therapeutics Market by Route of Administration, 2023 - 2030, USD Million
- TABLE 393 India Antibody Therapeutics Market by Format, 2019 - 2022, USD Million
- TABLE 394 India Antibody Therapeutics Market by Format, 2023 - 2030, USD Million
- TABLE 395 India Antibody Therapeutics Market by Source, 2019 - 2022, USD Million
- TABLE 396 India Antibody Therapeutics Market by Source, 2023 - 2030, USD Million
- TABLE 397 India Antibody Therapeutics Market by End User, 2019 - 2022, USD Million
- TABLE 398 India Antibody Therapeutics Market by End User, 2023 - 2030, USD Million
- TABLE 399 India Antibody Therapeutics Market by Disease Areas, 2019 - 2022, USD Million
- TABLE 400 India Antibody Therapeutics Market by Disease Areas, 2023 - 2030, USD Million
- TABLE 401 South Korea Antibody Therapeutics Market, 2019 - 2022, USD Million
- TABLE 402 South Korea Antibody Therapeutics Market, 2023 - 2030, USD Million
- TABLE 403 South Korea Antibody Therapeutics Market by Route of Administration, 2019 - 2022, USD Million
- TABLE 404 South Korea Antibody Therapeutics Market by Route of Administration, 2023 - 2030, USD Million
- TABLE 405 South Korea Antibody Therapeutics Market by Format, 2019 - 2022, USD Million
- TABLE 406 South Korea Antibody Therapeutics Market by Format, 2023 - 2030, USD Million
- TABLE 407 South Korea Antibody Therapeutics Market by Source, 2019 - 2022, USD Million
- TABLE 408 South Korea Antibody Therapeutics Market by Source, 2023 - 2030, USD Million
- TABLE 409 South Korea Antibody Therapeutics Market by End User, 2019 - 2022, USD Million
- TABLE 410 South Korea Antibody Therapeutics Market by End User, 2023 - 2030, USD Million
- TABLE 411 South Korea Antibody Therapeutics Market by Disease Areas, 2019 - 2022, USD Million
- TABLE 412 South Korea Antibody Therapeutics Market by Disease Areas, 2023 - 2030, USD Million
- TABLE 413 Singapore Antibody Therapeutics Market, 2019 - 2022, USD Million
- TABLE 414 Singapore Antibody Therapeutics Market, 2023 - 2030, USD Million
- TABLE 415 Singapore Antibody Therapeutics Market by Route of Administration, 2019 - 2022, USD Million
- TABLE 416 Singapore Antibody Therapeutics Market by Route of Administration, 2023 - 2030, USD Million
- TABLE 417 Singapore Antibody Therapeutics Market by Format, 2019 - 2022, USD Million
- TABLE 418 Singapore Antibody Therapeutics Market by Format, 2023 - 2030, USD Million
- TABLE 419 Singapore Antibody Therapeutics Market by Source, 2019 - 2022, USD Million
- TABLE 420 Singapore Antibody Therapeutics Market by Source, 2023 - 2030, USD Million
- TABLE 421 Singapore Antibody Therapeutics Market by End User, 2019 - 2022, USD Million
- TABLE 422 Singapore Antibody Therapeutics Market by End User, 2023 - 2030, USD Million
- TABLE 423 Singapore Antibody Therapeutics Market by Disease Areas, 2019 - 2022, USD Million
- TABLE 424 Singapore Antibody Therapeutics Market by Disease Areas, 2023 - 2030, USD Million
- TABLE 425 Malaysia Antibody Therapeutics Market, 2019 - 2022, USD Million
- TABLE 426 Malaysia Antibody Therapeutics Market, 2023 - 2030, USD Million
- TABLE 427 Malaysia Antibody Therapeutics Market by Route of Administration, 2019 - 2022, USD Million
- TABLE 428 Malaysia Antibody Therapeutics Market by Route of Administration, 2023 - 2030, USD Million
- TABLE 429 Malaysia Antibody Therapeutics Market by Format, 2019 - 2022, USD Million
- TABLE 430 Malaysia Antibody Therapeutics Market by Format, 2023 - 2030, USD Million
- TABLE 431 Malaysia Antibody Therapeutics Market by Source, 2019 - 2022, USD Million
- TABLE 432 Malaysia Antibody Therapeutics Market by Source, 2023 - 2030, USD Million
- TABLE 433 Malaysia Antibody Therapeutics Market by End User, 2019 - 2022, USD Million
- TABLE 434 Malaysia Antibody Therapeutics Market by End User, 2023 - 2030, USD Million
- TABLE 435 Malaysia Antibody Therapeutics Market by Disease Areas, 2019 - 2022, USD Million
- TABLE 436 Malaysia Antibody Therapeutics Market by Disease Areas, 2023 - 2030, USD Million
- TABLE 437 Rest of Asia Pacific Antibody Therapeutics Market, 2019 - 2022, USD Million
- TABLE 438 Rest of Asia Pacific Antibody Therapeutics Market, 2023 - 2030, USD Million
- TABLE 439 Rest of Asia Pacific Antibody Therapeutics Market by Route of Administration, 2019 - 2022, USD Million
- TABLE 440 Rest of Asia Pacific Antibody Therapeutics Market by Route of Administration, 2023 - 2030, USD Million
- TABLE 441 Rest of Asia Pacific Antibody Therapeutics Market by Format, 2019 - 2022, USD Million
- TABLE 442 Rest of Asia Pacific Antibody Therapeutics Market by Format, 2023 - 2030, USD Million
- TABLE 443 Rest of Asia Pacific Antibody Therapeutics Market by Source, 2019 - 2022, USD Million
- TABLE 444 Rest of Asia Pacific Antibody Therapeutics Market by Source, 2023 - 2030, USD Million
- TABLE 445 Rest of Asia Pacific Antibody Therapeutics Market by End User, 2019 - 2022, USD Million
- TABLE 446 Rest of Asia Pacific Antibody Therapeutics Market by End User, 2023 - 2030, USD Million
- TABLE 447 Rest of Asia Pacific Antibody Therapeutics Market by Disease Areas, 2019 - 2022, USD Million
- TABLE 448 Rest of Asia Pacific Antibody Therapeutics Market by Disease Areas, 2023 - 2030, USD Million
- TABLE 449 LAMEA Antibody Therapeutics Market, 2019 - 2022, USD Million
- TABLE 450 LAMEA Antibody Therapeutics Market, 2023 - 2030, USD Million
- TABLE 451 LAMEA Antibody Therapeutics Market by Route of Administration, 2019 - 2022, USD Million
- TABLE 452 LAMEA Antibody Therapeutics Market by Route of Administration, 2023 - 2030, USD Million
- TABLE 453 LAMEA Intravenous Market by Country, 2019 - 2022, USD Million
- TABLE 454 LAMEA Intravenous Market by Country, 2023 - 2030, USD Million
- TABLE 455 LAMEA Subcutaneous Market by Country, 2019 - 2022, USD Million
- TABLE 456 LAMEA Subcutaneous Market by Country, 2023 - 2030, USD Million
- TABLE 457 LAMEA Others Market by Country, 2019 - 2022, USD Million
- TABLE 458 LAMEA Others Market by Country, 2023 - 2030, USD Million
- TABLE 459 LAMEA Antibody Therapeutics Market by Format, 2019 - 2022, USD Million
- TABLE 460 LAMEA Antibody Therapeutics Market by Format, 2023 - 2030, USD Million
- TABLE 461 LAMEA Monoclonal Antibody Market by Country, 2019 - 2022, USD Million
- TABLE 462 LAMEA Monoclonal Antibody Market by Country, 2023 - 2030, USD Million
- TABLE 463 LAMEA Polyclonal Antibody Therapy Market by Country, 2019 - 2022, USD Million
- TABLE 464 LAMEA Polyclonal Antibody Therapy Market by Country, 2023 - 2030, USD Million
- TABLE 465 LAMEA Bispecific Antibody Market by Country, 2019 - 2022, USD Million
- TABLE 466 LAMEA Bispecific Antibody Market by Country, 2023 - 2030, USD Million
- TABLE 467 LAMEA Antibody fragment & Others Market by Country, 2019 - 2022, USD Million
- TABLE 468 LAMEA Antibody fragment & Others Market by Country, 2023 - 2030, USD Million
- TABLE 469 LAMEA Antibody Therapeutics Market by Source, 2019 - 2022, USD Million
- TABLE 470 LAMEA Antibody Therapeutics Market by Source, 2023 - 2030, USD Million
- TABLE 471 LAMEA Human Market by Country, 2019 - 2022, USD Million
- TABLE 472 LAMEA Human Market by Country, 2023 - 2030, USD Million
- TABLE 473 LAMEA Humanized Market by Country, 2019 - 2022, USD Million
- TABLE 474 LAMEA Humanized Market by Country, 2023 - 2030, USD Million
- TABLE 475 LAMEA Chimeric Market by Country, 2019 - 2022, USD Million
- TABLE 476 LAMEA Chimeric Market by Country, 2023 - 2030, USD Million
- TABLE 477 LAMEA Others Market by Country, 2019 - 2022, USD Million
- TABLE 478 LAMEA Others Market by Country, 2023 - 2030, USD Million
- TABLE 479 LAMEA Antibody Therapeutics Market by End User, 2019 - 2022, USD Million
- TABLE 480 LAMEA Antibody Therapeutics Market by End User, 2023 - 2030, USD Million
- TABLE 481 LAMEA Hospitals Market by Country, 2019 - 2022, USD Million
- TABLE 482 LAMEA Hospitals Market by Country, 2023 - 2030, USD Million
- TABLE 483 LAMEA Long-term care facilities Market by Country, 2019 - 2022, USD Million
- TABLE 484 LAMEA Long-term care facilities Market by Country, 2023 - 2030, USD Million
- TABLE 485 LAMEA Others Market by Country, 2019 - 2022, USD Million
- TABLE 486 LAMEA Others Market by Country, 2023 - 2030, USD Million
- TABLE 487 LAMEA Antibody Therapeutics Market by Disease Areas, 2019 - 2022, USD Million
- TABLE 488 LAMEA Antibody Therapeutics Market by Disease Areas, 2023 - 2030, USD Million
- TABLE 489 LAMEA Autoimmune & Inflammatory Diseases Market by Country, 2019 - 2022, USD Million
- TABLE 490 LAMEA Autoimmune & Inflammatory Diseases Market by Country, 2023 - 2030, USD Million
- TABLE 491 LAMEA Neurology Market by Country, 2019 - 2022, USD Million
- TABLE 492 LAMEA Neurology Market by Country, 2023 - 2030, USD Million
- TABLE 493 LAMEA Osteology Market by Country, 2019 - 2022, USD Million
- TABLE 494 LAMEA Osteology Market by Country, 2023 - 2030, USD Million
- TABLE 495 LAMEA Hematology Market by Country, 2019 - 2022, USD Million
- TABLE 496 LAMEA Hematology Market by Country, 2023 - 2030, USD Million
- TABLE 497 LAMEA Oncology Market by Country, 2019 - 2022, USD Million
- TABLE 498 LAMEA Oncology Market by Country, 2023 - 2030, USD Million
- TABLE 499 LAMEA Infectious Diseases Market by Country, 2019 - 2022, USD Million
- TABLE 500 LAMEA Infectious Diseases Market by Country, 2023 - 2030, USD Million
- TABLE 501 LAMEA Immunology Market by Country, 2019 - 2022, USD Million
- TABLE 502 LAMEA Immunology Market by Country, 2023 - 2030, USD Million
- TABLE 503 LAMEA Others Market by Country, 2019 - 2022, USD Million
- TABLE 504 LAMEA Others Market by Country, 2023 - 2030, USD Million
- TABLE 505 LAMEA Antibody Therapeutics Market by Country, 2019 - 2022, USD Million
- TABLE 506 LAMEA Antibody Therapeutics Market by Country, 2023 - 2030, USD Million
- TABLE 507 Brazil Antibody Therapeutics Market, 2019 - 2022, USD Million
- TABLE 508 Brazil Antibody Therapeutics Market, 2023 - 2030, USD Million
- TABLE 509 Brazil Antibody Therapeutics Market by Route of Administration, 2019 - 2022, USD Million
- TABLE 510 Brazil Antibody Therapeutics Market by Route of Administration, 2023 - 2030, USD Million
- TABLE 511 Brazil Antibody Therapeutics Market by Format, 2019 - 2022, USD Million
- TABLE 512 Brazil Antibody Therapeutics Market by Format, 2023 - 2030, USD Million
- TABLE 513 Brazil Antibody Therapeutics Market by Source, 2019 - 2022, USD Million
- TABLE 514 Brazil Antibody Therapeutics Market by Source, 2023 - 2030, USD Million
- TABLE 515 Brazil Antibody Therapeutics Market by End User, 2019 - 2022, USD Million
- TABLE 516 Brazil Antibody Therapeutics Market by End User, 2023 - 2030, USD Million
- TABLE 517 Brazil Antibody Therapeutics Market by Disease Areas, 2019 - 2022, USD Million
- TABLE 518 Brazil Antibody Therapeutics Market by Disease Areas, 2023 - 2030, USD Million
- TABLE 519 Argentina Antibody Therapeutics Market, 2019 - 2022, USD Million
- TABLE 520 Argentina Antibody Therapeutics Market, 2023 - 2030, USD Million
- TABLE 521 Argentina Antibody Therapeutics Market by Route of Administration, 2019 - 2022, USD Million
- TABLE 522 Argentina Antibody Therapeutics Market by Route of Administration, 2023 - 2030, USD Million
- TABLE 523 Argentina Antibody Therapeutics Market by Format, 2019 - 2022, USD Million
- TABLE 524 Argentina Antibody Therapeutics Market by Format, 2023 - 2030, USD Million
- TABLE 525 Argentina Antibody Therapeutics Market by Source, 2019 - 2022, USD Million
- TABLE 526 Argentina Antibody Therapeutics Market by Source, 2023 - 2030, USD Million
- TABLE 527 Argentina Antibody Therapeutics Market by End User, 2019 - 2022, USD Million
- TABLE 528 Argentina Antibody Therapeutics Market by End User, 2023 - 2030, USD Million
- TABLE 529 Argentina Antibody Therapeutics Market by Disease Areas, 2019 - 2022, USD Million
- TABLE 530 Argentina Antibody Therapeutics Market by Disease Areas, 2023 - 2030, USD Million
- TABLE 531 UAE Antibody Therapeutics Market, 2019 - 2022, USD Million
- TABLE 532 UAE Antibody Therapeutics Market, 2023 - 2030, USD Million
- TABLE 533 UAE Antibody Therapeutics Market by Route of Administration, 2019 - 2022, USD Million
- TABLE 534 UAE Antibody Therapeutics Market by Route of Administration, 2023 - 2030, USD Million
- TABLE 535 UAE Antibody Therapeutics Market by Format, 2019 - 2022, USD Million
- TABLE 536 UAE Antibody Therapeutics Market by Format, 2023 - 2030, USD Million
- TABLE 537 UAE Antibody Therapeutics Market by Source, 2019 - 2022, USD Million
- TABLE 538 UAE Antibody Therapeutics Market by Source, 2023 - 2030, USD Million
- TABLE 539 UAE Antibody Therapeutics Market by End User, 2019 - 2022, USD Million
- TABLE 540 UAE Antibody Therapeutics Market by End User, 2023 - 2030, USD Million
- TABLE 541 UAE Antibody Therapeutics Market by Disease Areas, 2019 - 2022, USD Million
- TABLE 542 UAE Antibody Therapeutics Market by Disease Areas, 2023 - 2030, USD Million
- TABLE 543 Saudi Arabia Antibody Therapeutics Market, 2019 - 2022, USD Million
- TABLE 544 Saudi Arabia Antibody Therapeutics Market, 2023 - 2030, USD Million
- TABLE 545 Saudi Arabia Antibody Therapeutics Market by Route of Administration, 2019 - 2022, USD Million
- TABLE 546 Saudi Arabia Antibody Therapeutics Market by Route of Administration, 2023 - 2030, USD Million
- TABLE 547 Saudi Arabia Antibody Therapeutics Market by Format, 2019 - 2022, USD Million
- TABLE 548 Saudi Arabia Antibody Therapeutics Market by Format, 2023 - 2030, USD Million
- TABLE 549 Saudi Arabia Antibody Therapeutics Market by Source, 2019 - 2022, USD Million
- TABLE 550 Saudi Arabia Antibody Therapeutics Market by Source, 2023 - 2030, USD Million
- TABLE 551 Saudi Arabia Antibody Therapeutics Market by End User, 2019 - 2022, USD Million
- TABLE 552 Saudi Arabia Antibody Therapeutics Market by End User, 2023 - 2030, USD Million
- TABLE 553 Saudi Arabia Antibody Therapeutics Market by Disease Areas, 2019 - 2022, USD Million
- TABLE 554 Saudi Arabia Antibody Therapeutics Market by Disease Areas, 2023 - 2030, USD Million
- TABLE 555 South Africa Antibody Therapeutics Market, 2019 - 2022, USD Million
- TABLE 556 South Africa Antibody Therapeutics Market, 2023 - 2030, USD Million
- TABLE 557 South Africa Antibody Therapeutics Market by Route of Administration, 2019 - 2022, USD Million
- TABLE 558 South Africa Antibody Therapeutics Market by Route of Administration, 2023 - 2030, USD Million
- TABLE 559 South Africa Antibody Therapeutics Market by Format, 2019 - 2022, USD Million
- TABLE 560 South Africa Antibody Therapeutics Market by Format, 2023 - 2030, USD Million
- TABLE 561 South Africa Antibody Therapeutics Market by Source, 2019 - 2022, USD Million
- TABLE 562 South Africa Antibody Therapeutics Market by Source, 2023 - 2030, USD Million
- TABLE 563 South Africa Antibody Therapeutics Market by End User, 2019 - 2022, USD Million
- TABLE 564 South Africa Antibody Therapeutics Market by End User, 2023 - 2030, USD Million
- TABLE 565 South Africa Antibody Therapeutics Market by Disease Areas, 2019 - 2022, USD Million
- TABLE 566 South Africa Antibody Therapeutics Market by Disease Areas, 2023 - 2030, USD Million
- TABLE 567 Nigeria Antibody Therapeutics Market, 2019 - 2022, USD Million
- TABLE 568 Nigeria Antibody Therapeutics Market, 2023 - 2030, USD Million
- TABLE 569 Nigeria Antibody Therapeutics Market by Route of Administration, 2019 - 2022, USD Million
- TABLE 570 Nigeria Antibody Therapeutics Market by Route of Administration, 2023 - 2030, USD Million
- TABLE 571 Nigeria Antibody Therapeutics Market by Format, 2019 - 2022, USD Million
- TABLE 572 Nigeria Antibody Therapeutics Market by Format, 2023 - 2030, USD Million
- TABLE 573 Nigeria Antibody Therapeutics Market by Source, 2019 - 2022, USD Million
- TABLE 574 Nigeria Antibody Therapeutics Market by Source, 2023 - 2030, USD Million
- TABLE 575 Nigeria Antibody Therapeutics Market by End User, 2019 - 2022, USD Million
- TABLE 576 Nigeria Antibody Therapeutics Market by End User, 2023 - 2030, USD Million
- TABLE 577 Nigeria Antibody Therapeutics Market by Disease Areas, 2019 - 2022, USD Million
- TABLE 578 Nigeria Antibody Therapeutics Market by Disease Areas, 2023 - 2030, USD Million
- TABLE 579 Rest of LAMEA Antibody Therapeutics Market, 2019 - 2022, USD Million
- TABLE 580 Rest of LAMEA Antibody Therapeutics Market, 2023 - 2030, USD Million
- TABLE 581 Rest of LAMEA Antibody Therapeutics Market by Route of Administration, 2019 - 2022, USD Million
- TABLE 582 Rest of LAMEA Antibody Therapeutics Market by Route of Administration, 2023 - 2030, USD Million
- TABLE 583 Rest of LAMEA Antibody Therapeutics Market by Format, 2019 - 2022, USD Million
- TABLE 584 Rest of LAMEA Antibody Therapeutics Market by Format, 2023 - 2030, USD Million
- TABLE 585 Rest of LAMEA Antibody Therapeutics Market by Source, 2019 - 2022, USD Million
- TABLE 586 Rest of LAMEA Antibody Therapeutics Market by Source, 2023 - 2030, USD Million
- TABLE 587 Rest of LAMEA Antibody Therapeutics Market by End User, 2019 - 2022, USD Million
- TABLE 588 Rest of LAMEA Antibody Therapeutics Market by End User, 2023 - 2030, USD Million
- TABLE 589 Rest of LAMEA Antibody Therapeutics Market by Disease Areas, 2019 - 2022, USD Million
- TABLE 590 Rest of LAMEA Antibody Therapeutics Market by Disease Areas, 2023 - 2030, USD Million
- TABLE 591 Key Information - F. Hoffmann-La Roche Ltd.
- TABLE 592 Key information - AbbVie, Inc.
- TABLE 593 Key Information - Johnson & Johnson
- TABLE 594 key Information - Merck KGaA
- TABLE 595 Key Information - Bristol Myers Squibb Company
- TABLE 596 KEY INFORMATION - AstraZeneca PLC
- TABLE 597 Key Information - Sanofi S.A.
- TABLE 598 Key Information - Novartis AG
- TABLE 599 Key Information - Biogen, Inc.
- TABLE 600 Key Information - Amgen, Inc.
The Global Antibody Therapeutics Market size is expected to reach $631.3 billion by 2030, rising at a market growth of 14.4% CAGR during the forecast period.
Antibody therapeutics are explored to prevent and treat respiratory infections, like those caused by respiratory syncytial virus (RSV), influenza, and other respiratory pathogens. Thus, the Infectious Diseases segment acquired $27,652.5 million in 2022. Monoclonal antibodies can provide passive immunity and reduce the risk of severe disease. It offers a form of passive immunization, providing immediate protection against infectious agents. This is particularly important in situations where there is a need for rapid intervention, such as in the case of post-exposure prophylaxis. Some of the factors impacting the market are technological advancements in antibody engineering, increasing number of senior citizens and high development costs of antibody therapeutics.
Advances in antibody engineering technologies, including antibody-drug conjugates (ADCs), Fc engineering, and next-generation sequencing, enhance the properties and performance of antibody therapeutics. These technological advancements contribute to developing more potent, specific, and well-tolerated antibody drugs. Single-cell antibody technologies enable the isolation and characterization of individual B cells, allowing for the identification of rare and high-affinity antibodies. This approach is particularly valuable when traditional hybridoma or phage display methods may not capture the full diversity of the immune response. Single-cell antibody technologies contribute to developing antibodies with enhanced specificity and functionality. Additionally, the aging process is associated with an elevated risk of various age-related diseases, including cancer, neurodegenerative disorders, and autoimmune diseases. Antibody therapeutics, with their targeted and precision-based mechanisms, are well-suited for addressing the underlying causes of these diseases. As per the World Health Organization (WHO), one in six people will be 60 or older by 2030. The number of people 60 and older in the world will increase from 1 billion in 2020 to 1.4 billion in 2050. By 2050, there will be 2.1 billion people in the world who are 60 or older. It is anticipated that there will be 426 million persons 80 or older by 2050. This preference for targeted therapies aligns with the growing awareness of minimizing side effects in older populations. Increasing number of senior citizens has been a pivotal factor in driving the growth of the market.
Further, the pandemic highlighted vulnerabilities in global supply chains, affecting pharmaceutical product development and distribution, particularly antibody therapeutics. Disruptions in the supply chain, shortages of critical raw materials, and logistical challenges impacted the manufacturing and delivery of antibody drugs. Monoclonal antibodies were also deployed for prophylactic use in individuals at high risk of exposure to COVID-19, like those with underlying health conditions or individuals in close contact with infected individuals. The success of mRNA vaccines, such as those developed by Pfizer-BioNTech and Moderna, shifted attention towards nucleic acid-based therapies. While there was a heightened focus on infectious disease research, including antibody therapeutics for COVID-19, other therapeutic areas experienced shifts in priorities and resource allocation. Thus, the COVID-19 pandemic had a moderate effect on the market.
However, the research and development of antibody therapeutics involves substantial costs, including preclinical studies, clinical trials, and manufacturing expenses. The high investment required can pose a barrier, especially for smaller biotech companies, hindering their ability to bring novel antibodies to market. The financial burden associated with antibody development may lead to a focus on well-established targets and therapeutic areas, potentially limiting exploration in areas with significant unmet medical needs. This reduced innovation and diversity in the development pipeline can hinder the discovery of breakthrough therapies. High development costs of antibody therapeutics are a significant challenge that hampers the growth of the market.
By Route of Administration Outlook
On the basis of route of administration, the market is divided into intravenous, subcutaneous, and others. In 2022, the intravenous segment dominated the market with maximum revenue share. Intravenous administration ensures rapid and complete bioavailability of antibody therapeutics. This route allows the drug to enter the bloodstream directly, avoiding barriers such as the gastrointestinal tract, which can impact absorption rates. Intravenous delivery allows for precise dosing and control over the rate of administration. Healthcare professionals can carefully regulate the infusion rate to achieve therapeutic levels in the bloodstream, optimizing the efficacy of antibody therapeutics. Intravenous administration provides an immediate onset of action for antibody therapeutics. This is crucial when rapid therapeutic effects are needed, such as in treating acute conditions or emergencies.
By Format Outlook
By format, the market is categorized into monoclonal antibody, polyclonal antibody therapy, bispecific antibody, antibody fragment, and others. The antibody fragment segment procured a promising growth rate in the market in 2022. Antibody fragments typically exhibit faster clearance from the circulatory system compared to full-length antibodies. This rapid clearance can be beneficial when a quick onset of action or a shorter half-life is desired, providing greater control over the timing and duration of the therapeutic effect. Antibody fragments are widely used in diagnostic imaging applications. Their smaller size allows for rapid clearance from non-target tissues, improving imaging contrast. Single-photon emission computed tomography (SPECT) and positron emission tomography (PET) frequently use radiolabeled antibody fragments. Antibody fragments are explored for therapeutic applications in autoimmune diseases, where targeted and localized immunosuppression is desired.
By Source Outlook
By source, the market is segmented into human, humanized, chimeric, and others. In 2022, the human segment registered the maximum revenue share in the market. Human innovation and technological advancements, such as genetic engineering, monoclonal antibody production, and novel drug delivery systems, contribute to creating more effective and targeted antibody therapies. Human efforts in educating healthcare professionals, patients, and the public about the benefits and availability of antibody therapeutics contribute to their acceptance and utilization. Humans participate in clinical trials to test the efficacy and safety of antibody therapeutics. Their participation generates valuable data that inform the development process and regulatory approvals.
By End User Outlook
Based on end user, the market is fragmented into hospitals, long-term care facilities, and others. The long-term care facilities segment covered a considerable revenue share in the market in 2022. Long-term care facilities often cater to an aging population, which is more susceptible to conditions that may benefit from antibody therapeutics, including certain types of cancer, rheumatoid arthritis, and neurodegenerative disorders. The use of antibody therapeutics in long-term care facilities can reduce hospitalization rates. This is particularly important for residents who may have difficulty traveling to hospitals or are at higher risk of complications from hospital stays. Antibody therapeutics, particularly monoclonal antibodies, can prevent and manage infections. These treatments can support overall health maintenance in long-term care settings where people may be more susceptible to infections.
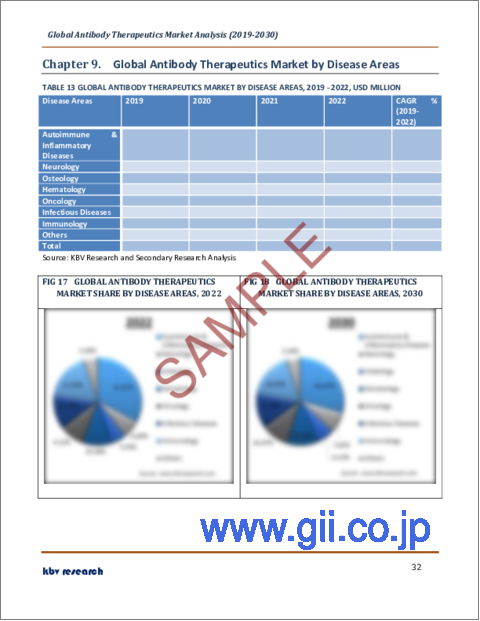
By Disease Areas Outlook
Based on disease areas, the market is classified into autoimmune & inflammatory diseases, oncology, hematology, infectious diseases, osteology, immunology, neurology, and others. The oncology segment procured a promising growth rate in the market in 2022. Antibody therapeutics are often combined with other cancer treatments, such as chemotherapy, targeted therapies, and radiation therapy. Combinatorial approaches aim to maximize treatment efficacy and address multiple aspects of cancer biology. Antibody therapeutics have proven effective in treating hematologic cancers, including various lymphomas and leukemias. Monoclonal antibodies, such as rituximab and alemtuzumab, target specific markers on cancer cells, leading to improved outcomes. Radioimmunotherapy involves antibodies labeled with radioactive isotopes to selectively deliver radiation to cancer cells. Ibritumomab, tiuxetan, and tositumomab are examples of radioimmunotherapy used in certain lymphomas.
Regional Outlook
Region-wise, the market is analysed across North America, Europe, Asia Pacific, and LAMEA. In 2022, the North America region led the market by generating the highest revenue share. North America, particularly the United States, is home to a vibrant and well-established pharmaceutical research and development ecosystem. North America is a global hub for clinical trials, providing a robust infrastructure for conducting large-scale and diverse studies. The North American population has a relatively high prevalence of autoimmune diseases, like rheumatoid arthritis, psoriasis, and inflammatory bowel diseases.
The market research report covers the analysis of key stakeholders of the market. Key companies profiled in the report include F. Hoffmann-La Roche Ltd, AbbVie, Inc., Johnson & Johnson (Johnson & Johnson Services, Inc.), Merck KGaA, Bristol Myers Squibb Company, AstraZeneca PLC, Sanofi S.A., Novartis AG, Biogen, Inc. and Amgen, Inc.
Strategies Deployed in Antibody Therapeutics market.
Dec-2023: AbbVie, Inc. came into partnership with BigHat Biosciences, a US-based biotechnology research company. Through this partnership, AbbVie, Inc. would explore and advance the development of cutting-edge therapeutic antibodies in the fields of oncology and neuroscience."
Dec-2023: AbbVie, Inc. took over Cerevel Therapeutics Hldg, biotech company in United States. Through this acquisition, AbbVie, Inc. would enhance its neuroscience portfolio.
Feb-2023: F. Hoffmann-La Roche Ltd came into partnership with Janssen Biotech Inc., a US-based pharmaceutical company. Through this partnership, F. Hoffmann-La Roche Ltd would enhance and develop companion diagnostics for targeted therapies. Additionally, this initiative strengthens the connection between diagnostics and treatments, fostering progress in precision healthcare.
Dec-2022: Merck KGaA came into partnership with Mersana Therapeutics, a biotech company in the United States. Through this partnership, Merck KGaA would develop innovative immunostimulatory antibody-drug conjugates.
Oct-2022: F. Hoffmann-La Roche Ltd came into partnership with Atea Pharmaceuticals, a US-based biotechnology research company. Through this partnership, F. Hoffmann-La Roche Ltd would create a prospective oral therapy for individuals with covid-19. Additionally, this therapy enables extensive production and promotes widespread patient availability.
Oct-2022: F. Hoffmann-La Roche Ltd introduced 'SARS-CoV-2 Rapid Antibody Test 2.0'. The SARS-CoV-2 Rapid Antibody Test 2.0 provides wider applicability than its initial design and now encompasses individuals who have been vaccinated.
Apr-2020: Johnson & Johnson came into partnership with Catalent, Inc., a US-based pharmaceutical manufacturing company. Through this partnership, Johnson & Johnson would enhance its manufacturing capability and lead vaccine candidates for COVID-19.
Mar-2019: Bristol Myers Squibb Company took over Celgene Corporation, a pharmaceutical company in the United States. Through this acquisition, Bristol Myers Squibb Company would establish a biopharmaceutical company.
Scope of the Study
Market Segments covered in the Report:
By Route of Administration
- Intravenous
- Subcutaneous
- Others
By Format
- Monoclonal Antibody
- Polyclonal Antibody Therapy
- Bispecific Antibody
- Antibody fragment & Others
By Source
- Human
- Humanized
- Chimeric
By End User
- Hospitals
- Long-term care facilities
- Other
By Disease Areas
- Autoimmune & Inflammatory Diseases
- Neurology
- Osteology
- Hematology
- Oncology
- Infectious Diseases
- Immunology
- Others
By Geography
- North America
- US
- Canada
- Mexico
- Rest of North America
- Europe
- Germany
- UK
- France
- Russia
- Spain
- Italy
- Rest of Europe
- Asia Pacific
- China
- Japan
- India
- South Korea
- Singapore
- Malaysia
- Rest of Asia Pacific
- LAMEA
- Brazil
- Argentina
- UAE
- Saudi Arabia
- South Africa
- Nigeria
- Rest of LAMEA
Companies Profiled
- F. Hoffmann-La Roche Ltd
- AbbVie, Inc.
- Johnson & Johnson (Johnson & Johnson Services, Inc.)
- Merck KGaA
- Bristol Myers Squibb Company
- AstraZeneca PLC
- Sanofi S.A.
- Novartis AG
- Biogen, Inc.
- Amgen, Inc.
Unique Offerings from KBV Research
- Exhaustive coverage
- Highest number of market tables and figures
- Subscription based model available
- Guaranteed best price
- Assured post sales research support with 10% customization free
Table of Contents
Chapter 1. Market Scope & Methodology
- 1.1 Market Definition
- 1.2 Objectives
- 1.3 Market Scope
- 1.4 Segmentation
- 1.4.1 Global Antibody Therapeutics Market, by Route of Administration
- 1.4.2 Global Antibody Therapeutics Market, by Format
- 1.4.3 Global Antibody Therapeutics Market, by Source
- 1.4.4 Global Antibody Therapeutics Market, by End User
- 1.4.5 Global Antibody Therapeutics Market, by Disease Areas
- 1.4.6 Global Antibody Therapeutics Market, by Geography
- 1.5 Methodology for the research
Chapter 2. Market at a Glance
- 2.1 Key Highlights
Chapter 3. Market Overview
- 3.1 Introduction
- 3.1.1 Overview
- 3.1.1.1 Market Composition and Scenario
- 3.1.1 Overview
- 3.2 Key Factors Impacting the Market
- 3.2.1 Market Drivers
- 3.2.2 Market Restraints
- 3.3 Porter Five Forces Analysis
Chapter 4. Strategies Deployed in Antibody Therapeutics market.
Chapter 5. Global Antibody Therapeutics Market by Route of Administration
- 5.1 Global Intravenous Market by Region
- 5.2 Global Subcutaneous Market by Region
- 5.3 Global Others Market by Region
Chapter 6. Global Antibody Therapeutics Market by Format
- 6.1 Global Monoclonal Antibody Market by Region
- 6.2 Global Polyclonal Antibody Therapy Market by Region
- 6.3 Global Bispecific Antibody Market by Region
- 6.4 Global Antibody fragment & Others Market by Region
Chapter 7. Global Antibody Therapeutics Market by Source
- 7.1 Global Human Market by Region
- 7.2 Global Humanized Market by Region
- 7.3 Global Chimeric Market by Region
- 7.4 Global Others Market by Region
Chapter 8. Global Antibody Therapeutics Market by End User
- 8.1 Global Hospitals Market by Region
- 8.2 Global Long-term care facilities Market by Region
- 8.3 Global Others Market by Region
Chapter 9. Global Antibody Therapeutics Market by Disease Areas
- 9.1 Global Autoimmune & Inflammatory Diseases Market by Region
- 9.2 Global Neurology Market by Region
- 9.3 Global Osteology Market by Region
- 9.4 Global Hematology Market by Region
- 9.5 Global Oncology Market by Region
- 9.6 Global Infectious Diseases Market by Region
- 9.7 Global Immunology Market by Region
- 9.8 Global Others Market by Region
Chapter 10. Global Antibody Therapeutics Market by Region
- 10.1 North America Antibody Therapeutics Market
- 10.1.1 North America Antibody Therapeutics Market by Route of Administration
- 10.1.1.1 North America Intravenous Market by Country
- 10.1.1.2 North America Subcutaneous Market by Country
- 10.1.1.3 North America Others Market by Country
- 10.1.2 North America Antibody Therapeutics Market by Format
- 10.1.2.1 North America Monoclonal Antibody Market by Country
- 10.1.2.2 North America Polyclonal Antibody Therapy Market by Country
- 10.1.2.3 North America Bispecific Antibody Market by Country
- 10.1.2.4 North America Antibody fragment & Others Market by Country
- 10.1.3 North America Antibody Therapeutics Market by Source
- 10.1.3.1 North America Human Market by Country
- 10.1.3.2 North America Humanized Market by Country
- 10.1.3.3 North America Chimeric Market by Country
- 10.1.3.4 North America Others Market by Country
- 10.1.4 North America Antibody Therapeutics Market by End User
- 10.1.4.1 North America Hospitals Market by Country
- 10.1.4.2 North America Long-term care facilities Market by Country
- 10.1.4.3 North America Others Market by Country
- 10.1.5 North America Antibody Therapeutics Market by Disease Areas
- 10.1.5.1 North America Autoimmune & Inflammatory Diseases Market by Country
- 10.1.5.2 North America Neurology Market by Country
- 10.1.5.3 North America Osteology Market by Country
- 10.1.5.4 North America Hematology Market by Country
- 10.1.5.5 North America Oncology Market by Country
- 10.1.5.6 North America Infectious Diseases Market by Country
- 10.1.5.7 North America Immunology Market by Country
- 10.1.5.8 North America Others Market by Country
- 10.1.6 North America Antibody Therapeutics Market by Country
- 10.1.6.1 US Antibody Therapeutics Market
- 10.1.6.1.1 US Antibody Therapeutics Market by Route of Administration
- 10.1.6.1.2 US Antibody Therapeutics Market by Format
- 10.1.6.1.3 US Antibody Therapeutics Market by Source
- 10.1.6.1.4 US Antibody Therapeutics Market by End User
- 10.1.6.1.5 US Antibody Therapeutics Market by Disease Areas
- 10.1.6.2 Canada Antibody Therapeutics Market
- 10.1.6.2.1 Canada Antibody Therapeutics Market by Route of Administration
- 10.1.6.2.2 Canada Antibody Therapeutics Market by Format
- 10.1.6.2.3 Canada Antibody Therapeutics Market by Source
- 10.1.6.2.4 Canada Antibody Therapeutics Market by End User
- 10.1.6.2.5 Canada Antibody Therapeutics Market by Disease Areas
- 10.1.6.3 Mexico Antibody Therapeutics Market
- 10.1.6.3.1 Mexico Antibody Therapeutics Market by Route of Administration
- 10.1.6.3.2 Mexico Antibody Therapeutics Market by Format
- 10.1.6.3.3 Mexico Antibody Therapeutics Market by Source
- 10.1.6.3.4 Mexico Antibody Therapeutics Market by End User
- 10.1.6.3.5 Mexico Antibody Therapeutics Market by Disease Areas
- 10.1.6.4 Rest of North America Antibody Therapeutics Market
- 10.1.6.4.1 Rest of North America Antibody Therapeutics Market by Route of Administration
- 10.1.6.4.2 Rest of North America Antibody Therapeutics Market by Format
- 10.1.6.4.3 Rest of North America Antibody Therapeutics Market by Source
- 10.1.6.4.4 Rest of North America Antibody Therapeutics Market by End User
- 10.1.6.4.5 Rest of North America Antibody Therapeutics Market by Disease Areas
- 10.1.6.1 US Antibody Therapeutics Market
- 10.1.1 North America Antibody Therapeutics Market by Route of Administration
- 10.2 Europe Antibody Therapeutics Market
- 10.2.1 Europe Antibody Therapeutics Market by Route of Administration
- 10.2.1.1 Europe Intravenous Market by Country
- 10.2.1.2 Europe Subcutaneous Market by Country
- 10.2.1.3 Europe Others Market by Country
- 10.2.2 Europe Antibody Therapeutics Market by Format
- 10.2.2.1 Europe Monoclonal Antibody Market by Country
- 10.2.2.2 Europe Polyclonal Antibody Therapy Market by Country
- 10.2.2.3 Europe Bispecific Antibody Market by Country
- 10.2.2.4 Europe Antibody fragment & Others Market by Country
- 10.2.3 Europe Antibody Therapeutics Market by Source
- 10.2.3.1 Europe Human Market by Country
- 10.2.3.2 Europe Humanized Market by Country
- 10.2.3.3 Europe Chimeric Market by Country
- 10.2.3.4 Europe Others Market by Country
- 10.2.4 Europe Antibody Therapeutics Market by End User
- 10.2.4.1 Europe Hospitals Market by Country
- 10.2.4.2 Europe Long-term care facilities Market by Country
- 10.2.4.3 Europe Others Market by Country
- 10.2.5 Europe Antibody Therapeutics Market by Disease Areas
- 10.2.5.1 Europe Autoimmune & Inflammatory Diseases Market by Country
- 10.2.5.2 Europe Neurology Market by Country
- 10.2.5.3 Europe Osteology Market by Country
- 10.2.5.4 Europe Hematology Market by Country
- 10.2.5.5 Europe Oncology Market by Country
- 10.2.5.6 Europe Infectious Diseases Market by Country
- 10.2.5.7 Europe Immunology Market by Country
- 10.2.5.8 Europe Others Market by Country
- 10.2.6 Europe Antibody Therapeutics Market by Country
- 10.2.6.1 Germany Antibody Therapeutics Market
- 10.2.6.1.1 Germany Antibody Therapeutics Market by Route of Administration
- 10.2.6.1.2 Germany Antibody Therapeutics Market by Format
- 10.2.6.1.3 Germany Antibody Therapeutics Market by Source
- 10.2.6.1.4 Germany Antibody Therapeutics Market by End User
- 10.2.6.1.5 Germany Antibody Therapeutics Market by Disease Areas
- 10.2.6.2 UK Antibody Therapeutics Market
- 10.2.6.2.1 UK Antibody Therapeutics Market by Route of Administration
- 10.2.6.2.2 UK Antibody Therapeutics Market by Format
- 10.2.6.2.3 UK Antibody Therapeutics Market by Source
- 10.2.6.2.4 UK Antibody Therapeutics Market by End User
- 10.2.6.2.5 UK Antibody Therapeutics Market by Disease Areas
- 10.2.6.3 France Antibody Therapeutics Market
- 10.2.6.3.1 France Antibody Therapeutics Market by Route of Administration
- 10.2.6.3.2 France Antibody Therapeutics Market by Format
- 10.2.6.3.3 France Antibody Therapeutics Market by Source
- 10.2.6.3.4 France Antibody Therapeutics Market by End User
- 10.2.6.3.5 France Antibody Therapeutics Market by Disease Areas
- 10.2.6.4 Russia Antibody Therapeutics Market
- 10.2.6.4.1 Russia Antibody Therapeutics Market by Route of Administration
- 10.2.6.4.2 Russia Antibody Therapeutics Market by Format
- 10.2.6.4.3 Russia Antibody Therapeutics Market by Source
- 10.2.6.4.4 Russia Antibody Therapeutics Market by End User
- 10.2.6.4.5 Russia Antibody Therapeutics Market by Disease Areas
- 10.2.6.5 Spain Antibody Therapeutics Market
- 10.2.6.5.1 Spain Antibody Therapeutics Market by Route of Administration
- 10.2.6.5.2 Spain Antibody Therapeutics Market by Format
- 10.2.6.5.3 Spain Antibody Therapeutics Market by Source
- 10.2.6.5.4 Spain Antibody Therapeutics Market by End User
- 10.2.6.5.5 Spain Antibody Therapeutics Market by Disease Areas
- 10.2.6.6 Italy Antibody Therapeutics Market
- 10.2.6.6.1 Italy Antibody Therapeutics Market by Route of Administration
- 10.2.6.6.2 Italy Antibody Therapeutics Market by Format
- 10.2.6.6.3 Italy Antibody Therapeutics Market by Source
- 10.2.6.6.4 Italy Antibody Therapeutics Market by End User
- 10.2.6.6.5 Italy Antibody Therapeutics Market by Disease Areas
- 10.2.6.7 Rest of Europe Antibody Therapeutics Market
- 10.2.6.7.1 Rest of Europe Antibody Therapeutics Market by Route of Administration
- 10.2.6.7.2 Rest of Europe Antibody Therapeutics Market by Format
- 10.2.6.7.3 Rest of Europe Antibody Therapeutics Market by Source
- 10.2.6.7.4 Rest of Europe Antibody Therapeutics Market by End User
- 10.2.6.7.5 Rest of Europe Antibody Therapeutics Market by Disease Areas
- 10.2.6.1 Germany Antibody Therapeutics Market
- 10.2.1 Europe Antibody Therapeutics Market by Route of Administration
- 10.3 Asia Pacific Antibody Therapeutics Market
- 10.3.1 Asia Pacific Antibody Therapeutics Market by Route of Administration
- 10.3.1.1 Asia Pacific Intravenous Market by Country
- 10.3.1.2 Asia Pacific Subcutaneous Market by Country
- 10.3.1.3 Asia Pacific Others Market by Country
- 10.3.2 Asia Pacific Antibody Therapeutics Market by Format
- 10.3.2.1 Asia Pacific Monoclonal Antibody Market by Country
- 10.3.2.2 Asia Pacific Polyclonal Antibody Therapy Market by Country
- 10.3.2.3 Asia Pacific Bispecific Antibody Market by Country
- 10.3.2.4 Asia Pacific Antibody fragment & Others Market by Country
- 10.3.3 Asia Pacific Antibody Therapeutics Market by Source
- 10.3.3.1 Asia Pacific Human Market by Country
- 10.3.3.2 Asia Pacific Humanized Market by Country
- 10.3.3.3 Asia Pacific Chimeric Market by Country
- 10.3.3.4 Asia Pacific Others Market by Country
- 10.3.4 Asia Pacific Antibody Therapeutics Market by End User
- 10.3.4.1 Asia Pacific Hospitals Market by Country
- 10.3.4.2 Asia Pacific Long-term care facilities Market by Country
- 10.3.4.3 Asia Pacific Others Market by Country
- 10.3.5 Asia Pacific Antibody Therapeutics Market by Disease Areas
- 10.3.5.1 Asia Pacific Autoimmune & Inflammatory Diseases Market by Country
- 10.3.5.2 Asia Pacific Neurology Market by Country
- 10.3.5.3 Asia Pacific Osteology Market by Country
- 10.3.5.4 Asia Pacific Hematology Market by Country
- 10.3.5.5 Asia Pacific Oncology Market by Country
- 10.3.5.6 Asia Pacific Infectious Diseases Market by Country
- 10.3.5.7 Asia Pacific Immunology Market by Country
- 10.3.5.8 Asia Pacific Others Market by Country
- 10.3.6 Asia Pacific Antibody Therapeutics Market by Country
- 10.3.6.1 China Antibody Therapeutics Market
- 10.3.6.1.1 China Antibody Therapeutics Market by Route of Administration
- 10.3.6.1.2 China Antibody Therapeutics Market by Format
- 10.3.6.1.3 China Antibody Therapeutics Market by Source
- 10.3.6.1.4 China Antibody Therapeutics Market by End User
- 10.3.6.1.5 China Antibody Therapeutics Market by Disease Areas
- 10.3.6.2 Japan Antibody Therapeutics Market
- 10.3.6.2.1 Japan Antibody Therapeutics Market by Route of Administration
- 10.3.6.2.2 Japan Antibody Therapeutics Market by Format
- 10.3.6.2.3 Japan Antibody Therapeutics Market by Source
- 10.3.6.2.4 Japan Antibody Therapeutics Market by End User
- 10.3.6.2.5 Japan Antibody Therapeutics Market by Disease Areas
- 10.3.6.3 India Antibody Therapeutics Market
- 10.3.6.3.1 India Antibody Therapeutics Market by Route of Administration
- 10.3.6.3.2 India Antibody Therapeutics Market by Format
- 10.3.6.3.3 India Antibody Therapeutics Market by Source
- 10.3.6.3.4 India Antibody Therapeutics Market by End User
- 10.3.6.3.5 India Antibody Therapeutics Market by Disease Areas
- 10.3.6.4 South Korea Antibody Therapeutics Market
- 10.3.6.4.1 South Korea Antibody Therapeutics Market by Route of Administration
- 10.3.6.4.2 South Korea Antibody Therapeutics Market by Format
- 10.3.6.4.3 South Korea Antibody Therapeutics Market by Source
- 10.3.6.4.4 South Korea Antibody Therapeutics Market by End User
- 10.3.6.4.5 South Korea Antibody Therapeutics Market by Disease Areas
- 10.3.6.5 Singapore Antibody Therapeutics Market
- 10.3.6.5.1 Singapore Antibody Therapeutics Market by Route of Administration
- 10.3.6.5.2 Singapore Antibody Therapeutics Market by Format
- 10.3.6.5.3 Singapore Antibody Therapeutics Market by Source
- 10.3.6.5.4 Singapore Antibody Therapeutics Market by End User
- 10.3.6.5.5 Singapore Antibody Therapeutics Market by Disease Areas
- 10.3.6.6 Malaysia Antibody Therapeutics Market
- 10.3.6.6.1 Malaysia Antibody Therapeutics Market by Route of Administration
- 10.3.6.6.2 Malaysia Antibody Therapeutics Market by Format
- 10.3.6.6.3 Malaysia Antibody Therapeutics Market by Source
- 10.3.6.6.4 Malaysia Antibody Therapeutics Market by End User
- 10.3.6.6.5 Malaysia Antibody Therapeutics Market by Disease Areas
- 10.3.6.7 Rest of Asia Pacific Antibody Therapeutics Market
- 10.3.6.7.1 Rest of Asia Pacific Antibody Therapeutics Market by Route of Administration
- 10.3.6.7.2 Rest of Asia Pacific Antibody Therapeutics Market by Format
- 10.3.6.7.3 Rest of Asia Pacific Antibody Therapeutics Market by Source
- 10.3.6.7.4 Rest of Asia Pacific Antibody Therapeutics Market by End User
- 10.3.6.7.5 Rest of Asia Pacific Antibody Therapeutics Market by Disease Areas
- 10.3.6.1 China Antibody Therapeutics Market
- 10.3.1 Asia Pacific Antibody Therapeutics Market by Route of Administration
- 10.4 LAMEA Antibody Therapeutics Market
- 10.4.1 LAMEA Antibody Therapeutics Market by Route of Administration
- 10.4.1.1 LAMEA Intravenous Market by Country
- 10.4.1.2 LAMEA Subcutaneous Market by Country
- 10.4.1.3 LAMEA Others Market by Country
- 10.4.2 LAMEA Antibody Therapeutics Market by Format
- 10.4.2.1 LAMEA Monoclonal Antibody Market by Country
- 10.4.2.2 LAMEA Polyclonal Antibody Therapy Market by Country
- 10.4.2.3 LAMEA Bispecific Antibody Market by Country
- 10.4.2.4 LAMEA Antibody fragment & Others Market by Country
- 10.4.3 LAMEA Antibody Therapeutics Market by Source
- 10.4.3.1 LAMEA Human Market by Country
- 10.4.3.2 LAMEA Humanized Market by Country
- 10.4.3.3 LAMEA Chimeric Market by Country
- 10.4.3.4 LAMEA Others Market by Country
- 10.4.4 LAMEA Antibody Therapeutics Market by End User
- 10.4.4.1 LAMEA Hospitals Market by Country
- 10.4.4.2 LAMEA Long-term care facilities Market by Country
- 10.4.4.3 LAMEA Others Market by Country
- 10.4.5 LAMEA Antibody Therapeutics Market by Disease Areas
- 10.4.5.1 LAMEA Autoimmune & Inflammatory Diseases Market by Country
- 10.4.5.2 LAMEA Neurology Market by Country
- 10.4.5.3 LAMEA Osteology Market by Country
- 10.4.5.4 LAMEA Hematology Market by Country
- 10.4.5.5 LAMEA Oncology Market by Country
- 10.4.5.6 LAMEA Infectious Diseases Market by Country
- 10.4.5.7 LAMEA Immunology Market by Country
- 10.4.5.8 LAMEA Others Market by Country
- 10.4.6 LAMEA Antibody Therapeutics Market by Country
- 10.4.6.1 Brazil Antibody Therapeutics Market
- 10.4.6.1.1 Brazil Antibody Therapeutics Market by Route of Administration
- 10.4.6.1.2 Brazil Antibody Therapeutics Market by Format
- 10.4.6.1.3 Brazil Antibody Therapeutics Market by Source
- 10.4.6.1.4 Brazil Antibody Therapeutics Market by End User
- 10.4.6.1.5 Brazil Antibody Therapeutics Market by Disease Areas
- 10.4.6.2 Argentina Antibody Therapeutics Market
- 10.4.6.2.1 Argentina Antibody Therapeutics Market by Route of Administration
- 10.4.6.2.2 Argentina Antibody Therapeutics Market by Format
- 10.4.6.2.3 Argentina Antibody Therapeutics Market by Source
- 10.4.6.2.4 Argentina Antibody Therapeutics Market by End User
- 10.4.6.2.5 Argentina Antibody Therapeutics Market by Disease Areas
- 10.4.6.3 UAE Antibody Therapeutics Market
- 10.4.6.3.1 UAE Antibody Therapeutics Market by Route of Administration
- 10.4.6.3.2 UAE Antibody Therapeutics Market by Format
- 10.4.6.3.3 UAE Antibody Therapeutics Market by Source
- 10.4.6.3.4 UAE Antibody Therapeutics Market by End User
- 10.4.6.3.5 UAE Antibody Therapeutics Market by Disease Areas
- 10.4.6.4 Saudi Arabia Antibody Therapeutics Market
- 10.4.6.4.1 Saudi Arabia Antibody Therapeutics Market by Route of Administration
- 10.4.6.4.2 Saudi Arabia Antibody Therapeutics Market by Format
- 10.4.6.4.3 Saudi Arabia Antibody Therapeutics Market by Source
- 10.4.6.4.4 Saudi Arabia Antibody Therapeutics Market by End User
- 10.4.6.4.5 Saudi Arabia Antibody Therapeutics Market by Disease Areas
- 10.4.6.5 South Africa Antibody Therapeutics Market
- 10.4.6.5.1 South Africa Antibody Therapeutics Market by Route of Administration
- 10.4.6.5.2 South Africa Antibody Therapeutics Market by Format
- 10.4.6.5.3 South Africa Antibody Therapeutics Market by Source
- 10.4.6.5.4 South Africa Antibody Therapeutics Market by End User
- 10.4.6.5.5 South Africa Antibody Therapeutics Market by Disease Areas
- 10.4.6.6 Nigeria Antibody Therapeutics Market
- 10.4.6.6.1 Nigeria Antibody Therapeutics Market by Route of Administration
- 10.4.6.6.2 Nigeria Antibody Therapeutics Market by Format
- 10.4.6.6.3 Nigeria Antibody Therapeutics Market by Source
- 10.4.6.6.4 Nigeria Antibody Therapeutics Market by End User
- 10.4.6.6.5 Nigeria Antibody Therapeutics Market by Disease Areas
- 10.4.6.7 Rest of LAMEA Antibody Therapeutics Market
- 10.4.6.7.1 Rest of LAMEA Antibody Therapeutics Market by Route of Administration
- 10.4.6.7.2 Rest of LAMEA Antibody Therapeutics Market by Format
- 10.4.6.7.3 Rest of LAMEA Antibody Therapeutics Market by Source
- 10.4.6.7.4 Rest of LAMEA Antibody Therapeutics Market by End User
- 10.4.6.7.5 Rest of LAMEA Antibody Therapeutics Market by Disease Areas
- 10.4.6.1 Brazil Antibody Therapeutics Market
- 10.4.1 LAMEA Antibody Therapeutics Market by Route of Administration
Chapter 11. Company Profiles
- 11.1 F. Hoffmann-La Roche Ltd.
- 11.1.1 Company Overview
- 11.1.2 Financial Analysis
- 11.1.3 Segmental and Regional Analysis
- 11.1.4 Research & Development Expense
- 11.1.5 Recent strategies and developments:
- 11.1.5.1 Partnerships, Collaborations, and Agreements:
- 11.1.5.2 Product Launches and Product Expansions:
- 11.1.6 SWOT Analysis
- 11.2 AbbVie, Inc.
- 11.2.1 Company Overview
- 11.2.2 Financial Analysis
- 11.2.3 Regional Analysis
- 11.2.4 Research & Development Expense
- 11.2.5 Recent strategies and developments:
- 11.2.5.1 Partnerships, Collaborations, and Agreements:
- 11.2.5.2 Acquisition and Mergers:
- 11.2.6 SWOT Analysis
- 11.3 Johnson & Johnson (Johnson & Johnson Services, Inc.)
- 11.3.1 Company Overview
- 11.3.2 Financial Analysis
- 11.3.3 Segmental &Regional Analysis
- 11.3.4 Research & Development Expenses
- 11.3.5 Recent strategies and developments:
- 11.3.5.1 Partnerships, Collaborations, and Agreements:
- 11.3.6 SWOT Analysis
- 11.4 Merck KGaA
- 11.4.1 Company Overview
- 11.4.2 Financial Analysis
- 11.4.3 Segmental and Regional Analysis
- 11.4.4 Research & Development Expense
- 11.4.5 Recent strategies and developments:
- 11.4.5.1 Partnerships, Collaborations, and Agreements:
- 11.4.6 SWOT Analysis
- 11.5 Bristol Myers Squibb Company
- 11.5.1 Company Overview
- 11.5.2 Financial Analysis
- 11.5.3 Regional Analysis
- 11.5.4 Research & Development Expenses
- 11.5.5 Recent strategies and developments:
- 11.5.5.1 Acquisition and Mergers:
- 11.5.6 SWOT Analysis
- 11.6 AstraZeneca PLC
- 11.6.1 Company Overview
- 11.6.2 Financial Analysis
- 11.6.3 Regional Analysis
- 11.6.4 Research & Development Expenses
- 11.6.5 SWOT Analysis
- 11.7 Sanofi S.A.
- 11.7.1 Company Overview
- 11.7.2 Financial Analysis
- 11.7.3 Segmental and Regional Analysis
- 11.7.4 Research & Development Expense
- 11.7.5 SWOT Analysis
- 11.8 Novartis AG
- 11.8.1 Company Overview
- 11.8.2 Financial Analysis
- 11.8.3 Segmental and Regional Analysis
- 11.8.4 Research & Development Expense
- 11.8.5 SWOT Analysis
- 11.9 Biogen, Inc.
- 11.9.1 Company Overview
- 11.9.2 Financial Analysis
- 11.9.3 Regional Analysis
- 11.9.4 Research & Development Expense
- 11.9.5 SWOT Analysis
- 11.10. Amgen, Inc.
- 11.10.1 Company Overview
- 11.10.2 Financial Analysis
- 11.10.3 Regional Analysis
- 11.10.4 Research & Development Expenses
- 11.10.5 SWOT Analysis

