|
|
市場調査レポート
商品コード
1374082
グラフィックプロセッサの世界市場規模、シェア、産業動向分析レポート:展開別、コンポーネント別、用途別、タイプ別、地域別展望と予測、2023年~2030年Global Graphic Processor Market Size, Share & Industry Trends Analysis Report By Deployment (Cloud, and On-premise), By Component (Hardware, Software, and Services), By Application, By Type, By Regional Outlook and Forecast, 2023 - 2030 |
||||||
|
|
|||||||
|
|||||||


| グラフィックプロセッサの世界市場規模、シェア、産業動向分析レポート:展開別、コンポーネント別、用途別、タイプ別、地域別展望と予測、2023年~2030年 |
|
出版日: 2023年09月30日
発行: KBV Research
ページ情報: 英文 373 Pages
納期: 即納可能
|

- 全表示
- 概要
- 図表
- 目次
グラフィックプロセッサ市場規模は、予測期間中にCAGR 26.9%で成長し、2030年には3,275億米ドルに達すると予測されます。2022年の市場規模は9,511万600台、成長率は18.8%(2019-2022年)。
KBVカーディナルマトリックスに示された分析によると、サムスン電子が同市場における先駆者です。2023年6月、Intel Corporationは、グラフィックス・プロセッシング・ユニット(GPU)のIntel(R)Arc(TM)Pro A-series分野でIntel(R)Arc(TM)Pro A60とPro A60Mを発表しました。QUALCOMM Incorporated、Intel Corporation、ソニー株式会社などの企業が、この市場における主要なイノベーターです。
市場成長要因
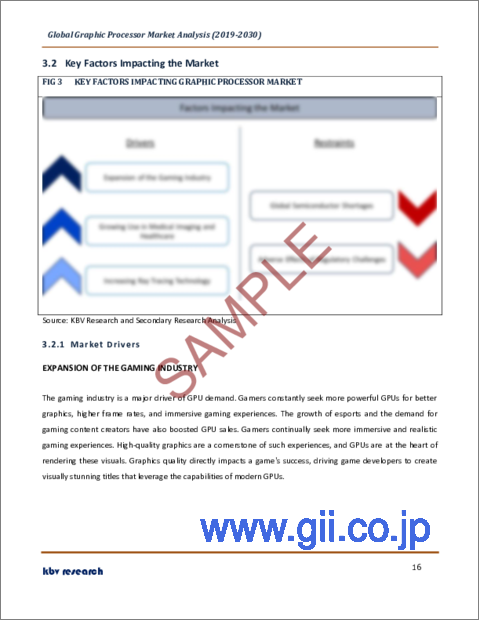
ゲーム産業の拡大
ゲーム産業はGPU需要の主要な原動力です。ゲーマーは、より優れたグラフィックス、より高いフレームレート、没入感のあるゲーム体験のために、より強力なGPUを常に求めています。esportsの成長とゲームコンテンツクリエーターの需要もGPUの売上を押し上げています。ゲーマーは、より没入感のあるリアルなゲーム体験を求め続けています。高品質なグラフィックはこうした体験の要であり、GPUはこうしたビジュアルのレンダリングの中核を担っています。グラフィックスの品質はゲームの成功に直接影響するため、ゲーム開発者は最新のGPUの能力を活用した視覚的に美しいタイトルの制作に取り組んでいます。4Kやウルトラワイドスクリーンを含む高解像度モニターやディスプレイが利用可能になったことで、鮮明で詳細なビジュアルを提供するための高い処理能力を持つGPUの需要が高まっています。ゲーム産業の拡大も市場の大きな促進要因となっています。
医療画像とヘルスケアにおける用途の拡大
GPUは、医療用画像処理、ゲノム配列決定、創薬に使用され、研究を加速し、患者の治療を改善しています。ヘルスケア業界におけるテクノロジーへの依存の高まりが、GPUの成長を後押ししています。GPUは、MRI、CTスキャン、超音波画像などの高解像度医療画像を処理し、レンダリングします。これらのGPUは、画像の品質を向上させ、医療専門家によるリアルタイムの視覚化を可能にします。GPU技術の進歩により、3Dおよび4Dイメージングが容易になり、診断や治療計画に貴重な知見がもたらされます。機械学習とAIアルゴリズムは、学習と推論タスクにGPUを大いに活用しています。AIは医療画像の自動解析を支援し、臨床医がより正確かつ迅速に異常や病気を検出するのに役立ちます。医療画像とヘルスケア・アプリケーションの成長は、市場に大きな影響を与えています。
市場抑制要因
規制課題による悪影響
政府が課す輸出規制や貿易制限は、特定の技術の入手を制限したり、市場アクセスを制約したりすることで、市場に影響を与えます。さまざまな国の政府が、GPUを含む特定の技術に対して輸出規制や貿易制限を課しています。これらの規制はGPUの輸出入に影響を与え、特定の地域における市場アクセスを制限します。GPUメーカーは、変更される可能性のある複雑な輸出コンプライアンス法をナビゲートする必要があります。知的財産(IP)紛争や特許訴訟は、グラフィック・プロセッサー市場を含むテクノロジー業界では一般的です。こうした法的課題は、コストのかかる法廷闘争や製品販売の制限、ライセンス料の支払いにつながります。したがって、より広範な技術産業と同様、グラフィック・プロセッサー市場も、その事業と成長に影響を与えるさまざまな規制上の課題に直面しています。
開発の見通し
導入形態によって、市場はオンプレミスとクラウドに分けられます。2022年の市場では、オンプレミス型セグメントが大きな収益シェアを獲得しました。オンプレミスの導入は、データが組織のネットワーク内に留まるため、データのセキュリティとプライバシーを強化し、サードパーティのクラウドプロバイダーにさらされるリスクを低減します。オンプレミスGPUは、データ処理がローカルで行われるため、クラウドベースのソリューションよりもレイテンシが低いです。既存のインフラやアプリケーションと統合するようにカスタマイズされたオンプレミス・ソリューションは、シームレスな互換性を提供します。
コンポーネントの展望
コンポーネント別に見ると、市場はハードウェア、ソフトウェア、サービスに分類されます。2022年には、ハードウェア・セグメントが市場で最も高い売上シェアを占めました。ハードウェア・セグメントは、GPUを収容・接続するプリント回路基板(PCB)、迅速なデータ保存のためのVRAM(ビデオ・ランダム・アクセス・メモリ)モジュール、さまざまな作業負荷下で最適な性能を確保する冷却技術、インターフェース、出力、電源コネクタ、BIOSで構成されます。レイトレーシング・コア、AIアクセラレーション用テンソル・コア、特殊なリアルタイム・レイトレーシングなどの最新のハードウェアの進歩により、利用可能なハードウェアの幅がさらに広がり、ビジュアル品質と計算能力が向上しています。
アプリケーションの展望
アプリケーション別に見ると、市場はコンシューマーエレクトロニクス、IT・通信、ヘルスケア、メディア・エンターテインメント、その他に区分されます。2022年の市場では、IT・通信分野が顕著な収益シェアを記録しました。IT分野のGPU需要は、データセンターの拡張と高性能コンピューティングのニーズが原動力となっています。GPUは、データセンターにおけるAIの推論、トレーニング、データ分析に使用されています。通信会社では、ネットワーク機能の高速化、コンテンツ配信の改善、セキュリティ強化のために、データセンターにGPUを導入するケースが増えています。AIと機械学習はIT・通信の両事業に不可欠です。GPUはAIワークロードを高速化し、リアルタイムの意思決定と自動化を可能にする上で極めて重要です。
タイプ別展望
市場はタイプ別に、統合型、専用型、ハイブリッド型に分類されます。2022年には、統合型セグメントが市場で最大の収益シェアを占めました。システムの利用可能なRAMは、統合型グラフィックスカードによって運用業務に利用されます。これらのカードの機能性は、エントリーレベルのノートパソコンの高いグラフィック要求よりも優先されます。さらに、内蔵カードはシステム・メモリの使用率が高くなるため、ゲームや画像編集のようなリソースを多用する作業ではシステム・パフォーマンスが低下します。これらのカードは、コストを削減し、エネルギーを節約し、グラフィックスソリューションに関連するノイズの排出を最小限に抑えることで、経済的なメリットをもたらします。
地域別展望
地域別に見ると、市場は北米、欧州、アジア太平洋、LAMEAで分析されます。2022年には、北米地域がグラフィックプロセッサ市場で大きな収益シェアを獲得しました。北米のグラフィックプロセッサ市場は、主に同地域の活況を呈するテクノロジーとエンターテインメント部門によって牽引されています。複雑な視覚効果、3Dモデリング、ゲーム体験を可能にする最先端のGPUに対する需要は、シリコンバレーやハリウッドといった場所に主要な技術拠点やエンターテインメントの中心地が存在するため、一貫して高いです。AIと機械学習革命も重要な推進力であり、GPUはAI計算を後押しし、金融やヘルスケアなどさまざまな業界でイノベーションを促進するために不可欠です。
目次
第1章 市場範囲と調査手法
- 市場の定義
- 目的
- 市場範囲
- セグメンテーション
- 調査手法
第2章 市場の概要
- 主なハイライト
第3章 市場概要
- イントロダクション
- 概要
- 市場構成とシナリオ
- 概要
- 市場に影響を与える主な要因
- 市場促進要因
- 市場抑制要因
第4章 競合分析- 世界
- KBV Cardinal Matrix
- 最近の業界全体の戦略的展開
- パートナーシップ、コラボレーション、および契約
- 製品の発売と製品の拡大
- 買収と合併
- 市場シェア分析2022
- 主要成功戦略
- 主な戦略
- 主要な戦略的動き
- ポーターのファイブフォース分析
第5章 世界のグラフィックプロセッサ市場:展開別
- 世界のクラウド市場:地域別
- 世界のオンプレミス市場:地域別
第6章 世界のグラフィックプロセッサ市場:コンポーネント別
- 世界のハードウェア市場:地域別
- 世界のソフトウェア市場:地域別
- 世界サービス市場:地域別
第7章 世界のグラフィックプロセッサ市場:用途別
- 世界の家電市場:地域別
- 世界のIT・通信市場:地域別
- 世界のヘルスケア市場:地域別
- 世界のメディア&エンターテインメント市場:地域別
- 世界のその他の市場:地域別
第8章 世界のグラフィックプロセッサ市場:タイプ別
- 世界統合市場:地域別
- 世界専用マーケット:地域別
- 世界のハイブリッド市場:地域別
第9章 世界のグラフィックプロセッサ市場:地域別
- 北米
- 北米の市場:国別
- 米国
- カナダ
- メキシコ
- その他北米地域
- 北米の市場:国別
- 欧州
- 欧州の市場:国別
- ドイツ
- 英国
- フランス
- ロシア
- スペイン
- イタリア
- その他欧州地域
- 欧州の市場:国別
- アジア太平洋
- アジア太平洋の市場:国別
- 中国
- 日本
- インド
- 韓国
- シンガポール
- マレーシア
- その他アジア太平洋地域
- アジア太平洋の市場:国別
- ラテンアメリカ・中東・アフリカ
- ラテンアメリカ・中東・アフリカの市場:国別
- ブラジル
- アルゼンチン
- アラブ首長国連邦
- サウジアラビア
- 南アフリカ
- ナイジェリア
- その他ラテンアメリカ・中東・アフリカ地域
- ラテンアメリカ・中東・アフリカの市場:国別
第10章 企業プロファイル
- NVIDIA Corporation
- Advanced Micro Devices, Inc
- Samsung Electronics Co, Ltd.(Samsung Group)
- Intel Corporation
- Qualcomm Incorporated(Qualcomm Technologies, Inc)
- Imagination Technologies Limited
- Matrox Electronic Systems Ltd
- IBM Corporation
- Sony Corporation
- VIA Technologies, Inc
第11章 グラフィックプロセッサ市場の勝利の必須条件
LIST OF TABLES
- TABLE 1 Global Graphic Processor Market, 2019 - 2022, USD Million
- TABLE 2 Global Graphic Processor Market, 2023 - 2030, USD Million
- TABLE 3 Global Graphic Processor Market, 2019 - 2022, Thousand Units
- TABLE 4 Global Graphic Processor Market, 2023 - 2030, Thousand Units
- TABLE 5 Partnerships, Collaborations and Agreements- Graphic Processor Market
- TABLE 6 Product Launches And Product Expansions- Graphic Processor Market
- TABLE 7 Acquisition and Mergers- Graphic Processor Market
- TABLE 8 Global Graphic Processor Market by Deployment, 2019 - 2022, USD Million
- TABLE 9 Global Graphic Processor Market by Deployment, 2023 - 2030, USD Million
- TABLE 10 Global Cloud Market by Region, 2019 - 2022, USD Million
- TABLE 11 Global Cloud Market by Region, 2023 - 2030, USD Million
- TABLE 12 Global On-premise Market by Region, 2019 - 2022, USD Million
- TABLE 13 Global On-premise Market by Region, 2023 - 2030, USD Million
- TABLE 14 Global Graphic Processor Market by Component, 2019 - 2022, USD Million
- TABLE 15 Global Graphic Processor Market by Component, 2023 - 2030, USD Million
- TABLE 16 Global Hardware Market by Region, 2019 - 2022, USD Million
- TABLE 17 Global Hardware Market by Region, 2023 - 2030, USD Million
- TABLE 18 Global Software Market by Region, 2019 - 2022, USD Million
- TABLE 19 Global Software Market by Region, 2023 - 2030, USD Million
- TABLE 20 Global Services Market by Region, 2019 - 2022, USD Million
- TABLE 21 Global Services Market by Region, 2023 - 2030, USD Million
- TABLE 22 Global Graphic Processor Market by Application, 2019 - 2022, USD Million
- TABLE 23 Global Graphic Processor Market by Application, 2023 - 2030, USD Million
- TABLE 24 Global Graphic Processor Market by Application, 2019 - 2022, Thousand Units
- TABLE 25 Global Graphic Processor Market by Application, 2023 - 2030, Thousand Units
- TABLE 26 Global Consumer Electronics Market by Region, 2019 - 2022, USD Million
- TABLE 27 Global Consumer Electronics Market by Region, 2023 - 2030, USD Million
- TABLE 28 Global Consumer Electronics Market by Region, 2019 - 2022, Thousand Units
- TABLE 29 Global Consumer Electronics Market by Region, 2023 - 2030, Thousand Units
- TABLE 30 Global IT & Telecommunication Market by Region, 2019 - 2022, USD Million
- TABLE 31 Global IT & Telecommunication Market by Region, 2023 - 2030, USD Million
- TABLE 32 Global IT & Telecommunication Market by Region, 2019 - 2022, Thousand Units
- TABLE 33 Global IT & Telecommunication Market by Region, 2023 - 2030, Thousand Units
- TABLE 34 Global Healthcare Market by Region, 2019 - 2022, USD Million
- TABLE 35 Global Healthcare Market by Region, 2023 - 2030, USD Million
- TABLE 36 Global Healthcare Market by Region, 2019 - 2022, Thousand Units
- TABLE 37 Global Healthcare Market by Region, 2023 - 2030, Thousand Units
- TABLE 38 Global Media & Entertainment Market by Region, 2019 - 2022, USD Million
- TABLE 39 Global Media & Entertainment Market by Region, 2023 - 2030, USD Million
- TABLE 40 Global Media & Entertainment Market by Region, 2019 - 2022, Thousand Units
- TABLE 41 Global Media & Entertainment Market by Region, 2023 - 2030, Thousand Units
- TABLE 42 Global Others Market by Region, 2019 - 2022, USD Million
- TABLE 43 Global Others Market by Region, 2023 - 2030, USD Million
- TABLE 44 Global Others Market by Region, 2019 - 2022, Thousand Units
- TABLE 45 Global Others Market by Region, 2023 - 2030, Thousand Units
- TABLE 46 Global Graphic Processor Market by Type, 2019 - 2022, USD Million
- TABLE 47 Global Graphic Processor Market by Type, 2023 - 2030, USD Million
- TABLE 48 Global Integrated Market by Region, 2019 - 2022, USD Million
- TABLE 49 Global Integrated Market by Region, 2023 - 2030, USD Million
- TABLE 50 Global Dedicated Market by Region, 2019 - 2022, USD Million
- TABLE 51 Global Dedicated Market by Region, 2023 - 2030, USD Million
- TABLE 52 Global Hybrid Market by Region, 2019 - 2022, USD Million
- TABLE 53 Global Hybrid Market by Region, 2023 - 2030, USD Million
- TABLE 54 Global Graphic Processor Market by Region, 2019 - 2022, USD Million
- TABLE 55 Global Graphic Processor Market by Region, 2023 - 2030, USD Million
- TABLE 56 Global Graphic Processor Market by Region, 2019 - 2022, Thousand Units
- TABLE 57 Global Graphic Processor Market by Region, 2023 - 2030, Thousand Units
- TABLE 58 North America Graphic Processor Market, 2019 - 2022, USD Million
- TABLE 59 North America Graphic Processor Market, 2023 - 2030, USD Million
- TABLE 60 North America Graphic Processor Market, 2019 - 2022, Thousand Units
- TABLE 61 North America Graphic Processor Market, 2023 - 2030, Thousand Units
- TABLE 62 North America Graphic Processor Market by Deployment, 2019 - 2022, USD Million
- TABLE 63 North America Graphic Processor Market by Deployment, 2023 - 2030, USD Million
- TABLE 64 North America Cloud Market by Region, 2019 - 2022, USD Million
- TABLE 65 North America Cloud Market by Region, 2023 - 2030, USD Million
- TABLE 66 North America On-premise Market by Region, 2019 - 2022, USD Million
- TABLE 67 North America On-premise Market by Region, 2023 - 2030, USD Million
- TABLE 68 North America Graphic Processor Market by Component, 2019 - 2022, USD Million
- TABLE 69 North America Graphic Processor Market by Component, 2023 - 2030, USD Million
- TABLE 70 North America Hardware Market by Country, 2019 - 2022, USD Million
- TABLE 71 North America Hardware Market by Country, 2023 - 2030, USD Million
- TABLE 72 North America Software Market by Country, 2019 - 2022, USD Million
- TABLE 73 North America Software Market by Country, 2023 - 2030, USD Million
- TABLE 74 North America Services Market by Country, 2019 - 2022, USD Million
- TABLE 75 North America Services Market by Country, 2023 - 2030, USD Million
- TABLE 76 North America Graphic Processor Market by Application, 2019 - 2022, USD Million
- TABLE 77 North America Graphic Processor Market by Application, 2023 - 2030, USD Million
- TABLE 78 North America Graphic Processor Market by Application, 2019 - 2022, Thousand Units
- TABLE 79 North America Graphic Processor Market by Application, 2023 - 2030, Thousand Units
- TABLE 80 North America Consumer Electronics Market by Country, 2019 - 2022, USD Million
- TABLE 81 North America Consumer Electronics Market by Country, 2023 - 2030, USD Million
- TABLE 82 North America Consumer Electronics Market by Country, 2019 - 2022, Thousand Units
- TABLE 83 North America Consumer Electronics Market by Country, 2023 - 2030, Thousand Units
- TABLE 84 North America IT & Telecommunication Market by Country, 2019 - 2022, USD Million
- TABLE 85 North America IT & Telecommunication Market by Country, 2023 - 2030, USD Million
- TABLE 86 North America IT & Telecommunication Market by Country, 2019 - 2022, Thousand Units
- TABLE 87 North America IT & Telecommunication Market by Country, 2023 - 2030, Thousand Units
- TABLE 88 North America Healthcare Market by Country, 2019 - 2022, USD Million
- TABLE 89 North America Healthcare Market by Country, 2023 - 2030, USD Million
- TABLE 90 North America Healthcare Market by Country, 2019 - 2022, Thousand Units
- TABLE 91 North America Healthcare Market by Country, 2023 - 2030, Thousand Units
- TABLE 92 North America Media & Entertainment Market by Country, 2019 - 2022, USD Million
- TABLE 93 North America Media & Entertainment Market by Country, 2023 - 2030, USD Million
- TABLE 94 North America Media & Entertainment Market by Country, 2019 - 2022, Thousand Units
- TABLE 95 North America Media & Entertainment Market by Country, 2023 - 2030, Thousand Units
- TABLE 96 North America Others Market by Country, 2019 - 2022, USD Million
- TABLE 97 North America Others Market by Country, 2023 - 2030, USD Million
- TABLE 98 North America Others Market by Country, 2019 - 2022, Thousand Units
- TABLE 99 North America Others Market by Country, 2023 - 2030, Thousand Units
- TABLE 100 North America Graphic Processor Market by Type, 2019 - 2022, USD Million
- TABLE 101 North America Graphic Processor Market by Type, 2023 - 2030, USD Million
- TABLE 102 North America Integrated Market by Country, 2019 - 2022, USD Million
- TABLE 103 North America Integrated Market by Country, 2023 - 2030, USD Million
- TABLE 104 North America Dedicated Market by Country, 2019 - 2022, USD Million
- TABLE 105 North America Dedicated Market by Country, 2023 - 2030, USD Million
- TABLE 106 North America Hybrid Market by Country, 2019 - 2022, USD Million
- TABLE 107 North America Hybrid Market by Country, 2023 - 2030, USD Million
- TABLE 108 North America Graphic Processor Market by Country, 2019 - 2022, USD Million
- TABLE 109 North America Graphic Processor Market by Country, 2023 - 2030, USD Million
- TABLE 110 North America Graphic Processor Market by Country, 2019 - 2022, Thousand Units
- TABLE 111 North America Graphic Processor Market by Country, 2023 - 2030, Thousand Units
- TABLE 112 US Graphic Processor Market, 2019 - 2022, USD Million
- TABLE 113 US Graphic Processor Market, 2023 - 2030, USD Million
- TABLE 114 US Graphic Processor Market, 2019 - 2022, Thousand Units
- TABLE 115 US Graphic Processor Market, 2023 - 2030, Thousand Units
- TABLE 116 US Graphic Processor Market by Deployment, 2019 - 2022, USD Million
- TABLE 117 US Graphic Processor Market by Deployment, 2023 - 2030, USD Million
- TABLE 118 US Graphic Processor Market by Component, 2019 - 2022, USD Million
- TABLE 119 US Graphic Processor Market by Component, 2023 - 2030, USD Million
- TABLE 120 US Graphic Processor Market by Application, 2019 - 2022, USD Million
- TABLE 121 US Graphic Processor Market by Application, 2023 - 2030, USD Million
- TABLE 122 US Graphic Processor Market by Application, 2019 - 2022, Thousand Units
- TABLE 123 US Graphic Processor Market by Application, 2023 - 2030, Thousand Units
- TABLE 124 US Graphic Processor Market by Type, 2019 - 2022, USD Million
- TABLE 125 US Graphic Processor Market by Type, 2023 - 2030, USD Million
- TABLE 126 Canada Graphic Processor Market, 2019 - 2022, USD Million
- TABLE 127 Canada Graphic Processor Market, 2023 - 2030, USD Million
- TABLE 128 Canada Graphic Processor Market, 2019 - 2022, Thousand Units
- TABLE 129 Canada Graphic Processor Market, 2023 - 2030, Thousand Units
- TABLE 130 Canada Graphic Processor Market by Deployment, 2019 - 2022, USD Million
- TABLE 131 Canada Graphic Processor Market by Deployment, 2023 - 2030, USD Million
- TABLE 132 Canada Graphic Processor Market by Component, 2019 - 2022, USD Million
- TABLE 133 Canada Graphic Processor Market by Component, 2023 - 2030, USD Million
- TABLE 134 Canada Graphic Processor Market by Application, 2019 - 2022, USD Million
- TABLE 135 Canada Graphic Processor Market by Application, 2023 - 2030, USD Million
- TABLE 136 Canada Graphic Processor Market by Application, 2019 - 2022, Thousand Units
- TABLE 137 Canada Graphic Processor Market by Application, 2023 - 2030, Thousand Units
- TABLE 138 Canada Graphic Processor Market by Type, 2019 - 2022, USD Million
- TABLE 139 Canada Graphic Processor Market by Type, 2023 - 2030, USD Million
- TABLE 140 Mexico Graphic Processor Market, 2019 - 2022, USD Million
- TABLE 141 Mexico Graphic Processor Market, 2023 - 2030, USD Million
- TABLE 142 Mexico Graphic Processor Market, 2019 - 2022, Thousand Units
- TABLE 143 Mexico Graphic Processor Market, 2023 - 2030, Thousand Units
- TABLE 144 Mexico Graphic Processor Market by Deployment, 2019 - 2022, USD Million
- TABLE 145 Mexico Graphic Processor Market by Deployment, 2023 - 2030, USD Million
- TABLE 146 Mexico Graphic Processor Market by Component, 2019 - 2022, USD Million
- TABLE 147 Mexico Graphic Processor Market by Component, 2023 - 2030, USD Million
- TABLE 148 Mexico Graphic Processor Market by Application, 2019 - 2022, USD Million
- TABLE 149 Mexico Graphic Processor Market by Application, 2023 - 2030, USD Million
- TABLE 150 Mexico Graphic Processor Market by Application, 2019 - 2022, Thousand Units
- TABLE 151 Mexico Graphic Processor Market by Application, 2023 - 2030, Thousand Units
- TABLE 152 Mexico Graphic Processor Market by Type, 2019 - 2022, USD Million
- TABLE 153 Mexico Graphic Processor Market by Type, 2023 - 2030, USD Million
- TABLE 154 Rest of North America Graphic Processor Market, 2019 - 2022, USD Million
- TABLE 155 Rest of North America Graphic Processor Market, 2023 - 2030, USD Million
- TABLE 156 Rest of North America Graphic Processor Market, 2019 - 2022, Thousand Units
- TABLE 157 Rest of North America Graphic Processor Market, 2023 - 2030, Thousand Units
- TABLE 158 Rest of North America Graphic Processor Market by Deployment, 2019 - 2022, USD Million
- TABLE 159 Rest of North America Graphic Processor Market by Deployment, 2023 - 2030, USD Million
- TABLE 160 Rest of North America Graphic Processor Market by Component, 2019 - 2022, USD Million
- TABLE 161 Rest of North America Graphic Processor Market by Component, 2023 - 2030, USD Million
- TABLE 162 Rest of North America Graphic Processor Market by Application, 2019 - 2022, USD Million
- TABLE 163 Rest of North America Graphic Processor Market by Application, 2023 - 2030, USD Million
- TABLE 164 Rest of North America Graphic Processor Market by Application, 2019 - 2022, Thousand Units
- TABLE 165 Rest of North America Graphic Processor Market by Application, 2023 - 2030, Thousand Units
- TABLE 166 Rest of North America Graphic Processor Market by Type, 2019 - 2022, USD Million
- TABLE 167 Rest of North America Graphic Processor Market by Type, 2023 - 2030, USD Million
- TABLE 168 Europe Graphic Processor Market, 2019 - 2022, USD Million
- TABLE 169 Europe Graphic Processor Market, 2023 - 2030, USD Million
- TABLE 170 Europe Graphic Processor Market, 2019 - 2022, Thousand Units
- TABLE 171 Europe Graphic Processor Market, 2023 - 2030, Thousand Units
- TABLE 172 Europe Graphic Processor Market by Deployment, 2019 - 2022, USD Million
- TABLE 173 Europe Graphic Processor Market by Deployment, 2023 - 2030, USD Million
- TABLE 174 Europe Cloud Market by Country, 2019 - 2022, USD Million
- TABLE 175 Europe Cloud Market by Country, 2023 - 2030, USD Million
- TABLE 176 Europe On-premise Market by Country, 2019 - 2022, USD Million
- TABLE 177 Europe On-premise Market by Country, 2023 - 2030, USD Million
- TABLE 178 Europe Graphic Processor Market by Component, 2019 - 2022, USD Million
- TABLE 179 Europe Graphic Processor Market by Component, 2023 - 2030, USD Million
- TABLE 180 Europe Hardware Market by Country, 2019 - 2022, USD Million
- TABLE 181 Europe Hardware Market by Country, 2023 - 2030, USD Million
- TABLE 182 Europe Software Market by Country, 2019 - 2022, USD Million
- TABLE 183 Europe Software Market by Country, 2023 - 2030, USD Million
- TABLE 184 Europe Services Market by Country, 2019 - 2022, USD Million
- TABLE 185 Europe Services Market by Country, 2023 - 2030, USD Million
- TABLE 186 Europe Graphic Processor Market by Application, 2019 - 2022, USD Million
- TABLE 187 Europe Graphic Processor Market by Application, 2023 - 2030, USD Million
- TABLE 188 Europe Graphic Processor Market by Application, 2019 - 2022, Thousand Units
- TABLE 189 Europe Graphic Processor Market by Application, 2023 - 2030, Thousand Units
- TABLE 190 Europe Consumer Electronics Market by Country, 2019 - 2022, USD Million
- TABLE 191 Europe Consumer Electronics Market by Country, 2023 - 2030, USD Million
- TABLE 192 Europe Consumer Electronics Market by Country, 2019 - 2022, Thousand Units
- TABLE 193 Europe Consumer Electronics Market by Country, 2023 - 2030, Thousand Units
- TABLE 194 Europe IT & Telecommunication Market by Country, 2019 - 2022, USD Million
- TABLE 195 Europe IT & Telecommunication Market by Country, 2023 - 2030, USD Million
- TABLE 196 Europe IT & Telecommunication Market by Country, 2019 - 2022, Thousand Units
- TABLE 197 Europe IT & Telecommunication Market by Country, 2023 - 2030, Thousand Units
- TABLE 198 Europe Healthcare Market by Country, 2019 - 2022, USD Million
- TABLE 199 Europe Healthcare Market by Country, 2023 - 2030, USD Million
- TABLE 200 Europe Healthcare Market by Country, 2019 - 2022, Thousand Units
- TABLE 201 Europe Healthcare Market by Country, 2023 - 2030, Thousand Units
- TABLE 202 Europe Media & Entertainment Market by Country, 2019 - 2022, USD Million
- TABLE 203 Europe Media & Entertainment Market by Country, 2023 - 2030, USD Million
- TABLE 204 Europe Media & Entertainment Market by Country, 2019 - 2022, Thousand Units
- TABLE 205 Europe Media & Entertainment Market by Country, 2023 - 2030, Thousand Units
- TABLE 206 Europe Others Market by Country, 2019 - 2022, USD Million
- TABLE 207 Europe Others Market by Country, 2023 - 2030, USD Million
- TABLE 208 Europe Others Market by Country, 2019 - 2022, Thousand Units
- TABLE 209 Europe Others Market by Country, 2023 - 2030, Thousand Units
- TABLE 210 Europe Graphic Processor Market by Type, 2019 - 2022, USD Million
- TABLE 211 Europe Graphic Processor Market by Type, 2023 - 2030, USD Million
- TABLE 212 Europe Integrated Market by Country, 2019 - 2022, USD Million
- TABLE 213 Europe Integrated Market by Country, 2023 - 2030, USD Million
- TABLE 214 Europe Dedicated Market by Country, 2019 - 2022, USD Million
- TABLE 215 Europe Dedicated Market by Country, 2023 - 2030, USD Million
- TABLE 216 Europe Hybrid Market by Country, 2019 - 2022, USD Million
- TABLE 217 Europe Hybrid Market by Country, 2023 - 2030, USD Million
- TABLE 218 Europe Graphic Processor Market by Country, 2019 - 2022, USD Million
- TABLE 219 Europe Graphic Processor Market by Country, 2023 - 2030, USD Million
- TABLE 220 Europe Graphic Processor Market by Country, 2019 - 2022, Thousand Units
- TABLE 221 Europe Graphic Processor Market by Country, 2023 - 2030, Thousand Units
- TABLE 222 Germany Graphic Processor Market, 2019 - 2022, USD Million
- TABLE 223 Germany Graphic Processor Market, 2023 - 2030, USD Million
- TABLE 224 Germany Graphic Processor Market, 2019 - 2022, Thousand Units
- TABLE 225 Germany Graphic Processor Market, 2023 - 2030, Thousand Units
- TABLE 226 Germany Graphic Processor Market by Deployment, 2019 - 2022, USD Million
- TABLE 227 Germany Graphic Processor Market by Deployment, 2023 - 2030, USD Million
- TABLE 228 Germany Graphic Processor Market by Component, 2019 - 2022, USD Million
- TABLE 229 Germany Graphic Processor Market by Component, 2023 - 2030, USD Million
- TABLE 230 Germany Graphic Processor Market by Application, 2019 - 2022, USD Million
- TABLE 231 Germany Graphic Processor Market by Application, 2023 - 2030, USD Million
- TABLE 232 Germany Graphic Processor Market by Application, 2019 - 2022, Thousand Units
- TABLE 233 Germany Graphic Processor Market by Application, 2023 - 2030, Thousand Units
- TABLE 234 Germany Graphic Processor Market by Type, 2019 - 2022, USD Million
- TABLE 235 Germany Graphic Processor Market by Type, 2023 - 2030, USD Million
- TABLE 236 UK Graphic Processor Market, 2019 - 2022, USD Million
- TABLE 237 UK Graphic Processor Market, 2023 - 2030, USD Million
- TABLE 238 UK Graphic Processor Market, 2019 - 2022, Thousand Units
- TABLE 239 UK Graphic Processor Market, 2023 - 2030, Thousand Units
- TABLE 240 UK Graphic Processor Market by Deployment, 2019 - 2022, USD Million
- TABLE 241 UK Graphic Processor Market by Deployment, 2023 - 2030, USD Million
- TABLE 242 UK Graphic Processor Market by Component, 2019 - 2022, USD Million
- TABLE 243 UK Graphic Processor Market by Component, 2023 - 2030, USD Million
- TABLE 244 UK Graphic Processor Market by Application, 2019 - 2022, USD Million
- TABLE 245 UK Graphic Processor Market by Application, 2023 - 2030, USD Million
- TABLE 246 UK Graphic Processor Market by Application, 2019 - 2022, Thousand Units
- TABLE 247 UK Graphic Processor Market by Application, 2023 - 2030, Thousand Units
- TABLE 248 UK Graphic Processor Market by Type, 2019 - 2022, USD Million
- TABLE 249 UK Graphic Processor Market by Type, 2023 - 2030, USD Million
- TABLE 250 France Graphic Processor Market, 2019 - 2022, USD Million
- TABLE 251 France Graphic Processor Market, 2023 - 2030, USD Million
- TABLE 252 France Graphic Processor Market, 2019 - 2022, Thousand Units
- TABLE 253 France Graphic Processor Market, 2023 - 2030, Thousand Units
- TABLE 254 France Graphic Processor Market by Deployment, 2019 - 2022, USD Million
- TABLE 255 France Graphic Processor Market by Deployment, 2023 - 2030, USD Million
- TABLE 256 France Graphic Processor Market by Component, 2019 - 2022, USD Million
- TABLE 257 France Graphic Processor Market by Component, 2023 - 2030, USD Million
- TABLE 258 France Graphic Processor Market by Application, 2019 - 2022, USD Million
- TABLE 259 France Graphic Processor Market by Application, 2023 - 2030, USD Million
- TABLE 260 France Graphic Processor Market by Application, 2019 - 2022, Thousand Units
- TABLE 261 France Graphic Processor Market by Application, 2023 - 2030, Thousand Units
- TABLE 262 France Graphic Processor Market by Type, 2019 - 2022, USD Million
- TABLE 263 France Graphic Processor Market by Type, 2023 - 2030, USD Million
- TABLE 264 Russia Graphic Processor Market, 2019 - 2022, USD Million
- TABLE 265 Russia Graphic Processor Market, 2023 - 2030, USD Million
- TABLE 266 Russia Graphic Processor Market, 2019 - 2022, Thousand Units
- TABLE 267 Russia Graphic Processor Market, 2023 - 2030, Thousand Units
- TABLE 268 Russia Graphic Processor Market by Deployment, 2019 - 2022, USD Million
- TABLE 269 Russia Graphic Processor Market by Deployment, 2023 - 2030, USD Million
- TABLE 270 Russia Graphic Processor Market by Component, 2019 - 2022, USD Million
- TABLE 271 Russia Graphic Processor Market by Component, 2023 - 2030, USD Million
- TABLE 272 Russia Graphic Processor Market by Application, 2019 - 2022, USD Million
- TABLE 273 Russia Graphic Processor Market by Application, 2023 - 2030, USD Million
- TABLE 274 Russia Graphic Processor Market by Application, 2019 - 2022, Thousand Units
- TABLE 275 Russia Graphic Processor Market by Application, 2023 - 2030, Thousand Units
- TABLE 276 Russia Graphic Processor Market by Type, 2019 - 2022, USD Million
- TABLE 277 Russia Graphic Processor Market by Type, 2023 - 2030, USD Million
- TABLE 278 Spain Graphic Processor Market, 2019 - 2022, USD Million
- TABLE 279 Spain Graphic Processor Market, 2023 - 2030, USD Million
- TABLE 280 Spain Graphic Processor Market, 2019 - 2022, Thousand Units
- TABLE 281 Spain Graphic Processor Market, 2023 - 2030, Thousand Units
- TABLE 282 Spain Graphic Processor Market by Deployment, 2019 - 2022, USD Million
- TABLE 283 Spain Graphic Processor Market by Deployment, 2023 - 2030, USD Million
- TABLE 284 Spain Graphic Processor Market by Component, 2019 - 2022, USD Million
- TABLE 285 Spain Graphic Processor Market by Component, 2023 - 2030, USD Million
- TABLE 286 Spain Graphic Processor Market by Application, 2019 - 2022, USD Million
- TABLE 287 Spain Graphic Processor Market by Application, 2023 - 2030, USD Million
- TABLE 288 Spain Graphic Processor Market by Application, 2019 - 2022, Thousand Units
- TABLE 289 Spain Graphic Processor Market by Application, 2023 - 2030, Thousand Units
- TABLE 290 Spain Graphic Processor Market by Type, 2019 - 2022, USD Million
- TABLE 291 Spain Graphic Processor Market by Type, 2023 - 2030, USD Million
- TABLE 292 Italy Graphic Processor Market, 2019 - 2022, USD Million
- TABLE 293 Italy Graphic Processor Market, 2023 - 2030, USD Million
- TABLE 294 Italy Graphic Processor Market, 2019 - 2022, Thousand Units
- TABLE 295 Italy Graphic Processor Market, 2023 - 2030, Thousand Units
- TABLE 296 Italy Graphic Processor Market by Deployment, 2019 - 2022, USD Million
- TABLE 297 Italy Graphic Processor Market by Deployment, 2023 - 2030, USD Million
- TABLE 298 Italy Graphic Processor Market by Component, 2019 - 2022, USD Million
- TABLE 299 Italy Graphic Processor Market by Component, 2023 - 2030, USD Million
- TABLE 300 Italy Graphic Processor Market by Application, 2019 - 2022, USD Million
- TABLE 301 Italy Graphic Processor Market by Application, 2023 - 2030, USD Million
- TABLE 302 Italy Graphic Processor Market by Application, 2019 - 2022, Thousand Units
- TABLE 303 Italy Graphic Processor Market by Application, 2023 - 2030, Thousand Units
- TABLE 304 Italy Graphic Processor Market by Type, 2019 - 2022, USD Million
- TABLE 305 Italy Graphic Processor Market by Type, 2023 - 2030, USD Million
The Global Graphic Processor Market size is expected to reach $327.5 billion by 2030, rising at a market growth of 26.9% CAGR during the forecast period. In the year 2022, the market attained a volume of 95,110.6 thousand units, experiencing a growth of 18.8% (2019-2022).
GPUs play a vital role in enabling game developers to create cutting-edge games and satisfy the demands of the discerning gaming community. Thus, the Asia Pacific region acquired $19,118.3 million revenue of the market in 2022. The region is a game production and consumption hub, and a sizable audience expects immersive and graphically stunning gaming experiences. Additionally, the Asia Pacific region's emphasis on cutting-edge technologies like artificial intelligence, robotics, and autonomous vehicles has increased demand for GPUs. These technologies are driven by innovation across industries, advancing these transformational fields by relying on complicated computations that GPUs excel.
The major strategy followed by the market participants is Product Launches as the key developmental strategy to keep pace with the changing demands of end users. In, April, 2023, Matrox Electronic Systems Ltd. introduced its latest Matrox LUMA lineup of graphics cards featuring Intel Arc GPUs. Additionally, In May, 2023, Advanced Micro Devices, Inc. unveiled the AMD Ryzen and Athlon 7020 C-Series processors, based on 6nm technology, to deliver swift and responsive performance designed for contemporary productivity and multitasking tasks often found in educational and frontline work environments.
Based on the Analysis presented in the KBV Cardinal matrix; Samsung Electronics Co., Ltd. is the forerunner in the Market. In June, 2023, Intel Corporation unveiled Intel® Arc™ Pro A60 and Pro A60M within its Intel® Arc™ Pro A-series field of graphics processing units (GPUs). Companies such as QUALCOMM Incorporated, Intel Corporation, Sony Corporation are some of the key innovators in the Market.
Market Growth Factors
Expansion Of the Gaming Industry
The gaming industry is a major driver of GPU demand. Gamers constantly seek more powerful GPUs for better graphics, higher frame rates, and immersive gaming experiences. The growth of esports and the demand for gaming content creators have also boosted GPU sales. Gamers continually seek more immersive and realistic gaming experiences. High-quality graphics are a cornerstone of such experiences, and GPUs are at the heart of rendering these visuals. Graphics quality directly impacts a game's success, driving game developers to create visually stunning titles that leverage the capabilities of modern GPUs. The availability of high-resolution monitors and displays, including 4K and ultra-wide screens, has pushed the demand for GPUs with higher processing power to deliver crisp and detailed visuals. The expansion of the gaming industry has been a significant driver of the market.
Growing Use in Medical Imaging and Healthcare
GPUs are used in medical imaging, genome sequencing, and drug discovery, accelerating research and improving patient care. The healthcare industry's increasing reliance on technology drives GPU growth. GPUs process and render high-resolution medical images, such as MRI, CT scans, and ultrasound images. These GPUs help improve the quality of images and enable real-time visualization for medical professionals. Advancements in GPU technology have facilitated 3D and 4D imaging, providing valuable insights for diagnosis and treatment planning. Machine learning and AI algorithms heavily rely on GPUs for training and inference tasks. AI assist in the automated analysis of medical images, helping clinicians detect anomalies and diseases more accurately and quickly. The growth of medical imaging and healthcare applications has significantly impacted the market.
Market Restraining Factors
Adverse Effects of Regulatory Challenges
Export controls and trade restrictions governments impose impact the market by limiting the availability of certain technologies or constraining market access. Governments in various countries impose export controls and trade restrictions on certain technologies, including GPUs. These regulations affect the export and import of GPUs, limiting market access in specific regions. GPU manufacturers must navigate complex export compliance laws that are subject to change. Intellectual property (IP) disputes and patent litigation are common in the technology industry, including the graphic processor market. These legal challenges lead to costly legal battles, restrictions on product sales, or the need to pay licensing fees. Therefore, like the broader technology industry, the graphic processor market faces various regulatory challenges that impact its operations and growth.
Development Outlook
On the basis of deployment, the market is divided into on-premise and cloud. The on-premise segment garnered a significant revenue share in the market in 2022. On-premise deployment enhances data security and privacy because data remains within the organization's network, reducing the risk of exposure to third-party cloud providers. On-premise GPUs deliver lower latency than cloud-based solutions because data processing occurs locally. On-premise solutions customized to integrate with existing infrastructure and applications, offering seamless compatibility.
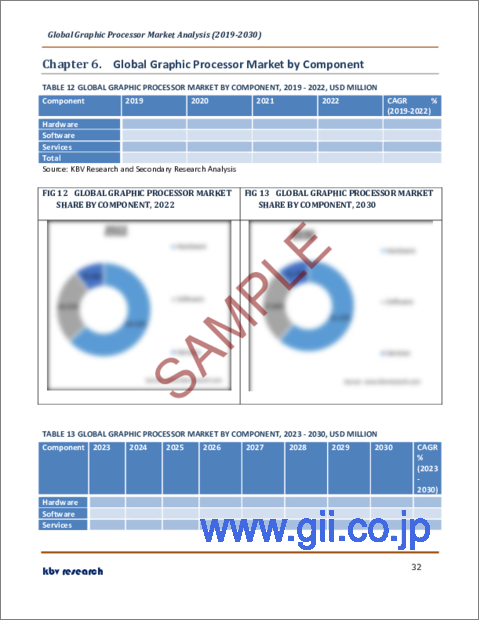
Component Outlook
By component, the market is categorized into hardware, software, and services. In 2022, the hardware segment held the highest revenue share in the market. The hardware segment consists of printed circuit boards (PCBs) that house and connect the GPUs, VRAM (video random access memory) modules for quick data storage, cooling techniques to ensure optimal performance under a variety of workloads, an interface, outputs, power connectors, and BIOS. Modern hardware advancements like ray tracing cores, tensor cores for AI acceleration, and specialized real-time ray tracing further widen the range of available hardware while providing improved visual quality and computational capabilities.
Application Outlook
By application, the market is segmented into consumer electronics, IT & telecommunication, healthcare, media & entertainment, and others. The IT and telecommunication segment recorded a remarkable revenue share in the market in 2022. The IT sector's demand for GPUs is driven by data center expansion and the need for high-performance computing. GPUs are used for AI inference, training, and data analytics in data centers. Telecommunication companies increasingly deploy GPUs in data centers to accelerate network functions, improve content delivery, and enhance security. AI and machine learning are integral to both IT and telecommunication operations. GPUs are crucial in accelerating AI workloads, making real-time decision-making and automation possible.
Type Outlook
Based on type, the market is classified into integrated, dedicated, and hybrid. In 2022, the integrated segment witnessed the largest revenue share in the market. A system's available RAM is utilized for operational duties by an integrated graphics card. The functionality of these cards takes precedence over the high graphic demands of entry-level laptops. In addition, incorporated cards result in a higher system memory utilization, which decreases system performance during resource-intensive activities such as gaming or image editing. These cards provide economic benefits by reducing costs, conserving energy, and minimizing noise emissions related to graphics solutions.
Regional Outlook
Region-wise, the market is analysed across North America, Europe, Asia Pacific, and LAMEA. In 2022, the North America region acquired a significant revenue share in the graphic processor market. The market for graphic processors in North America is primarily driven by the region's booming technology and entertainment sectors. The demand for cutting-edge GPUs that power complex visual effects, 3D modeling, and gaming experiences is consistently high due to the presence of major tech hubs and entertainment centers in places like Silicon Valley and Hollywood. The AI and machine learning revolution is another important driver, as GPUs are essential for boosting AI computations and fostering innovation in various industries, including finance and healthcare.
The market research report covers the analysis of key stake holders of the market. Key companies profiled in the report include NVIDIA Corporation, Advanced Micro Devices, Inc., Samsung Electronics Co., Ltd. (Samsung Group), Intel Corporation, Qualcomm Incorporated (Qualcomm Technologies, Inc.), Imagination Technologies Limited, Matrox Electronic Systems Ltd, IBM Corporation, Sony Corporation and VIA Technologies, Inc.
Recent Strategies Deployed in Graphic Processor Market
Product Launches and Product Expansions:
Jun-2023: Intel Corporation unveiled Intel® Arc™ Pro A60 and Pro A60M within its Intel® Arc™ Pro A-series field of graphics processing units (GPUs). Further, these recent products are a level up in performance in the Intel Arc Pro series providing up to 12GB of video memory (VRAM) and bearing up to four displays with high dynamic range (HDR) and Dolby Vision® support.
May-2023: Advanced Micro Devices, Inc. unveiled the AMD Ryzen and Athlon 7020 C-Series processors, based on 6nm technology. Further, It harnesses the power of AMD's Zen 2 architecture and integrated RDNA 2 graphics to deliver swift and responsive performance designed for contemporary productivity and multitasking tasks often found in educational and frontline work environments.
Apr-2023-: Advanced Micro Devices, Inc. introduced the Radeon PRO W7000 Series graphics card, based on the RDNA 3 architecture, and the Radeon PRO W7900 and Radeon PRO W7800 graphics cards from AMD are tailored for demanding workloads. Further, the Radeon PRO W7900 has 48 GB of GDDR6 memory, while the Radeon PRO W7800 features 32 GB of GDDR6 memory.
Apr-2023: Matrox Electronic Systems Ltd. introduced its latest Matrox LUMA lineup of graphics cards featuring Intel Arc GPUs. Further through this launch, the lineup comprises of three single-slot cards: the LUMA A310, a fanless low-profile card; the LUMA A310F, a low-profile card with a fan; and the LUMA A380, a full-sized card with a fan.
Nov-2022: Advanced Micro Devices, Inc. introduced the AMD Radeon™ RX 7900 XTX and Radeon RX 7900 XT graphics cards, based on AMD RDNA™ 3 architecture. Further, this AMD Radeon™ RX 7900 XTX and Radeon RX 7900 XT graphics cards are launched to offer high framerate 4K and higher resolution gaming.
Sep-2022: NVIDIA Corporation introduced GeForce RTX 40, Driven by the Latest NVIDIA Ada Lovelace and the advanced third generation RTX architecture for enhanced performance. Further, the GeForce RTX 40 Series graphics cards offer a twofold increase in performance for 3D rendering, video export speed, and AI tools.
Aug-2021: IBM Corporation introduced the IBM Telum Processor, Telum is set to serve as the core processor chip for the forthcoming IBM Z and LinuxONE systems of the next generation. The 7 nm microprocessor is designed to address our client's needs, enabling them to extract AI-driven insights from their data while maintaining rapid response times for high-volume transactional workloads. Further, IBM Telum incorporates a novel on-chip accelerator dedicated to AI inference, facilitating real-time AI integration directly into transactional workloads.
Apr-2021: NVIDIA Corporation introduced the NVIDIA Grace™ CPU to meet the computing needs of the most advanced applications globally, including natural language processing, recommender systems, and AI supercomputing. Further, it is NVIDIA Corporation's first-ever data center CPU, an Arm-based processor.
Acquisition and Mergers:
Jun-2023: NVIDIA Corporation completed the acquisition of OmniML, an open-source machine learning framework that automates key aspects of the machine learning pipeline. Through this acquisition, NVIDIA Corporation aims to enhance its distinct AI chips tailored for automotive, industrial robotics, and drone applications.
May-2022: Intel Corporation completed the acquisition of Siru Innovations, a technology company specializing in the development of innovative solutions. Through this acquisition, Intel Corporation would Integrate the Siru team into its emerging Accelerated Computing Systems and Graphics Group.
Feb-2022: Advanced Micro Devices, Inc. took over Xilinx, an American semiconductor company specializing in field-programmable gate arrays (FPGAs) and adaptive computing solutions. Through this acquisition, Xilinx would strengthen Advanced Micro Devices, Inc. suite by providing FPGAs, adaptive SoCs, AI engines and software expertise.
Jan-2021: Qualcomm Technologies, Inc. subsidiary of Qualcomm Incorporated completed the acquisition of NUVIA, a semiconductor design company specializing in high-performance processors and system-on-chip (SoC) solutions. Through this acquisition, Qualcomm Technologies, Inc. would strengthen its leadership in Snapdragon technology, ushering in significant advancements in CPU performance and power efficiency to address the requirements of future 5G computing.
Partnerships, Collaborations, and Agreements:
Aug-2023: Advanced Micro Devices, Inc. entered into a partnership with AV LINK GROUP LTD., a company specializing in audiovisual solutions, offering a wide range of products and services for the AV industry. Through this partnership, AV LINK GROUP LTD. and Advanced Micro Devices, Inc. would concentrate on the next-generation video processor market, with a particular focus on addressing critical applications like education, healthcare, corporate, and government sectors.
Jun-2023: Sony Corporation teamed up with Qualcomm Technologies, a leading American semiconductor and wireless technology company renowned for its contributions to mobile communications and semiconductor innovation. Through this Collaboration, both companies would prioritize delivering "improved user experiences" across premium, high-tier, and mid-tier smartphones.
May-2023: NVIDIA Corporation Teamed up with MediaTek Inc., a Taiwanese semiconductor company specializing in the design and manufacture of system-on-chip (SoC) solutions. Through this Collaboration, both companies intend to work together on technological solutions for enhancing vehicle infotainment systems, enabling video and game streaming, as well as facilitating driver interaction through artificial intelligence. Further, MediaTek plans to incorporate Nvidia's graphic processing unit chiplet and software into the system-on-chip offerings provided to automakers for their infotainment displays.
May-2023: Advanced Micro Devices, Inc. teamed up with Microsoft Corp, a multinational technology company renowned for its software products. Through this collaboration, Microsoft is providing financial backing to strengthen Advanced Micro Devices, Inc. initiatives, and the two firms are collaborating on the development of an in-house Microsoft AI processor, known as Project Athena.
Apr-2023: Intel Corporation entered into a partnership with Arm, a British semiconductor and software design company, known for its energy-efficient processor architectures. Through this partnership, both companies would focus on designing chipsets for mobile applications featuring Arm-based CPU cores, followed by expansion into automotive, IoT, data center, aerospace, and government sectors.
Scope of the Study
Market Segments covered in the Report:
By Deployment
- Cloud
- On-premise
By Component
- Hardware
- Software
- Services
By Application (Volume, Thousand Units, USD Million, 2019-2030)
- Consumer Electronics
- IT & Telecommunication
- Healthcare
- Media & Entertainment
By Type
- Integrated
- Dedicated
- Hybrid
By Geography
- North America
- US
- Canada
- Mexico
- Rest of North America
- Europe
- Germany
- UK
- France
- Russia
- Spain
- Italy
- Rest of Europe
- Asia Pacific
- China
- Japan
- India
- South Korea
- Singapore
- Malaysia
- Rest of Asia Pacific
- LAMEA
- Brazil
- Argentina
- UAE
- Saudi Arabia
- South Africa
- Nigeria
- Rest of LAMEA
Companies Profiled
- NVIDIA Corporation
- Advanced Micro Devices, Inc.
- Samsung Electronics Co., Ltd. (Samsung Group)
- Intel Corporation
- Qualcomm Incorporated (Qualcomm Technologies, Inc.)
- Imagination Technologies Limited
- Matrox Electronic Systems Ltd
- IBM Corporation
- Sony Corporation
- VIA Technologies, Inc
Unique Offerings from KBV Research
- Exhaustive coverage
- Highest number of market tables and figures
- Subscription based model available
- Guaranteed best price
- Assured post sales research support with 10% customization free
Table of Contents
Chapter 1.Market Scope & Methodology
- 1.1 Market Definition
- 1.2 Objectives
- 1.3 Market Scope
- 1.4 Segmentation
- 1.4.1 Global Graphic Processor Market, by Deployment
- 1.4.2 Global Graphic Processor Market, by Component
- 1.4.3 Global Graphic Processor Market, by Application
- 1.4.4 Global Graphic Processor Market, by Type
- 1.4.5 Global Graphic Processor Market, by Geography
- 1.5 Methodology for the research
Chapter 2. Market at a Glance
- 2.1 Key Highlights
Chapter 3. Market Overview
- 3.1 Introduction
- 3.1.1 Overview
- 3.1.1.1 Market Composition and Scenario
- 3.1.1 Overview
- 3.2 Key Factors Impacting the Market
- 3.2.1 Market Drivers
- 3.2.2 Market Restraints
Chapter 4. Competition Analysis - Global
- 4.1 KBV Cardinal Matrix
- 4.2 Recent Industry Wide Strategic Developments
- 4.2.1 Partnerships, Collaborations and Agreements
- 4.2.2 Product Launches and Product Expansions
- 4.2.3 Acquisition and Mergers
- 4.3 Market Share Analysis, 2022
- 4.4 Top Winning Strategies
- 4.4.1 Key Leading Strategies: Percentage Distribution (2019-2023)
- 4.4.2 Key Strategic Move: (Product Launches and Product Expansions: 2021, Apr - 2023, Jun) Leading Players
- 4.5 Porter's Five Forces Analysis
Chapter 5. Global Graphic Processor Market by Deployment
- 5.1 Global Cloud Market by Region
- 5.2 Global On-premise Market by Region
Chapter 6. Global Graphic Processor Market by Component
- 6.1 Global Hardware Market by Region
- 6.2 Global Software Market by Region
- 6.3 Global Services Market by Region
Chapter 7. Global Graphic Processor Market by Application
- 7.1 Global Consumer Electronics Market by Region
- 7.2 Global IT & Telecommunication Market by Region
- 7.3 Global Healthcare Market by Region
- 7.4 Global Media & Entertainment Market by Region
- 7.5 Global Others Market by Region
Chapter 8. Global Graphic Processor Market by Type
- 8.1 Global Integrated Market by Region
- 8.2 Global Dedicated Market by Region
- 8.3 Global Hybrid Market by Region
Chapter 9. Global Graphic Processor Market by Region
- 9.1 North America Graphic Processor Market
- 9.1.1 North America Graphic Processor Market by Deployment
- 9.1.1.1 North America Cloud Market by Region
- 9.1.1.2 North America On-premise Market by Region
- 9.1.2 North America Graphic Processor Market by Component
- 9.1.2.1 North America Hardware Market by Country
- 9.1.2.2 North America Software Market by Country
- 9.1.2.3 North America Services Market by Country
- 9.1.3 North America Graphic Processor Market by Application
- 9.1.3.1 North America Consumer Electronics Market by Country
- 9.1.3.2 North America IT & Telecommunication Market by Country
- 9.1.3.3 North America Healthcare Market by Country
- 9.1.3.4 North America Media & Entertainment Market by Country
- 9.1.3.5 North America Others Market by Country
- 9.1.4 North America Graphic Processor Market by Type
- 9.1.4.1 North America Integrated Market by Country
- 9.1.4.2 North America Dedicated Market by Country
- 9.1.4.3 North America Hybrid Market by Country
- 9.1.5 North America Graphic Processor Market by Country
- 9.1.5.1 US Graphic Processor Market
- 9.1.5.1.1 US Graphic Processor Market by Deployment
- 9.1.5.1.2 US Graphic Processor Market by Component
- 9.1.5.1.3 US Graphic Processor Market by Application
- 9.1.5.1.4 US Graphic Processor Market by Type
- 9.1.5.2 Canada Graphic Processor Market
- 9.1.5.2.1 Canada Graphic Processor Market by Deployment
- 9.1.5.2.2 Canada Graphic Processor Market by Component
- 9.1.5.2.3 Canada Graphic Processor Market by Application
- 9.1.5.2.4 Canada Graphic Processor Market by Type
- 9.1.5.3 Mexico Graphic Processor Market
- 9.1.5.3.1 Mexico Graphic Processor Market by Deployment
- 9.1.5.3.2 Mexico Graphic Processor Market by Component
- 9.1.5.3.3 Mexico Graphic Processor Market by Application
- 9.1.5.3.4 Mexico Graphic Processor Market by Type
- 9.1.5.4 Rest of North America Graphic Processor Market
- 9.1.5.4.1 Rest of North America Graphic Processor Market by Deployment
- 9.1.5.4.2 Rest of North America Graphic Processor Market by Component
- 9.1.5.4.3 Rest of North America Graphic Processor Market by Application
- 9.1.5.4.4 Rest of North America Graphic Processor Market by Type
- 9.1.5.1 US Graphic Processor Market
- 9.1.1 North America Graphic Processor Market by Deployment
- 9.2 Europe Graphic Processor Market
- 9.2.1 Europe Graphic Processor Market by Deployment
- 9.2.1.1 Europe Cloud Market by Country
- 9.2.1.2 Europe On-premise Market by Country
- 9.2.2 Europe Graphic Processor Market by Component
- 9.2.2.1 Europe Hardware Market by Country
- 9.2.2.2 Europe Software Market by Country
- 9.2.2.3 Europe Services Market by Country
- 9.2.3 Europe Graphic Processor Market by Application
- 9.2.3.1 Europe Consumer Electronics Market by Country
- 9.2.3.2 Europe IT & Telecommunication Market by Country
- 9.2.3.3 Europe Healthcare Market by Country
- 9.2.3.4 Europe Media & Entertainment Market by Country
- 9.2.3.5 Europe Others Market by Country
- 9.2.4 Europe Graphic Processor Market by Type
- 9.2.4.1 Europe Integrated Market by Country
- 9.2.4.2 Europe Dedicated Market by Country
- 9.2.4.3 Europe Hybrid Market by Country
- 9.2.5 Europe Graphic Processor Market by Country
- 9.2.5.1 Germany Graphic Processor Market
- 9.2.5.1.1 Germany Graphic Processor Market by Deployment
- 9.2.5.1.2 Germany Graphic Processor Market by Component
- 9.2.5.1.3 Germany Graphic Processor Market by Application
- 9.2.5.1.4 Germany Graphic Processor Market by Type
- 9.2.5.2 UK Graphic Processor Market
- 9.2.5.2.1 UK Graphic Processor Market by Deployment
- 9.2.5.2.2 UK Graphic Processor Market by Component
- 9.2.5.2.3 UK Graphic Processor Market by Application
- 9.2.5.2.4 UK Graphic Processor Market by Type
- 9.2.5.3 France Graphic Processor Market
- 9.2.5.3.1 France Graphic Processor Market by Deployment
- 9.2.5.3.2 France Graphic Processor Market by Component
- 9.2.5.3.3 France Graphic Processor Market by Application
- 9.2.5.3.4 France Graphic Processor Market by Type
- 9.2.5.4 Russia Graphic Processor Market
- 9.2.5.4.1 Russia Graphic Processor Market by Deployment
- 9.2.5.4.2 Russia Graphic Processor Market by Component
- 9.2.5.4.3 Russia Graphic Processor Market by Application
- 9.2.5.4.4 Russia Graphic Processor Market by Type
- 9.2.5.5 Spain Graphic Processor Market
- 9.2.5.5.1 Spain Graphic Processor Market by Deployment
- 9.2.5.5.2 Spain Graphic Processor Market by Component
- 9.2.5.5.3 Spain Graphic Processor Market by Application
- 9.2.5.5.4 Spain Graphic Processor Market by Type
- 9.2.5.6 Italy Graphic Processor Market
- 9.2.5.6.1 Italy Graphic Processor Market by Deployment
- 9.2.5.6.2 Italy Graphic Processor Market by Component
- 9.2.5.6.3 Italy Graphic Processor Market by Application
- 9.2.5.6.4 Italy Graphic Processor Market by Type
- 9.2.5.7 Rest of Europe Graphic Processor Market
- 9.2.5.7.1 Rest of Europe Graphic Processor Market by Deployment
- 9.2.5.7.2 Rest of Europe Graphic Processor Market by Component
- 9.2.5.7.3 Rest of Europe Graphic Processor Market by Application
- 9.2.5.7.4 Rest of Europe Graphic Processor Market by Type
- 9.2.5.1 Germany Graphic Processor Market
- 9.2.1 Europe Graphic Processor Market by Deployment
- 9.3 Asia Pacific Graphic Processor Market
- 9.3.1 Asia Pacific Graphic Processor Market by Deployment
- 9.3.1.1 Asia Pacific Cloud Market by Country
- 9.3.1.2 Asia Pacific On-premise Market by Country
- 9.3.2 Asia Pacific Graphic Processor Market by Component
- 9.3.2.1 Asia Pacific Hardware Market by Country
- 9.3.2.2 Asia Pacific Software Market by Country
- 9.3.2.3 Asia Pacific Services Market by Country
- 9.3.3 Asia Pacific Graphic Processor Market by Application
- 9.3.3.1 Asia Pacific Consumer Electronics Market by Country
- 9.3.3.2 Asia Pacific IT & Telecommunication Market by Country
- 9.3.3.3 Asia Pacific Healthcare Market by Country
- 9.3.3.4 Asia Pacific Media & Entertainment Market by Country
- 9.3.3.5 Asia Pacific Others Market by Country
- 9.3.4 Asia Pacific Graphic Processor Market by Type
- 9.3.4.1 Asia Pacific Integrated Market by Country
- 9.3.4.2 Asia Pacific Dedicated Market by Country
- 9.3.4.3 Asia Pacific Hybrid Market by Country
- 9.3.5 Asia Pacific Graphic Processor Market by Country
- 9.3.5.1 China Graphic Processor Market
- 9.3.5.1.1 China Graphic Processor Market by Deployment
- 9.3.5.1.2 China Graphic Processor Market by Component
- 9.3.5.1.3 China Graphic Processor Market by Application
- 9.3.5.1.4 China Graphic Processor Market by Type
- 9.3.5.2 Japan Graphic Processor Market
- 9.3.5.2.1 Japan Graphic Processor Market by Deployment
- 9.3.5.2.2 Japan Graphic Processor Market by Component
- 9.3.5.2.3 Japan Graphic Processor Market by Application
- 9.3.5.2.4 Japan Graphic Processor Market by Type
- 9.3.5.3 India Graphic Processor Market
- 9.3.5.3.1 India Graphic Processor Market by Deployment
- 9.3.5.3.2 India Graphic Processor Market by Component
- 9.3.5.3.3 India Graphic Processor Market by Application
- 9.3.5.3.4 India Graphic Processor Market by Type
- 9.3.5.4 South Korea Graphic Processor Market
- 9.3.5.4.1 South Korea Graphic Processor Market by Deployment
- 9.3.5.4.2 South Korea Graphic Processor Market by Component
- 9.3.5.4.3 South Korea Graphic Processor Market by Application
- 9.3.5.4.4 South Korea Graphic Processor Market by Type
- 9.3.5.5 Singapore Graphic Processor Market
- 9.3.5.5.1 Singapore Graphic Processor Market by Deployment
- 9.3.5.5.2 Singapore Graphic Processor Market by Component
- 9.3.5.5.3 Singapore Graphic Processor Market by Application
- 9.3.5.5.4 Singapore Graphic Processor Market by Type
- 9.3.5.6 Malaysia Graphic Processor Market
- 9.3.5.6.1 Malaysia Graphic Processor Market by Deployment
- 9.3.5.6.2 Malaysia Graphic Processor Market by Component
- 9.3.5.6.3 Malaysia Graphic Processor Market by Application
- 9.3.5.6.4 Malaysia Graphic Processor Market by Type
- 9.3.5.7 Rest of Asia Pacific Graphic Processor Market
- 9.3.5.7.1 Rest of Asia Pacific Graphic Processor Market by Deployment
- 9.3.5.7.2 Rest of Asia Pacific Graphic Processor Market by Component
- 9.3.5.7.3 Rest of Asia Pacific Graphic Processor Market by Application
- 9.3.5.7.4 Rest of Asia Pacific Graphic Processor Market by Type
- 9.3.5.1 China Graphic Processor Market
- 9.3.1 Asia Pacific Graphic Processor Market by Deployment
- 9.4 LAMEA Graphic Processor Market
- 9.4.1 LAMEA Graphic Processor Market by Deployment
- 9.4.1.1 LAMEA Cloud Market by Country
- 9.4.1.2 LAMEA On-premise Market by Country
- 9.4.2 LAMEA Graphic Processor Market by Component
- 9.4.2.1 LAMEA Hardware Market by Country
- 9.4.2.2 LAMEA Software Market by Country
- 9.4.2.3 LAMEA Services Market by Country
- 9.4.3 LAMEA Graphic Processor Market by Application
- 9.4.3.1 LAMEA Consumer Electronics Market by Country
- 9.4.3.2 LAMEA IT & Telecommunication Market by Country
- 9.4.3.3 LAMEA Healthcare Market by Country
- 9.4.3.4 LAMEA Media & Entertainment Market by Country
- 9.4.3.5 LAMEA Others Market by Country
- 9.4.4 LAMEA Graphic Processor Market by Type
- 9.4.4.1 LAMEA Integrated Market by Country
- 9.4.4.2 LAMEA Dedicated Market by Country
- 9.4.4.3 LAMEA Hybrid Market by Country
- 9.4.5 LAMEA Graphic Processor Market by Country
- 9.4.5.1 Brazil Graphic Processor Market
- 9.4.5.1.1 Brazil Graphic Processor Market by Deployment
- 9.4.5.1.2 Brazil Graphic Processor Market by Component
- 9.4.5.1.3 Brazil Graphic Processor Market by Application
- 9.4.5.1.4 Brazil Graphic Processor Market by Type
- 9.4.5.2 Argentina Graphic Processor Market
- 9.4.5.2.1 Argentina Graphic Processor Market by Deployment
- 9.4.5.2.2 Argentina Graphic Processor Market by Component
- 9.4.5.2.3 Argentina Graphic Processor Market by Application
- 9.4.5.2.4 Argentina Graphic Processor Market by Type
- 9.4.5.3 UAE Graphic Processor Market
- 9.4.5.3.1 UAE Graphic Processor Market by Deployment
- 9.4.5.3.2 UAE Graphic Processor Market by Component
- 9.4.5.3.3 UAE Graphic Processor Market by Application
- 9.4.5.3.4 UAE Graphic Processor Market by Type
- 9.4.5.4 Saudi Arabia Graphic Processor Market
- 9.4.5.4.1 Saudi Arabia Graphic Processor Market by Deployment
- 9.4.5.4.2 Saudi Arabia Graphic Processor Market by Component
- 9.4.5.4.3 Saudi Arabia Graphic Processor Market by Application
- 9.4.5.4.4 Saudi Arabia Graphic Processor Market by Type
- 9.4.5.5 South Africa Graphic Processor Market
- 9.4.5.5.1 South Africa Graphic Processor Market by Deployment
- 9.4.5.5.2 South Africa Graphic Processor Market by Component
- 9.4.5.5.3 South Africa Graphic Processor Market by Application
- 9.4.5.5.4 South Africa Graphic Processor Market by Type
- 9.4.5.6 Nigeria Graphic Processor Market
- 9.4.5.6.1 Nigeria Graphic Processor Market by Deployment
- 9.4.5.6.2 Nigeria Graphic Processor Market by Component
- 9.4.5.6.3 Nigeria Graphic Processor Market by Application
- 9.4.5.6.4 Nigeria Graphic Processor Market by Type
- 9.4.5.7 Rest of LAMEA Graphic Processor Market
- 9.4.5.7.1 Rest of LAMEA Graphic Processor Market by Deployment
- 9.4.5.7.2 Rest of LAMEA Graphic Processor Market by Component
- 9.4.5.7.3 Rest of LAMEA Graphic Processor Market by Application
- 9.4.5.7.4 Rest of LAMEA Graphic Processor Market by Type
- 9.4.5.1 Brazil Graphic Processor Market
- 9.4.1 LAMEA Graphic Processor Market by Deployment
Chapter 10. Company Profiles
- 10.1 NVIDIA Corporation
- 10.1.1 Company Overview
- 10.1.2 Financial Analysis
- 10.1.3 Segmental and Regional Analysis
- 10.1.4 Research & Development Expenses
- 10.1.5 Recent strategies and developments:
- 10.1.5.1 Partnerships, Collaborations, and Agreements:
- 10.1.5.2 Product Launches and Product Expansions:
- 10.1.5.3 Acquisition and Mergers:
- 10.1.6 SWOT Analysis
- 10.2 Advanced Micro Devices, Inc.
- 10.2.1 Company Overview
- 10.2.2 Financial Analysis
- 10.2.3 Segmental and Regional Analysis
- 10.2.4 Research & Development Expenses
- 10.2.5 Recent strategies and developments:
- 10.2.5.1 Partnerships, Collaborations, and Agreements:
- 10.2.5.2 Product Launches and Product Expansions:
- 10.2.5.3 Acquisition and Mergers:
- 10.2.6 SWOT Analysis
- 10.3 Samsung Electronics Co., Ltd. (Samsung Group)
- 10.3.1 Company Overview
- 10.3.2 Financial Analysis
- 10.3.3 Segmental and Regional Analysis
- 10.3.4 Recent strategies and developments:
- 10.3.4.1 Partnerships, Collaborations, and Agreements:
- 10.3.5 SWOT Analysis
- 10.4 Intel Corporation
- 10.4.1 Company Overview
- 10.4.2 Financial Analysis
- 10.4.3 Segmental and Regional Analysis
- 10.4.4 Research & Development Expenses
- 10.4.5 Recent strategies and developments:
- 10.4.5.1 Partnerships, Collaborations, and Agreements:
- 10.4.5.2 Product Launches and Product Expansions:
- 10.4.5.3 Acquisition and Mergers:
- 10.4.6 SWOT Analysis
- 10.5 Qualcomm Incorporated (Qualcomm Technologies, Inc.)
- 10.5.1 Company Overview
- 10.5.2 Financial Analysis
- 10.5.3 Segmental and Regional Analysis
- 10.5.4 Research & Development Expense
- 10.5.5 Recent strategies and developments:
- 10.5.5.1 Acquisition and Mergers:
- 10.5.6 SWOT Analysis
- 10.6 Imagination Technologies Limited
- 10.6.1 Company Overview
- 10.6.2 Financial Analysis
- 10.6.3 Regional Analysis
- 10.6.4 Research & Development Expenses
- 10.6.5 SWOT Analysis
- 10.7 Matrox Electronic Systems Ltd.
- 10.7.1 Company Overview
- 10.7.2 Recent strategies and developments:
- 10.7.2.1 Product Launches and Product Expansions:
- 10.7.3 SWOT Analysis
- 10.8 IBM Corporation
- 10.8.1 Company Overview
- 10.8.2 Financial Analysis
- 10.8.3 Segmental and Regional Analysis
- 10.8.4 Research & Development Expenses
- 10.8.5 Recent strategies and developments:
- 10.8.5.1 Product Launches and Product Expansions:
- 10.8.6 SWOT Analysis
- 10.9 Sony Corporation
- 10.9.1 Company Overview
- 10.9.2 Financial Analysis
- 10.9.3 Segmental and Regional Analysis
- 10.9.4 Research & Development Expenses
- 10.9.5 Recent strategies and developments:
- 10.9.5.1 Partnerships, Collaborations, and Agreements:
- 10.9.6 SWOT Analysis
- 10.10. VIA Technologies, Inc.
- 10.10.1 Company Overview
- 10.10.2 Financial Analysis
- 10.10.3 Research & Development Expenses
- 10.10.4 SWOT Analysis
Chapter 11. Winning Imperatives of Graphic Processor Market
