|
|
市場調査レポート
商品コード
1276363
インサイトエンジンの世界市場規模、シェア、産業動向分析レポート:技術別、アプリケーション別、コンポーネント別(ソリューション、サービス)、展開タイプ別、組織規模別、業種別、地域別展望と予測、2023~2029年Global Insight Engines Market Size, Share & Industry Trends Analysis Report By Technology, By Application, By Component (Solution and Services), By Deployment Type, By Organization Size, By Vertical, By Regional Outlook and Forecast, 2023 - 2029 |
||||||
|
|
|||||||


| インサイトエンジンの世界市場規模、シェア、産業動向分析レポート:技術別、アプリケーション別、コンポーネント別(ソリューション、サービス)、展開タイプ別、組織規模別、業種別、地域別展望と予測、2023~2029年 |
|
出版日: 2023年04月28日
発行: KBV Research
ページ情報: 英文 377 Pages
納期: 即納可能
|
- 全表示
- 概要
- 図表
- 目次
インサイトエンジン市場規模は、2029年までに66億米ドルに達すると予測され、予測期間中のCAGRは25.4%の市場成長率で上昇すると予想されています。
インサイトエンジンとは、適切な技術を使ってデータを構成、評価、整理し、最終的に特定の順序で並べるものです。これにより、特定の商取引の場面で、デジタル従業員、最終消費者、利害関係者の文脈で、現在のデータまたは合成されたデータを、積極的または高度に対話的な方法で転送することが可能になります。
データや情報が構造化されているか非構造化されているかは、価値あるインサイトを生み出すために使用されるデータや情報の品質と価値に大きな影響を与え、インサイトエンジン市場の開拓を促進すると予測されます。構造化データは、明確に定義されたデータタイプで構成され、検索可能なフィールドに整理または配置され、そのパターンは容易に照会することができます。
COVID-19の影響分析
COVID-19では、インサイトエンジンはエンタープライズサーチの知識発見の選択肢の1つとして勢いを増しました。市場では、エンタープライズアプリケーションで生成されるデータが大幅に増加しました。その結果、ビジネスの意思決定のために意味のあるインサイトを開発するために費やす時間が大幅に増加しました。パンデミック時にインサイトエンジンを宣伝するために、市場の主要ベンダーは、業界固有の検索機能やパンデミック後の検索機能を備えた最先端の製品を発表し、パンデミック時の市場の成長をさらに後押ししました。
市場成長要因
BFSI業界におけるインサイトエンジンの利用拡大
ソーシャルメディアをスキャンし、自然言語処理を用いて自社のサービスや戦略に関する会話を分析することで、銀行やその他の金融機関もインサイトエンジンを使用して顧客の感情を特定し解析しています。重要なデータや分離されたデータにアクセスできるため、金融サービスのアナリストはより正確なレポートを作成し、顧客や社内の意思決定者により良いガイダンスを提供することができます。データによって銀行サービスをパーソナライズすることで、顧客エンゲージメントを高め、収益を向上させることができます。このように、インサイトエンジンへのBFSIセクターの依存度が高まっていることから、同セクターの増加とともに、インサイトエンジン市場の成長も促進されると期待されています。
検索エンジンが文脈や複雑なクエリを理解するようになっている
専門家に相談して解決策を見出したり、斬新なアイデアを評価したり、コンプライアンスを迅速化したり、顧客サービスを強化することで、企業はこの検索機能から利益を得ることができます。インサイトエンジンは、企業の多くの部門、ユニット、部署で利用されています。インサイトエンジンは、企業の多くの部門、ユニット、部署で利用されており、ユーザーが障害を克服するためのサポートネットワーク、ユーザーの要求に応じたデータの準備と提示、多くの部門、作業員、アプリケーションの要求を満たすことができるかもしれません。このように、エンジンは文脈や複雑なクエリを理解する能力を高めており、予測される期間中に市場は成長すると予想されます。
市場抑制要因
データ品質とソース検証の問題
ソース検証の不備やデータ品質の低下は、データセキュリティ違反による多額の罰金や、顧客、市場シェア、収益の喪失につながる可能性があります。データソースの検証機能、データ品質の向上、高度に保護されたアクセス制御の要件は、すべて組織の法律や規制に従って設定する必要があり、インサイトエンジンを使用するための前提条件となります。データサイロは、非構造化データと構造化データの使用や、データスチュワード、カストディアン、セキュリティチームなど、多数の利害関係者の関与によって生じます。その結果、データアドレスの品質と検証に関する問題が、インサイトエンジンの市場拡大を大きく制限する可能性があります。
コンポーネントの展望
インサイトエンジン市場は、コンポーネントに基づき、ソリューションとサービスに区分されます。ソリューションセグメントは、2022年にインサイトエンジン市場を独占し、最大の収益シェアを獲得しました。これは、これらのソリューションが、ROI分析レポートを含む包括的なパフォーマンス指標を提供するためです。その主な目的は、ウェブサイトやアプリケーションに対する顧客のインタラクションに関する情報を提供し、効果的なコンテンツを特定することです。プラットフォームの集中型インターフェースは、よりシンプルな概要とレポートを提供します。CRMやPOSシステムなどの他のアプリケーションと統合し、包括的な消費者行動の概要を提供します。
アプリケーションの展望
インサイトエンジン市場は、アプリケーション別に、検索・ディスカバリー、顧客管理、ナレッジマネジメント、リスク・コンプライアンス管理、その他のアプリケーションに分類されます。2022年のインサイトエンジン市場では、検索・ディスカバリー分野がかなりの収益シェアを確保しました。これは、ユーザーがデータ駆動型の意思決定を行うために必要な事実を探し出し、理解し、確信することを可能にするその機能によるものです。現代の数多くのビジネスは、データを利用して知的でタイムリーな意思決定を行う能力に基づいています。しかし、従来のエンタープライズサーチは、現代のナレッジワーカーのニーズを満たすことができないことが証明されています。
技術の展望
インサイトエンジン市場は、技術別に自然言語処理と機械学習に分類されます。2022年のインサイトエンジン市場では、機械学習分野が最大の収益シェアを占めています。これは、機械学習アルゴリズムを使用してデータを分析し、動向を特定し、予測を行い、推奨事項を提案することができるためです。また、協調フィルタリング、クラスタリング、類似度計算などの機械学習アルゴリズムを使用することで、インサイトエンジンは検索結果の関連性を判断し、検索クエリにマッチさせることができ、これがこのセグメントの拡大をさらに後押ししています。
展開タイプの展望
インサイトエンジン市場は、展開タイプによってクラウドとオンプレミスに二分されます。2022年のインサイトエンジン市場では、オンプレミスが突出した収益シェアを獲得しています。これは、オンプレミスの展開では、ソリューションが企業のサーバーにセットアップされ、ファイアウォールで保護されるという事実によるものです。オンプレミスソフトウェアを使用するには、企業はライセンスまたはアプリケーションのコピーを購入する必要があります。ソフトウェアはライセンスされ、完全なインスタンスは企業のオンサイトに保管されるため、クラウドコンピューティングインフラよりもセキュリティが強固であることが多いです。
組織規模の展望
インサイトエンジン市場は、組織規模によって大企業と中小企業に分類されます。大企業セグメントは、2022年に最大の収益シェアを獲得してインサイトエンジン市場を独占しました。この成長は、大企業がインサイトエンジンのユーザーの大半を占めていることに起因しています。ほとんどの企業はデータに溺れながらも、インサイトを渇望しています。デジタルパワーの取り組みのためにデータを見つけ、分析するために、機械学習とAIを混合したインサイトエンジンは、驚異的な発展を遂げています。これらの企業は、これらの処理に投資するための相当なリソースを持っています。
業種の展望
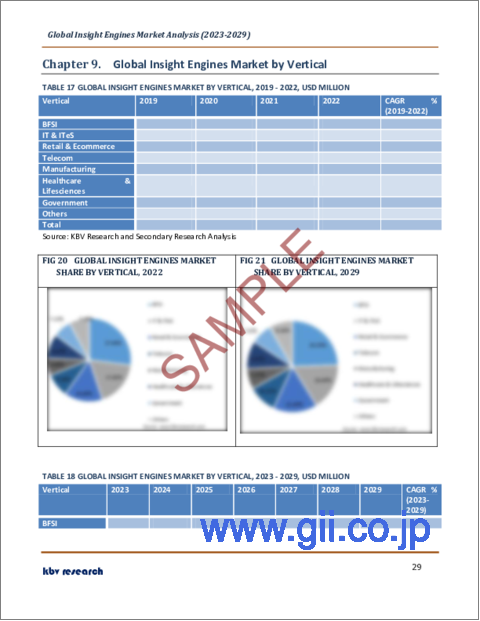
インサイトエンジン市場は、業種別では、銀行・金融サービス・保険、IT・ITeS、小売・eコマース、ヘルスケア・ライフサイエンス、テレコム、製造、政府、その他に分類されます。2022年のインサイトエンジン市場では、IT・ITeS分野が大きな収益シェアを記録しました。これは、IT・ITeSビジネスでインサイトエンジンを構築することで、組織から効率化まで、いくつかのメリットがあるためです。インサイトエンジンを導入することで、プロジェクトの成功確率は大幅に高まります。また、インサイトエンジンを導入すると、過去のデータにアクセスしやすくなり、望ましい結果を得るために取るべき手順がより明確になるため、企業内のチームがより効率的に活動できるようになることが多いです。
地域別展望
インサイトエンジン市場は、北米、欧州、アジア太平洋、LAMEAの4地域で分析されています。北米地域は、2022年のインサイトエンジン市場で最大の収益シェアを示しました。これは、北米地域でチャットボット、音声認識、自然言語処理などの最先端技術の採用が最も多いためです。この地域のインサイトエンジン市場は、多くの原因によって拡大しています。IoTの発展、ビッグデータの急激な増加、クラウドベースのプラットフォームの所有コストの低下などです。
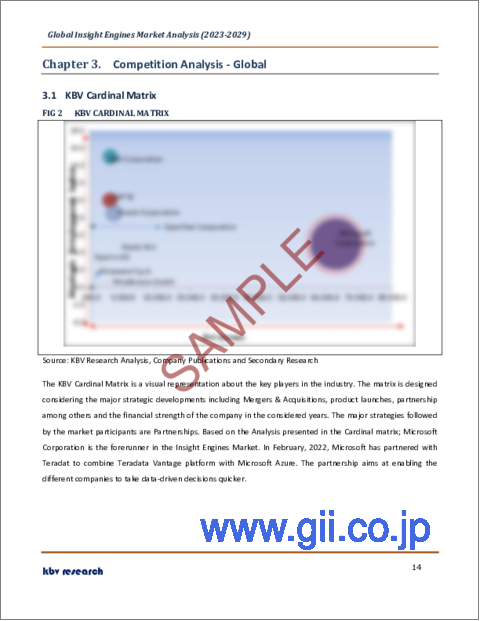
市場参入企業がとる主な戦略は、パートナーシップです。カーディナルマトリックスで示された分析に基づくと、マイクロソフト株式会社がインサイトエンジン市場の先駆者です。IBM Corporation、SAP SE、Oracle Corporationなどの企業は、Insight Engines市場における主要な革新的企業の一部です。
目次
第1章 市場範囲と調査手法
- 市場の定義
- 目的
- 市場範囲
- セグメンテーション
- 世界のインサイトエンジン市場:技術別
- 世界のインサイトエンジン市場:用途別
- 世界のインサイトエンジン市場:コンポーネント別
- 世界のインサイトエンジン市場:展開タイプ別
- 世界のインサイトエンジン市場:組織規模別
- 世界のインサイトエンジン市場:業種別
- 世界のインサイトエンジン市場:地域別
- 調査手法
第2章 市場概要
- イントロダクション
- 概要
- 市場構成とシナリオ
- 概要
- 市場に影響を与える主な要因
- 市場促進要因
- 市場抑制要因
第3章 競合分析- 世界
- KBVカーディナルマトリックス
- 最近の業界全体の戦略的展開
- パートナーシップ、コラボレーション、および契約
- 製品の発売と製品の拡大
- 買収と合併
- 地理的拡大
- 主要成功戦略
- 主要なリーディングストラテジー
- 主要な戦略的動き
第4章 世界のインサイトエンジン市場:技術別
- 世界の機械学習市場:地域別
- 世界の自然言語処理市場:地域別
第5章 世界のインサイトエンジン市場:アプリケーション別
- 世界の顧客管理市場:地域別
- 世界の検索・ディスカバリー市場:地域別
- 世界のナレッジマネジメント市場:地域別
- 世界のリスク・コンプライアンス管理市場:地域別
- 世界のその他のアプリケーション市場:地域別
第6章 世界のインサイトエンジン市場:コンポーネント別
- 世界のソリューション市場:地域別
- 世界のサービス市場:地域別
第7章 世界のインサイトエンジン市場:展開タイプ別
- 世界のクラウド市場:地域別
- 世界のオンプレミス市場:地域別
第8章 世界のインサイトエンジン市場:組織規模別
- 世界の大企業市場:地域別
- 世界の中小企業市場:地域別
第9章 世界のインサイトエンジン市場:業種別
- 世界のBFSI市場:地域別
- 世界のIT・ITeS市場:地域別
- 世界の小売・eコマース市場:地域別
- 世界の通信市場:地域別
- 世界の製造市場:地域別
- 世界のヘルスケア・ライフサイエンス市場:地域別
- 世界の政府市場:地域別
- 世界のその他の市場:地域別
第10章 世界のインサイトエンジン市場:地域別
- 北米
- 北米の市場:国別
- 米国
- カナダ
- メキシコ
- その他北米地域
- 北米の市場:国別
- 欧州
- 欧州の市場:国別
- ドイツ
- 英国
- フランス
- ロシア
- スペイン
- イタリア
- その他欧州地域
- 欧州の市場:国別
- アジア太平洋
- アジア太平洋の市場:国別
- 中国
- 日本
- インド
- 韓国
- シンガポール
- マレーシア
- その他アジア太平洋地域
- アジア太平洋の市場:国別
- ラテンアメリカ・中東・アフリカ
- ラテンアメリカ・中東・アフリカの市場:国別
- ブラジル
- アルゼンチン
- アラブ首長国連邦
- サウジアラビア
- 南アフリカ
- ナイジェリア
- その他ラテンアメリカ・中東・アフリカ地域
- ラテンアメリカ・中東・アフリカの市場:国別
第11章 企業プロファイル
- IBM Corporation
- Oracle Corporation
- SAP SE
- Microsoft Corporation
- OpenText Corporation
- Elastic NV
- expertai S.p.A
- Almawave Sp.A.(Almaviva S.p.A)
- Mindbreeze GmbH(Fabasoft AG)
- Squirro AG
LIST OF TABLES
- TABLE 1 Global Insight Engines Market, 2019 - 2022, USD Million
- TABLE 2 Global Insight Engines Market, 2023 - 2029, USD Million
- TABLE 3 Partnerships, Collaborations and Agreements- Insight Engines Market
- TABLE 4 Product Launches And Product Expansions- Insight Engines Market
- TABLE 5 Acquisition and Mergers- Insight Engines Market
- TABLE 6 geographical expansions - Insight Engines Market
- TABLE 7 Global Insight Engines Market by Technology, 2019 - 2022, USD Million
- TABLE 8 Global Insight Engines Market by Technology, 2023 - 2029, USD Million
- TABLE 9 Global Machine Learning Market by Region, 2019 - 2022, USD Million
- TABLE 10 Global Machine Learning Market by Region, 2023 - 2029, USD Million
- TABLE 11 Global Nature Language Processing Market by Region, 2019 - 2022, USD Million
- TABLE 12 Global Nature Language Processing Market by Region, 2023 - 2029, USD Million
- TABLE 13 Global Insight Engines Market by Application, 2019 - 2022, USD Million
- TABLE 14 Global Insight Engines Market by Application, 2023 - 2029, USD Million
- TABLE 15 Global Customer Management Market by Region, 2019 - 2022, USD Million
- TABLE 16 Global Customer Management Market by Region, 2023 - 2029, USD Million
- TABLE 17 Global Search & Discovery Market by Region, 2019 - 2022, USD Million
- TABLE 18 Global Search & Discovery Market by Region, 2023 - 2029, USD Million
- TABLE 19 Global Knowledge Management Market by Region, 2019 - 2022, USD Million
- TABLE 20 Global Knowledge Management Market by Region, 2023 - 2029, USD Million
- TABLE 21 Global Risk & Compliance Management Market by Region, 2019 - 2022, USD Million
- TABLE 22 Global Risk & Compliance Management Market by Region, 2023 - 2029, USD Million
- TABLE 23 Global Other Application Market by Region, 2019 - 2022, USD Million
- TABLE 24 Global Other Application Market by Region, 2023 - 2029, USD Million
- TABLE 25 Global Insight Engines Market by Component, 2019 - 2022, USD Million
- TABLE 26 Global Insight Engines Market by Component, 2023 - 2029, USD Million
- TABLE 27 Global Solution Market by Region, 2019 - 2022, USD Million
- TABLE 28 Global Solution Market by Region, 2023 - 2029, USD Million
- TABLE 29 Global Services Market by Region, 2019 - 2022, USD Million
- TABLE 30 Global Services Market by Region, 2023 - 2029, USD Million
- TABLE 31 Global Insight Engines Market by Deployment Type, 2019 - 2022, USD Million
- TABLE 32 Global Insight Engines Market by Deployment Type, 2023 - 2029, USD Million
- TABLE 33 Global Cloud Market by Region, 2019 - 2022, USD Million
- TABLE 34 Global Cloud Market by Region, 2023 - 2029, USD Million
- TABLE 35 Global On-premise Market by Region, 2019 - 2022, USD Million
- TABLE 36 Global On-premise Market by Region, 2023 - 2029, USD Million
- TABLE 37 Global Insight Engines Market by Organization Size, 2019 - 2022, USD Million
- TABLE 38 Global Insight Engines Market by Organization Size, 2023 - 2029, USD Million
- TABLE 39 Global Large Enterprises Market by Region, 2019 - 2022, USD Million
- TABLE 40 Global Large Enterprises Market by Region, 2023 - 2029, USD Million
- TABLE 41 Global Small & Medium Enterprises Market by Region, 2019 - 2022, USD Million
- TABLE 42 Global Small & Medium Enterprises Market by Region, 2023 - 2029, USD Million
- TABLE 43 Global Insight Engines Market by Vertical, 2019 - 2022, USD Million
- TABLE 44 Global Insight Engines Market by Vertical, 2023 - 2029, USD Million
- TABLE 45 Global BFSI Market by Region, 2019 - 2022, USD Million
- TABLE 46 Global BFSI Market by Region, 2023 - 2029, USD Million
- TABLE 47 Global IT & ITeS Market by Region, 2019 - 2022, USD Million
- TABLE 48 Global IT & ITeS Market by Region, 2023 - 2029, USD Million
- TABLE 49 Global Retail & Ecommerce Market by Region, 2019 - 2022, USD Million
- TABLE 50 Global Retail & Ecommerce Market by Region, 2023 - 2029, USD Million
- TABLE 51 Global Telecom Market by Region, 2019 - 2022, USD Million
- TABLE 52 Global Telecom Market by Region, 2023 - 2029, USD Million
- TABLE 53 Global Manufacturing Market by Region, 2019 - 2022, USD Million
- TABLE 54 Global Manufacturing Market by Region, 2023 - 2029, USD Million
- TABLE 55 Global Healthcare & Lifesciences Market by Region, 2019 - 2022, USD Million
- TABLE 56 Global Healthcare & Lifesciences Market by Region, 2023 - 2029, USD Million
- TABLE 57 Global Government Market by Region, 2019 - 2022, USD Million
- TABLE 58 Global Government Market by Region, 2023 - 2029, USD Million
- TABLE 59 Global Others Market by Region, 2019 - 2022, USD Million
- TABLE 60 Global Others Market by Region, 2023 - 2029, USD Million
- TABLE 61 Global Insight Engines Market by Region, 2019 - 2022, USD Million
- TABLE 62 Global Insight Engines Market by Region, 2023 - 2029, USD Million
- TABLE 63 North America Insight Engines Market, 2019 - 2022, USD Million
- TABLE 64 North America Insight Engines Market, 2023 - 2029, USD Million
- TABLE 65 North America Insight Engines Market by Technology, 2019 - 2022, USD Million
- TABLE 66 North America Insight Engines Market by Technology, 2023 - 2029, USD Million
- TABLE 67 North America Machine Learning Market by Country, 2019 - 2022, USD Million
- TABLE 68 North America Machine Learning Market by Country, 2023 - 2029, USD Million
- TABLE 69 North America Nature Language Processing Market by Country, 2019 - 2022, USD Million
- TABLE 70 North America Nature Language Processing Market by Country, 2023 - 2029, USD Million
- TABLE 71 North America Insight Engines Market by Application, 2019 - 2022, USD Million
- TABLE 72 North America Insight Engines Market by Application, 2023 - 2029, USD Million
- TABLE 73 North America Customer Management Market by Country, 2019 - 2022, USD Million
- TABLE 74 North America Customer Management Market by Country, 2023 - 2029, USD Million
- TABLE 75 North America Search & Discovery Market by Country, 2019 - 2022, USD Million
- TABLE 76 North America Search & Discovery Market by Country, 2023 - 2029, USD Million
- TABLE 77 North America Knowledge Management Market by Country, 2019 - 2022, USD Million
- TABLE 78 North America Knowledge Management Market by Country, 2023 - 2029, USD Million
- TABLE 79 North America Risk & Compliance Management Market by Country, 2019 - 2022, USD Million
- TABLE 80 North America Risk & Compliance Management Market by Country, 2023 - 2029, USD Million
- TABLE 81 North America Other Application Market by Country, 2019 - 2022, USD Million
- TABLE 82 North America Other Application Market by Country, 2023 - 2029, USD Million
- TABLE 83 North America Insight Engines Market by Component, 2019 - 2022, USD Million
- TABLE 84 North America Insight Engines Market by Component, 2023 - 2029, USD Million
- TABLE 85 North America Solution Market by Country, 2019 - 2022, USD Million
- TABLE 86 North America Solution Market by Country, 2023 - 2029, USD Million
- TABLE 87 North America Services Market by Country, 2019 - 2022, USD Million
- TABLE 88 North America Services Market by Country, 2023 - 2029, USD Million
- TABLE 89 North America Insight Engines Market by Deployment Type, 2019 - 2022, USD Million
- TABLE 90 North America Insight Engines Market by Deployment Type, 2023 - 2029, USD Million
- TABLE 91 North America Cloud Market by Country, 2019 - 2022, USD Million
- TABLE 92 North America Cloud Market by Country, 2023 - 2029, USD Million
- TABLE 93 North America On-premise Market by Country, 2019 - 2022, USD Million
- TABLE 94 North America On-premise Market by Country, 2023 - 2029, USD Million
- TABLE 95 North America Insight Engines Market by Organization Size, 2019 - 2022, USD Million
- TABLE 96 North America Insight Engines Market by Organization Size, 2023 - 2029, USD Million
- TABLE 97 North America Large Enterprises Market by Country, 2019 - 2022, USD Million
- TABLE 98 North America Large Enterprises Market by Country, 2023 - 2029, USD Million
- TABLE 99 North America Small & Medium Enterprises Market by Country, 2019 - 2022, USD Million
- TABLE 100 North America Small & Medium Enterprises Market by Country, 2023 - 2029, USD Million
- TABLE 101 North America Insight Engines Market by Vertical, 2019 - 2022, USD Million
- TABLE 102 North America Insight Engines Market by Vertical, 2023 - 2029, USD Million
- TABLE 103 North America BFSI Market by Country, 2019 - 2022, USD Million
- TABLE 104 North America BFSI Market by Country, 2023 - 2029, USD Million
- TABLE 105 North America IT & ITeS Market by Country, 2019 - 2022, USD Million
- TABLE 106 North America IT & ITeS Market by Country, 2023 - 2029, USD Million
- TABLE 107 North America Retail & Ecommerce Market by Country, 2019 - 2022, USD Million
- TABLE 108 North America Retail & Ecommerce Market by Country, 2023 - 2029, USD Million
- TABLE 109 North America Telecom Market by Country, 2019 - 2022, USD Million
- TABLE 110 North America Telecom Market by Country, 2023 - 2029, USD Million
- TABLE 111 North America Manufacturing Market by Country, 2019 - 2022, USD Million
- TABLE 112 North America Manufacturing Market by Country, 2023 - 2029, USD Million
- TABLE 113 North America Healthcare & Lifesciences Market by Country, 2019 - 2022, USD Million
- TABLE 114 North America Healthcare & Lifesciences Market by Country, 2023 - 2029, USD Million
- TABLE 115 North America Government Market by Country, 2019 - 2022, USD Million
- TABLE 116 North America Government Market by Country, 2023 - 2029, USD Million
- TABLE 117 North America Others Market by Country, 2019 - 2022, USD Million
- TABLE 118 North America Others Market by Country, 2023 - 2029, USD Million
- TABLE 119 North America Insight Engines Market by Country, 2019 - 2022, USD Million
- TABLE 120 North America Insight Engines Market by Country, 2023 - 2029, USD Million
- TABLE 121 US Insight Engines Market, 2019 - 2022, USD Million
- TABLE 122 US Insight Engines Market, 2023 - 2029, USD Million
- TABLE 123 US Insight Engines Market by Technology, 2019 - 2022, USD Million
- TABLE 124 US Insight Engines Market by Technology, 2023 - 2029, USD Million
- TABLE 125 US Insight Engines Market by Application, 2019 - 2022, USD Million
- TABLE 126 US Insight Engines Market by Application, 2023 - 2029, USD Million
- TABLE 127 US Insight Engines Market by Component, 2019 - 2022, USD Million
- TABLE 128 US Insight Engines Market by Component, 2023 - 2029, USD Million
- TABLE 129 US Insight Engines Market by Deployment Type, 2019 - 2022, USD Million
- TABLE 130 US Insight Engines Market by Deployment Type, 2023 - 2029, USD Million
- TABLE 131 US Insight Engines Market by Organization Size, 2019 - 2022, USD Million
- TABLE 132 US Insight Engines Market by Organization Size, 2023 - 2029, USD Million
- TABLE 133 US Insight Engines Market by Vertical, 2019 - 2022, USD Million
- TABLE 134 US Insight Engines Market by Vertical, 2023 - 2029, USD Million
- TABLE 135 Canada Insight Engines Market, 2019 - 2022, USD Million
- TABLE 136 Canada Insight Engines Market, 2023 - 2029, USD Million
- TABLE 137 Canada Insight Engines Market by Technology, 2019 - 2022, USD Million
- TABLE 138 Canada Insight Engines Market by Technology, 2023 - 2029, USD Million
- TABLE 139 Canada Insight Engines Market by Application, 2019 - 2022, USD Million
- TABLE 140 Canada Insight Engines Market by Application, 2023 - 2029, USD Million
- TABLE 141 Canada Insight Engines Market by Component, 2019 - 2022, USD Million
- TABLE 142 Canada Insight Engines Market by Component, 2023 - 2029, USD Million
- TABLE 143 Canada Insight Engines Market by Deployment Type, 2019 - 2022, USD Million
- TABLE 144 Canada Insight Engines Market by Deployment Type, 2023 - 2029, USD Million
- TABLE 145 Canada Insight Engines Market by Organization Size, 2019 - 2022, USD Million
- TABLE 146 Canada Insight Engines Market by Organization Size, 2023 - 2029, USD Million
- TABLE 147 Canada Insight Engines Market by Vertical, 2019 - 2022, USD Million
- TABLE 148 Canada Insight Engines Market by Vertical, 2023 - 2029, USD Million
- TABLE 149 Mexico Insight Engines Market, 2019 - 2022, USD Million
- TABLE 150 Mexico Insight Engines Market, 2023 - 2029, USD Million
- TABLE 151 Mexico Insight Engines Market by Technology, 2019 - 2022, USD Million
- TABLE 152 Mexico Insight Engines Market by Technology, 2023 - 2029, USD Million
- TABLE 153 Mexico Insight Engines Market by Application, 2019 - 2022, USD Million
- TABLE 154 Mexico Insight Engines Market by Application, 2023 - 2029, USD Million
- TABLE 155 Mexico Insight Engines Market by Component, 2019 - 2022, USD Million
- TABLE 156 Mexico Insight Engines Market by Component, 2023 - 2029, USD Million
- TABLE 157 Mexico Insight Engines Market by Deployment Type, 2019 - 2022, USD Million
- TABLE 158 Mexico Insight Engines Market by Deployment Type, 2023 - 2029, USD Million
- TABLE 159 Mexico Insight Engines Market by Organization Size, 2019 - 2022, USD Million
- TABLE 160 Mexico Insight Engines Market by Organization Size, 2023 - 2029, USD Million
- TABLE 161 Mexico Insight Engines Market by Vertical, 2019 - 2022, USD Million
- TABLE 162 Mexico Insight Engines Market by Vertical, 2023 - 2029, USD Million
- TABLE 163 Rest of North America Insight Engines Market, 2019 - 2022, USD Million
- TABLE 164 Rest of North America Insight Engines Market, 2023 - 2029, USD Million
- TABLE 165 Rest of North America Insight Engines Market by Technology, 2019 - 2022, USD Million
- TABLE 166 Rest of North America Insight Engines Market by Technology, 2023 - 2029, USD Million
- TABLE 167 Rest of North America Insight Engines Market by Application, 2019 - 2022, USD Million
- TABLE 168 Rest of North America Insight Engines Market by Application, 2023 - 2029, USD Million
- TABLE 169 Rest of North America Insight Engines Market by Component, 2019 - 2022, USD Million
- TABLE 170 Rest of North America Insight Engines Market by Component, 2023 - 2029, USD Million
- TABLE 171 Rest of North America Insight Engines Market by Deployment Type, 2019 - 2022, USD Million
- TABLE 172 Rest of North America Insight Engines Market by Deployment Type, 2023 - 2029, USD Million
- TABLE 173 Rest of North America Insight Engines Market by Organization Size, 2019 - 2022, USD Million
- TABLE 174 Rest of North America Insight Engines Market by Organization Size, 2023 - 2029, USD Million
- TABLE 175 Rest of North America Insight Engines Market by Vertical, 2019 - 2022, USD Million
- TABLE 176 Rest of North America Insight Engines Market by Vertical, 2023 - 2029, USD Million
- TABLE 177 Europe Insight Engines Market, 2019 - 2022, USD Million
- TABLE 178 Europe Insight Engines Market, 2023 - 2029, USD Million
- TABLE 179 Europe Insight Engines Market by Technology, 2019 - 2022, USD Million
- TABLE 180 Europe Insight Engines Market by Technology, 2023 - 2029, USD Million
- TABLE 181 Europe Machine Learning Market by Country, 2019 - 2022, USD Million
- TABLE 182 Europe Machine Learning Market by Country, 2023 - 2029, USD Million
- TABLE 183 Europe Nature Language Processing Market by Country, 2019 - 2022, USD Million
- TABLE 184 Europe Nature Language Processing Market by Country, 2023 - 2029, USD Million
- TABLE 185 Europe Insight Engines Market by Application, 2019 - 2022, USD Million
- TABLE 186 Europe Insight Engines Market by Application, 2023 - 2029, USD Million
- TABLE 187 Europe Customer Management Market by Country, 2019 - 2022, USD Million
- TABLE 188 Europe Customer Management Market by Country, 2023 - 2029, USD Million
- TABLE 189 Europe Search & Discovery Market by Country, 2019 - 2022, USD Million
- TABLE 190 Europe Search & Discovery Market by Country, 2023 - 2029, USD Million
- TABLE 191 Europe Knowledge Management Market by Country, 2019 - 2022, USD Million
- TABLE 192 Europe Knowledge Management Market by Country, 2023 - 2029, USD Million
- TABLE 193 Europe Risk & Compliance Management Market by Country, 2019 - 2022, USD Million
- TABLE 194 Europe Risk & Compliance Management Market by Country, 2023 - 2029, USD Million
- TABLE 195 Europe Other Application Market by Country, 2019 - 2022, USD Million
- TABLE 196 Europe Other Application Market by Country, 2023 - 2029, USD Million
- TABLE 197 Europe Insight Engines Market by Component, 2019 - 2022, USD Million
- TABLE 198 Europe Insight Engines Market by Component, 2023 - 2029, USD Million
- TABLE 199 Europe Solution Market by Country, 2019 - 2022, USD Million
- TABLE 200 Europe Solution Market by Country, 2023 - 2029, USD Million
- TABLE 201 Europe Services Market by Country, 2019 - 2022, USD Million
- TABLE 202 Europe Services Market by Country, 2023 - 2029, USD Million
- TABLE 203 Europe Insight Engines Market by Deployment Type, 2019 - 2022, USD Million
- TABLE 204 Europe Insight Engines Market by Deployment Type, 2023 - 2029, USD Million
- TABLE 205 Europe Cloud Market by Country, 2019 - 2022, USD Million
- TABLE 206 Europe Cloud Market by Country, 2023 - 2029, USD Million
- TABLE 207 Europe On-premise Market by Country, 2019 - 2022, USD Million
- TABLE 208 Europe On-premise Market by Country, 2023 - 2029, USD Million
- TABLE 209 Europe Insight Engines Market by Organization Size, 2019 - 2022, USD Million
- TABLE 210 Europe Insight Engines Market by Organization Size, 2023 - 2029, USD Million
- TABLE 211 Europe Large Enterprises Market by Country, 2019 - 2022, USD Million
- TABLE 212 Europe Large Enterprises Market by Country, 2023 - 2029, USD Million
- TABLE 213 Europe Small & Medium Enterprises Market by Country, 2019 - 2022, USD Million
- TABLE 214 Europe Small & Medium Enterprises Market by Country, 2023 - 2029, USD Million
- TABLE 215 Europe Insight Engines Market by Vertical, 2019 - 2022, USD Million
- TABLE 216 Europe Insight Engines Market by Vertical, 2023 - 2029, USD Million
- TABLE 217 Europe BFSI Market by Country, 2019 - 2022, USD Million
- TABLE 218 Europe BFSI Market by Country, 2023 - 2029, USD Million
- TABLE 219 Europe IT & ITeS Market by Country, 2019 - 2022, USD Million
- TABLE 220 Europe IT & ITeS Market by Country, 2023 - 2029, USD Million
- TABLE 221 Europe Retail & Ecommerce Market by Country, 2019 - 2022, USD Million
- TABLE 222 Europe Retail & Ecommerce Market by Country, 2023 - 2029, USD Million
- TABLE 223 Europe Telecom Market by Country, 2019 - 2022, USD Million
- TABLE 224 Europe Telecom Market by Country, 2023 - 2029, USD Million
- TABLE 225 Europe Manufacturing Market by Country, 2019 - 2022, USD Million
- TABLE 226 Europe Manufacturing Market by Country, 2023 - 2029, USD Million
- TABLE 227 Europe Healthcare & Lifesciences Market by Country, 2019 - 2022, USD Million
- TABLE 228 Europe Healthcare & Lifesciences Market by Country, 2023 - 2029, USD Million
- TABLE 229 Europe Government Market by Country, 2019 - 2022, USD Million
- TABLE 230 Europe Government Market by Country, 2023 - 2029, USD Million
- TABLE 231 Europe Others Market by Country, 2019 - 2022, USD Million
- TABLE 232 Europe Others Market by Country, 2023 - 2029, USD Million
- TABLE 233 Europe Insight Engines Market by Country, 2019 - 2022, USD Million
- TABLE 234 Europe Insight Engines Market by Country, 2023 - 2029, USD Million
- TABLE 235 Germany Insight Engines Market, 2019 - 2022, USD Million
- TABLE 236 Germany Insight Engines Market, 2023 - 2029, USD Million
- TABLE 237 Germany Insight Engines Market by Technology, 2019 - 2022, USD Million
- TABLE 238 Germany Insight Engines Market by Technology, 2023 - 2029, USD Million
- TABLE 239 Germany Insight Engines Market by Application, 2019 - 2022, USD Million
- TABLE 240 Germany Insight Engines Market by Application, 2023 - 2029, USD Million
- TABLE 241 Germany Insight Engines Market by Component, 2019 - 2022, USD Million
- TABLE 242 Germany Insight Engines Market by Component, 2023 - 2029, USD Million
- TABLE 243 Germany Insight Engines Market by Deployment Type, 2019 - 2022, USD Million
- TABLE 244 Germany Insight Engines Market by Deployment Type, 2023 - 2029, USD Million
- TABLE 245 Germany Insight Engines Market by Organization Size, 2019 - 2022, USD Million
- TABLE 246 Germany Insight Engines Market by Organization Size, 2023 - 2029, USD Million
- TABLE 247 Germany Insight Engines Market by Vertical, 2019 - 2022, USD Million
- TABLE 248 Germany Insight Engines Market by Vertical, 2023 - 2029, USD Million
- TABLE 249 UK Insight Engines Market, 2019 - 2022, USD Million
- TABLE 250 UK Insight Engines Market, 2023 - 2029, USD Million
- TABLE 251 UK Insight Engines Market by Technology, 2019 - 2022, USD Million
- TABLE 252 UK Insight Engines Market by Technology, 2023 - 2029, USD Million
- TABLE 253 UK Insight Engines Market by Application, 2019 - 2022, USD Million
- TABLE 254 UK Insight Engines Market by Application, 2023 - 2029, USD Million
- TABLE 255 UK Insight Engines Market by Component, 2019 - 2022, USD Million
- TABLE 256 UK Insight Engines Market by Component, 2023 - 2029, USD Million
- TABLE 257 UK Insight Engines Market by Deployment Type, 2019 - 2022, USD Million
- TABLE 258 UK Insight Engines Market by Deployment Type, 2023 - 2029, USD Million
- TABLE 259 UK Insight Engines Market by Organization Size, 2019 - 2022, USD Million
- TABLE 260 UK Insight Engines Market by Organization Size, 2023 - 2029, USD Million
- TABLE 261 UK Insight Engines Market by Vertical, 2019 - 2022, USD Million
- TABLE 262 UK Insight Engines Market by Vertical, 2023 - 2029, USD Million
- TABLE 263 France Insight Engines Market, 2019 - 2022, USD Million
- TABLE 264 France Insight Engines Market, 2023 - 2029, USD Million
- TABLE 265 France Insight Engines Market by Technology, 2019 - 2022, USD Million
- TABLE 266 France Insight Engines Market by Technology, 2023 - 2029, USD Million
- TABLE 267 France Insight Engines Market by Application, 2019 - 2022, USD Million
- TABLE 268 France Insight Engines Market by Application, 2023 - 2029, USD Million
- TABLE 269 France Insight Engines Market by Component, 2019 - 2022, USD Million
- TABLE 270 France Insight Engines Market by Component, 2023 - 2029, USD Million
- TABLE 271 France Insight Engines Market by Deployment Type, 2019 - 2022, USD Million
- TABLE 272 France Insight Engines Market by Deployment Type, 2023 - 2029, USD Million
- TABLE 273 France Insight Engines Market by Organization Size, 2019 - 2022, USD Million
- TABLE 274 France Insight Engines Market by Organization Size, 2023 - 2029, USD Million
- TABLE 275 France Insight Engines Market by Vertical, 2019 - 2022, USD Million
- TABLE 276 France Insight Engines Market by Vertical, 2023 - 2029, USD Million
- TABLE 277 Russia Insight Engines Market, 2019 - 2022, USD Million
- TABLE 278 Russia Insight Engines Market, 2023 - 2029, USD Million
- TABLE 279 Russia Insight Engines Market by Technology, 2019 - 2022, USD Million
- TABLE 280 Russia Insight Engines Market by Technology, 2023 - 2029, USD Million
- TABLE 281 Russia Insight Engines Market by Application, 2019 - 2022, USD Million
- TABLE 282 Russia Insight Engines Market by Application, 2023 - 2029, USD Million
- TABLE 283 Russia Insight Engines Market by Component, 2019 - 2022, USD Million
- TABLE 284 Russia Insight Engines Market by Component, 2023 - 2029, USD Million
- TABLE 285 Russia Insight Engines Market by Deployment Type, 2019 - 2022, USD Million
- TABLE 286 Russia Insight Engines Market by Deployment Type, 2023 - 2029, USD Million
- TABLE 287 Russia Insight Engines Market by Organization Size, 2019 - 2022, USD Million
- TABLE 288 Russia Insight Engines Market by Organization Size, 2023 - 2029, USD Million
- TABLE 289 Russia Insight Engines Market by Vertical, 2019 - 2022, USD Million
- TABLE 290 Russia Insight Engines Market by Vertical, 2023 - 2029, USD Million
- TABLE 291 Spain Insight Engines Market, 2019 - 2022, USD Million
- TABLE 292 Spain Insight Engines Market, 2023 - 2029, USD Million
- TABLE 293 Spain Insight Engines Market by Technology, 2019 - 2022, USD Million
- TABLE 294 Spain Insight Engines Market by Technology, 2023 - 2029, USD Million
- TABLE 295 Spain Insight Engines Market by Application, 2019 - 2022, USD Million
- TABLE 296 Spain Insight Engines Market by Application, 2023 - 2029, USD Million
- TABLE 297 Spain Insight Engines Market by Component, 2019 - 2022, USD Million
- TABLE 298 Spain Insight Engines Market by Component, 2023 - 2029, USD Million
- TABLE 299 Spain Insight Engines Market by Deployment Type, 2019 - 2022, USD Million
- TABLE 300 Spain Insight Engines Market by Deployment Type, 2023 - 2029, USD Million
- TABLE 301 Spain Insight Engines Market by Organization Size, 2019 - 2022, USD Million
- TABLE 302 Spain Insight Engines Market by Organization Size, 2023 - 2029, USD Million
- TABLE 303 Spain Insight Engines Market by Vertical, 2019 - 2022, USD Million
- TABLE 304 Spain Insight Engines Market by Vertical, 2023 - 2029, USD Million
- TABLE 305 Italy Insight Engines Market, 2019 - 2022, USD Million
- TABLE 306 Italy Insight Engines Market, 2023 - 2029, USD Million
- TABLE 307 Italy Insight Engines Market by Technology, 2019 - 2022, USD Million
- TABLE 308 Italy Insight Engines Market by Technology, 2023 - 2029, USD Million
- TABLE 309 Italy Insight Engines Market by Application, 2019 - 2022, USD Million
- TABLE 310 Italy Insight Engines Market by Application, 2023 - 2029, USD Million
- TABLE 311 Italy Insight Engines Market by Component, 2019 - 2022, USD Million
- TABLE 312 Italy Insight Engines Market by Component, 2023 - 2029, USD Million
- TABLE 313 Italy Insight Engines Market by Deployment Type, 2019 - 2022, USD Million
- TABLE 314 Italy Insight Engines Market by Deployment Type, 2023 - 2029, USD Million
- TABLE 315 Italy Insight Engines Market by Organization Size, 2019 - 2022, USD Million
- TABLE 316 Italy Insight Engines Market by Organization Size, 2023 - 2029, USD Million
- TABLE 317 Italy Insight Engines Market by Vertical, 2019 - 2022, USD Million
- TABLE 318 Italy Insight Engines Market by Vertical, 2023 - 2029, USD Million
- TABLE 319 Rest of Europe Insight Engines Market, 2019 - 2022, USD Million
- TABLE 320 Rest of Europe Insight Engines Market, 2023 - 2029, USD Million
- TABLE 321 Rest of Europe Insight Engines Market by Technology, 2019 - 2022, USD Million
- TABLE 322 Rest of Europe Insight Engines Market by Technology, 2023 - 2029, USD Million
- TABLE 323 Rest of Europe Insight Engines Market by Application, 2019 - 2022, USD Million
- TABLE 324 Rest of Europe Insight Engines Market by Application, 2023 - 2029, USD Million
- TABLE 325 Rest of Europe Insight Engines Market by Component, 2019 - 2022, USD Million
- TABLE 326 Rest of Europe Insight Engines Market by Component, 2023 - 2029, USD Million
- TABLE 327 Rest of Europe Insight Engines Market by Deployment Type, 2019 - 2022, USD Million
- TABLE 328 Rest of Europe Insight Engines Market by Deployment Type, 2023 - 2029, USD Million
- TABLE 329 Rest of Europe Insight Engines Market by Organization Size, 2019 - 2022, USD Million
- TABLE 330 Rest of Europe Insight Engines Market by Organization Size, 2023 - 2029, USD Million
- TABLE 331 Rest of Europe Insight Engines Market by Vertical, 2019 - 2022, USD Million
- TABLE 332 Rest of Europe Insight Engines Market by Vertical, 2023 - 2029, USD Million
- TABLE 333 Asia Pacific Insight Engines Market, 2019 - 2022, USD Million
- TABLE 334 Asia Pacific Insight Engines Market, 2023 - 2029, USD Million
- TABLE 335 Asia Pacific Insight Engines Market by Technology, 2019 - 2022, USD Million
- TABLE 336 Asia Pacific Insight Engines Market by Technology, 2023 - 2029, USD Million
- TABLE 337 Asia Pacific Machine Learning Market by Country, 2019 - 2022, USD Million
- TABLE 338 Asia Pacific Machine Learning Market by Country, 2023 - 2029, USD Million
- TABLE 339 Asia Pacific Nature Language Processing Market by Country, 2019 - 2022, USD Million
- TABLE 340 Asia Pacific Nature Language Processing Market by Country, 2023 - 2029, USD Million
- TABLE 341 Asia Pacific Insight Engines Market by Application, 2019 - 2022, USD Million
- TABLE 342 Asia Pacific Insight Engines Market by Application, 2023 - 2029, USD Million
- TABLE 343 Asia Pacific Customer Management Market by Country, 2019 - 2022, USD Million
- TABLE 344 Asia Pacific Customer Management Market by Country, 2023 - 2029, USD Million
- TABLE 345 Asia Pacific Search & Discovery Market by Country, 2019 - 2022, USD Million
- TABLE 346 Asia Pacific Search & Discovery Market by Country, 2023 - 2029, USD Million
- TABLE 347 Asia Pacific Knowledge Management Market by Country, 2019 - 2022, USD Million
- TABLE 348 Asia Pacific Knowledge Management Market by Country, 2023 - 2029, USD Million
- TABLE 349 Asia Pacific Risk & Compliance Management Market by Country, 2019 - 2022, USD Million
- TABLE 350 Asia Pacific Risk & Compliance Management Market by Country, 2023 - 2029, USD Million
- TABLE 351 Asia Pacific Other Application Market by Country, 2019 - 2022, USD Million
- TABLE 352 Asia Pacific Other Application Market by Country, 2023 - 2029, USD Million
- TABLE 353 Asia Pacific Insight Engines Market by Component, 2019 - 2022, USD Million
- TABLE 354 Asia Pacific Insight Engines Market by Component, 2023 - 2029, USD Million
- TABLE 355 Asia Pacific Solution Market by Country, 2019 - 2022, USD Million
- TABLE 356 Asia Pacific Solution Market by Country, 2023 - 2029, USD Million
- TABLE 357 Asia Pacific Services Market by Country, 2019 - 2022, USD Million
- TABLE 358 Asia Pacific Services Market by Country, 2023 - 2029, USD Million
- TABLE 359 Asia Pacific Insight Engines Market by Deployment Type, 2019 - 2022, USD Million
- TABLE 360 Asia Pacific Insight Engines Market by Deployment Type, 2023 - 2029, USD Million
- TABLE 361 Asia Pacific Cloud Market by Country, 2019 - 2022, USD Million
- TABLE 362 Asia Pacific Cloud Market by Country, 2023 - 2029, USD Million
- TABLE 363 Asia Pacific On-premise Market by Country, 2019 - 2022, USD Million
- TABLE 364 Asia Pacific On-premise Market by Country, 2023 - 2029, USD Million
- TABLE 365 Asia Pacific Insight Engines Market by Organization Size, 2019 - 2022, USD Million
- TABLE 366 Asia Pacific Insight Engines Market by Organization Size, 2023 - 2029, USD Million
- TABLE 367 Asia Pacific Large Enterprises Market by Country, 2019 - 2022, USD Million
- TABLE 368 Asia Pacific Large Enterprises Market by Country, 2023 - 2029, USD Million
- TABLE 369 Asia Pacific Small & Medium Enterprises Market by Country, 2019 - 2022, USD Million
- TABLE 370 Asia Pacific Small & Medium Enterprises Market by Country, 2023 - 2029, USD Million
- TABLE 371 Asia Pacific Insight Engines Market by Vertical, 2019 - 2022, USD Million
- TABLE 372 Asia Pacific Insight Engines Market by Vertical, 2023 - 2029, USD Million
- TABLE 373 Asia Pacific BFSI Market by Country, 2019 - 2022, USD Million
- TABLE 374 Asia Pacific BFSI Market by Country, 2023 - 2029, USD Million
- TABLE 375 Asia Pacific IT & ITeS Market by Country, 2019 - 2022, USD Million
- TABLE 376 Asia Pacific IT & ITeS Market by Country, 2023 - 2029, USD Million
- TABLE 377 Asia Pacific Retail & Ecommerce Market by Country, 2019 - 2022, USD Million
- TABLE 378 Asia Pacific Retail & Ecommerce Market by Country, 2023 - 2029, USD Million
- TABLE 379 Asia Pacific Telecom Market by Country, 2019 - 2022, USD Million
- TABLE 380 Asia Pacific Telecom Market by Country, 2023 - 2029, USD Million
- TABLE 381 Asia Pacific Manufacturing Market by Country, 2019 - 2022, USD Million
- TABLE 382 Asia Pacific Manufacturing Market by Country, 2023 - 2029, USD Million
- TABLE 383 Asia Pacific Healthcare & Lifesciences Market by Country, 2019 - 2022, USD Million
- TABLE 384 Asia Pacific Healthcare & Lifesciences Market by Country, 2023 - 2029, USD Million
- TABLE 385 Asia Pacific Government Market by Country, 2019 - 2022, USD Million
- TABLE 386 Asia Pacific Government Market by Country, 2023 - 2029, USD Million
- TABLE 387 Asia Pacific Others Market by Country, 2019 - 2022, USD Million
- TABLE 388 Asia Pacific Others Market by Country, 2023 - 2029, USD Million
- TABLE 389 Asia Pacific Insight Engines Market by Country, 2019 - 2022, USD Million
- TABLE 390 Asia Pacific Insight Engines Market by Country, 2023 - 2029, USD Million
- TABLE 391 China Insight Engines Market, 2019 - 2022, USD Million
- TABLE 392 China Insight Engines Market, 2023 - 2029, USD Million
- TABLE 393 China Insight Engines Market by Technology, 2019 - 2022, USD Million
- TABLE 394 China Insight Engines Market by Technology, 2023 - 2029, USD Million
- TABLE 395 China Insight Engines Market by Application, 2019 - 2022, USD Million
- TABLE 396 China Insight Engines Market by Application, 2023 - 2029, USD Million
- TABLE 397 China Insight Engines Market by Component, 2019 - 2022, USD Million
- TABLE 398 China Insight Engines Market by Component, 2023 - 2029, USD Million
- TABLE 399 China Insight Engines Market by Deployment Type, 2019 - 2022, USD Million
- TABLE 400 China Insight Engines Market by Deployment Type, 2023 - 2029, USD Million
- TABLE 401 China Insight Engines Market by Organization Size, 2019 - 2022, USD Million
- TABLE 402 China Insight Engines Market by Organization Size, 2023 - 2029, USD Million
- TABLE 403 China Insight Engines Market by Vertical, 2019 - 2022, USD Million
- TABLE 404 China Insight Engines Market by Vertical, 2023 - 2029, USD Million
- TABLE 405 Japan Insight Engines Market, 2019 - 2022, USD Million
- TABLE 406 Japan Insight Engines Market, 2023 - 2029, USD Million
- TABLE 407 Japan Insight Engines Market by Technology, 2019 - 2022, USD Million
- TABLE 408 Japan Insight Engines Market by Technology, 2023 - 2029, USD Million
- TABLE 409 Japan Insight Engines Market by Application, 2019 - 2022, USD Million
- TABLE 410 Japan Insight Engines Market by Application, 2023 - 2029, USD Million
- TABLE 411 Japan Insight Engines Market by Component, 2019 - 2022, USD Million
- TABLE 412 Japan Insight Engines Market by Component, 2023 - 2029, USD Million
- TABLE 413 Japan Insight Engines Market by Deployment Type, 2019 - 2022, USD Million
- TABLE 414 Japan Insight Engines Market by Deployment Type, 2023 - 2029, USD Million
- TABLE 415 Japan Insight Engines Market by Organization Size, 2019 - 2022, USD Million
- TABLE 416 Japan Insight Engines Market by Organization Size, 2023 - 2029, USD Million
- TABLE 417 Japan Insight Engines Market by Vertical, 2019 - 2022, USD Million
- TABLE 418 Japan Insight Engines Market by Vertical, 2023 - 2029, USD Million
- TABLE 419 India Insight Engines Market, 2019 - 2022, USD Million
- TABLE 420 India Insight Engines Market, 2023 - 2029, USD Million
- TABLE 421 India Insight Engines Market by Technology, 2019 - 2022, USD Million
- TABLE 422 India Insight Engines Market by Technology, 2023 - 2029, USD Million
- TABLE 423 India Insight Engines Market by Application, 2019 - 2022, USD Million
- TABLE 424 India Insight Engines Market by Application, 2023 - 2029, USD Million
- TABLE 425 India Insight Engines Market by Component, 2019 - 2022, USD Million
- TABLE 426 India Insight Engines Market by Component, 2023 - 2029, USD Million
- TABLE 427 India Insight Engines Market by Deployment Type, 2019 - 2022, USD Million
- TABLE 428 India Insight Engines Market by Deployment Type, 2023 - 2029, USD Million
- TABLE 429 India Insight Engines Market by Organization Size, 2019 - 2022, USD Million
- TABLE 430 India Insight Engines Market by Organization Size, 2023 - 2029, USD Million
- TABLE 431 India Insight Engines Market by Vertical, 2019 - 2022, USD Million
- TABLE 432 India Insight Engines Market by Vertical, 2023 - 2029, USD Million
- TABLE 433 South Korea Insight Engines Market, 2019 - 2022, USD Million
- TABLE 434 South Korea Insight Engines Market, 2023 - 2029, USD Million
- TABLE 435 South Korea Insight Engines Market by Technology, 2019 - 2022, USD Million
- TABLE 436 South Korea Insight Engines Market by Technology, 2023 - 2029, USD Million
- TABLE 437 South Korea Insight Engines Market by Application, 2019 - 2022, USD Million
- TABLE 438 South Korea Insight Engines Market by Application, 2023 - 2029, USD Million
- TABLE 439 South Korea Insight Engines Market by Component, 2019 - 2022, USD Million
- TABLE 440 South Korea Insight Engines Market by Component, 2023 - 2029, USD Million
- TABLE 441 South Korea Insight Engines Market by Deployment Type, 2019 - 2022, USD Million
- TABLE 442 South Korea Insight Engines Market by Deployment Type, 2023 - 2029, USD Million
- TABLE 443 South Korea Insight Engines Market by Organization Size, 2019 - 2022, USD Million
- TABLE 444 South Korea Insight Engines Market by Organization Size, 2023 - 2029, USD Million
- TABLE 445 South Korea Insight Engines Market by Vertical, 2019 - 2022, USD Million
- TABLE 446 South Korea Insight Engines Market by Vertical, 2023 - 2029, USD Million
- TABLE 447 Singapore Insight Engines Market, 2019 - 2022, USD Million
- TABLE 448 Singapore Insight Engines Market, 2023 - 2029, USD Million
- TABLE 449 Singapore Insight Engines Market by Technology, 2019 - 2022, USD Million
- TABLE 450 Singapore Insight Engines Market by Technology, 2023 - 2029, USD Million
- TABLE 451 Singapore Insight Engines Market by Application, 2019 - 2022, USD Million
- TABLE 452 Singapore Insight Engines Market by Application, 2023 - 2029, USD Million
- TABLE 453 Singapore Insight Engines Market by Component, 2019 - 2022, USD Million
- TABLE 454 Singapore Insight Engines Market by Component, 2023 - 2029, USD Million
- TABLE 455 Singapore Insight Engines Market by Deployment Type, 2019 - 2022, USD Million
- TABLE 456 Singapore Insight Engines Market by Deployment Type, 2023 - 2029, USD Million
- TABLE 457 Singapore Insight Engines Market by Organization Size, 2019 - 2022, USD Million
- TABLE 458 Singapore Insight Engines Market by Organization Size, 2023 - 2029, USD Million
- TABLE 459 Singapore Insight Engines Market by Vertical, 2019 - 2022, USD Million
- TABLE 460 Singapore Insight Engines Market by Vertical, 2023 - 2029, USD Million
- TABLE 461 Malaysia Insight Engines Market, 2019 - 2022, USD Million
- TABLE 462 Malaysia Insight Engines Market, 2023 - 2029, USD Million
- TABLE 463 Malaysia Insight Engines Market by Technology, 2019 - 2022, USD Million
- TABLE 464 Malaysia Insight Engines Market by Technology, 2023 - 2029, USD Million
- TABLE 465 Malaysia Insight Engines Market by Application, 2019 - 2022, USD Million
- TABLE 466 Malaysia Insight Engines Market by Application, 2023 - 2029, USD Million
- TABLE 467 Malaysia Insight Engines Market by Component, 2019 - 2022, USD Million
- TABLE 468 Malaysia Insight Engines Market by Component, 2023 - 2029, USD Million
- TABLE 469 Malaysia Insight Engines Market by Deployment Type, 2019 - 2022, USD Million
- TABLE 470 Malaysia Insight Engines Market by Deployment Type, 2023 - 2029, USD Million
- TABLE 471 Malaysia Insight Engines Market by Organization Size, 2019 - 2022, USD Million
- TABLE 472 Malaysia Insight Engines Market by Organization Size, 2023 - 2029, USD Million
- TABLE 473 Malaysia Insight Engines Market by Vertical, 2019 - 2022, USD Million
- TABLE 474 Malaysia Insight Engines Market by Vertical, 2023 - 2029, USD Million
- TABLE 475 Rest of Asia Pacific Insight Engines Market, 2019 - 2022, USD Million
- TABLE 476 Rest of Asia Pacific Insight Engines Market, 2023 - 2029, USD Million
- TABLE 477 Rest of Asia Pacific Insight Engines Market by Technology, 2019 - 2022, USD Million
- TABLE 478 Rest of Asia Pacific Insight Engines Market by Technology, 2023 - 2029, USD Million
- TABLE 479 Rest of Asia Pacific Insight Engines Market by Application, 2019 - 2022, USD Million
- TABLE 480 Rest of Asia Pacific Insight Engines Market by Application, 2023 - 2029, USD Million
- TABLE 481 Rest of Asia Pacific Insight Engines Market by Component, 2019 - 2022, USD Million
- TABLE 482 Rest of Asia Pacific Insight Engines Market by Component, 2023 - 2029, USD Million
- TABLE 483 Rest of Asia Pacific Insight Engines Market by Deployment Type, 2019 - 2022, USD Million
- TABLE 484 Rest of Asia Pacific Insight Engines Market by Deployment Type, 2023 - 2029, USD Million
- TABLE 485 Rest of Asia Pacific Insight Engines Market by Organization Size, 2019 - 2022, USD Million
- TABLE 486 Rest of Asia Pacific Insight Engines Market by Organization Size, 2023 - 2029, USD Million
- TABLE 487 Rest of Asia Pacific Insight Engines Market by Vertical, 2019 - 2022, USD Million
- TABLE 488 Rest of Asia Pacific Insight Engines Market by Vertical, 2023 - 2029, USD Million
- TABLE 489 LAMEA Insight Engines Market, 2019 - 2022, USD Million
- TABLE 490 LAMEA Insight Engines Market, 2023 - 2029, USD Million
- TABLE 491 LAMEA Insight Engines Market by Technology, 2019 - 2022, USD Million
- TABLE 492 LAMEA Insight Engines Market by Technology, 2023 - 2029, USD Million
- TABLE 493 LAMEA Machine Learning Market by Country, 2019 - 2022, USD Million
- TABLE 494 LAMEA Machine Learning Market by Country, 2023 - 2029, USD Million
- TABLE 495 LAMEA Nature Language Processing Market by Country, 2019 - 2022, USD Million
- TABLE 496 LAMEA Nature Language Processing Market by Country, 2023 - 2029, USD Million
- TABLE 497 LAMEA Insight Engines Market by Application, 2019 - 2022, USD Million
- TABLE 498 LAMEA Insight Engines Market by Application, 2023 - 2029, USD Million
- TABLE 499 LAMEA Customer Management Market by Country, 2019 - 2022, USD Million
- TABLE 500 LAMEA Customer Management Market by Country, 2023 - 2029, USD Million
- TABLE 501 LAMEA Search & Discovery Market by Country, 2019 - 2022, USD Million
- TABLE 502 LAMEA Search & Discovery Market by Country, 2023 - 2029, USD Million
- TABLE 503 LAMEA Knowledge Management Market by Country, 2019 - 2022, USD Million
- TABLE 504 LAMEA Knowledge Management Market by Country, 2023 - 2029, USD Million
- TABLE 505 LAMEA Risk & Compliance Management Market by Country, 2019 - 2022, USD Million
- TABLE 506 LAMEA Risk & Compliance Management Market by Country, 2023 - 2029, USD Million
- TABLE 507 LAMEA Other Application Market by Country, 2019 - 2022, USD Million
- TABLE 508 LAMEA Other Application Market by Country, 2023 - 2029, USD Million
- TABLE 509 LAMEA Insight Engines Market by Component, 2019 - 2022, USD Million
- TABLE 510 LAMEA Insight Engines Market by Component, 2023 - 2029, USD Million
- TABLE 511 LAMEA Solution Market by Country, 2019 - 2022, USD Million
- TABLE 512 LAMEA Solution Market by Country, 2023 - 2029, USD Million
- TABLE 513 LAMEA Services Market by Country, 2019 - 2022, USD Million
- TABLE 514 LAMEA Services Market by Country, 2023 - 2029, USD Million
- TABLE 515 LAMEA Insight Engines Market by Deployment Type, 2019 - 2022, USD Million
- TABLE 516 LAMEA Insight Engines Market by Deployment Type, 2023 - 2029, USD Million
- TABLE 517 LAMEA Cloud Market by Country, 2019 - 2022, USD Million
- TABLE 518 LAMEA Cloud Market by Country, 2023 - 2029, USD Million
- TABLE 519 LAMEA On-premise Market by Country, 2019 - 2022, USD Million
- TABLE 520 LAMEA On-premise Market by Country, 2023 - 2029, USD Million
- TABLE 521 LAMEA Insight Engines Market by Organization Size, 2019 - 2022, USD Million
- TABLE 522 LAMEA Insight Engines Market by Organization Size, 2023 - 2029, USD Million
- TABLE 523 LAMEA Large Enterprises Market by Country, 2019 - 2022, USD Million
- TABLE 524 LAMEA Large Enterprises Market by Country, 2023 - 2029, USD Million
- TABLE 525 LAMEA Small & Medium Enterprises Market by Country, 2019 - 2022, USD Million
- TABLE 526 LAMEA Small & Medium Enterprises Market by Country, 2023 - 2029, USD Million
- TABLE 527 LAMEA Insight Engines Market by Vertical, 2019 - 2022, USD Million
- TABLE 528 LAMEA Insight Engines Market by Vertical, 2023 - 2029, USD Million
- TABLE 529 LAMEA BFSI Market by Country, 2019 - 2022, USD Million
- TABLE 530 LAMEA BFSI Market by Country, 2023 - 2029, USD Million
- TABLE 531 LAMEA IT & ITeS Market by Country, 2019 - 2022, USD Million
- TABLE 532 LAMEA IT & ITeS Market by Country, 2023 - 2029, USD Million
- TABLE 533 LAMEA Retail & Ecommerce Market by Country, 2019 - 2022, USD Million
- TABLE 534 LAMEA Retail & Ecommerce Market by Country, 2023 - 2029, USD Million
- TABLE 535 LAMEA Telecom Market by Country, 2019 - 2022, USD Million
- TABLE 536 LAMEA Telecom Market by Country, 2023 - 2029, USD Million
- TABLE 537 LAMEA Manufacturing Market by Country, 2019 - 2022, USD Million
- TABLE 538 LAMEA Manufacturing Market by Country, 2023 - 2029, USD Million
- TABLE 539 LAMEA Healthcare & Lifesciences Market by Country, 2019 - 2022, USD Million
- TABLE 540 LAMEA Healthcare & Lifesciences Market by Country, 2023 - 2029, USD Million
- TABLE 541 LAMEA Government Market by Country, 2019 - 2022, USD Million
- TABLE 542 LAMEA Government Market by Country, 2023 - 2029, USD Million
- TABLE 543 LAMEA Others Market by Country, 2019 - 2022, USD Million
- TABLE 544 LAMEA Others Market by Country, 2023 - 2029, USD Million
- TABLE 545 LAMEA Insight Engines Market by Country, 2019 - 2022, USD Million
- TABLE 546 LAMEA Insight Engines Market by Country, 2023 - 2029, USD Million
- TABLE 547 Brazil Insight Engines Market, 2019 - 2022, USD Million
- TABLE 548 Brazil Insight Engines Market, 2023 - 2029, USD Million
- TABLE 549 Brazil Insight Engines Market by Technology, 2019 - 2022, USD Million
- TABLE 550 Brazil Insight Engines Market by Technology, 2023 - 2029, USD Million
- TABLE 551 Brazil Insight Engines Market by Application, 2019 - 2022, USD Million
- TABLE 552 Brazil Insight Engines Market by Application, 2023 - 2029, USD Million
- TABLE 553 Brazil Insight Engines Market by Component, 2019 - 2022, USD Million
- TABLE 554 Brazil Insight Engines Market by Component, 2023 - 2029, USD Million
- TABLE 555 Brazil Insight Engines Market by Deployment Type, 2019 - 2022, USD Million
- TABLE 556 Brazil Insight Engines Market by Deployment Type, 2023 - 2029, USD Million
- TABLE 557 Brazil Insight Engines Market by Organization Size, 2019 - 2022, USD Million
- TABLE 558 Brazil Insight Engines Market by Organization Size, 2023 - 2029, USD Million
- TABLE 559 Brazil Insight Engines Market by Vertical, 2019 - 2022, USD Million
- TABLE 560 Brazil Insight Engines Market by Vertical, 2023 - 2029, USD Million
- TABLE 561 Argentina Insight Engines Market, 2019 - 2022, USD Million
- TABLE 562 Argentina Insight Engines Market, 2023 - 2029, USD Million
- TABLE 563 Argentina Insight Engines Market by Technology, 2019 - 2022, USD Million
- TABLE 564 Argentina Insight Engines Market by Technology, 2023 - 2029, USD Million
- TABLE 565 Argentina Insight Engines Market by Application, 2019 - 2022, USD Million
- TABLE 566 Argentina Insight Engines Market by Application, 2023 - 2029, USD Million
- TABLE 567 Argentina Insight Engines Market by Component, 2019 - 2022, USD Million
- TABLE 568 Argentina Insight Engines Market by Component, 2023 - 2029, USD Million
- TABLE 569 Argentina Insight Engines Market by Deployment Type, 2019 - 2022, USD Million
- TABLE 570 Argentina Insight Engines Market by Deployment Type, 2023 - 2029, USD Million
- TABLE 571 Argentina Insight Engines Market by Organization Size, 2019 - 2022, USD Million
- TABLE 572 Argentina Insight Engines Market by Organization Size, 2023 - 2029, USD Million
- TABLE 573 Argentina Insight Engines Market by Vertical, 2019 - 2022, USD Million
- TABLE 574 Argentina Insight Engines Market by Vertical, 2023 - 2029, USD Million
- TABLE 575 UAE Insight Engines Market, 2019 - 2022, USD Million
- TABLE 576 UAE Insight Engines Market, 2023 - 2029, USD Million
- TABLE 577 UAE Insight Engines Market by Technology, 2019 - 2022, USD Million
- TABLE 578 UAE Insight Engines Market by Technology, 2023 - 2029, USD Million
- TABLE 579 UAE Insight Engines Market by Application, 2019 - 2022, USD Million
- TABLE 580 UAE Insight Engines Market by Application, 2023 - 2029, USD Million
- TABLE 581 UAE Insight Engines Market by Component, 2019 - 2022, USD Million
- TABLE 582 UAE Insight Engines Market by Component, 2023 - 2029, USD Million
- TABLE 583 UAE Insight Engines Market by Deployment Type, 2019 - 2022, USD Million
- TABLE 584 UAE Insight Engines Market by Deployment Type, 2023 - 2029, USD Million
- TABLE 585 UAE Insight Engines Market by Organization Size, 2019 - 2022, USD Million
- TABLE 586 UAE Insight Engines Market by Organization Size, 2023 - 2029, USD Million
- TABLE 587 UAE Insight Engines Market by Vertical, 2019 - 2022, USD Million
- TABLE 588 UAE Insight Engines Market by Vertical, 2023 - 2029, USD Million
- TABLE 589 Saudi Arabia Insight Engines Market, 2019 - 2022, USD Million
- TABLE 590 Saudi Arabia Insight Engines Market, 2023 - 2029, USD Million
- TABLE 591 Saudi Arabia Insight Engines Market by Technology, 2019 - 2022, USD Million
- TABLE 592 Saudi Arabia Insight Engines Market by Technology, 2023 - 2029, USD Million
- TABLE 593 Saudi Arabia Insight Engines Market by Application, 2019 - 2022, USD Million
- TABLE 594 Saudi Arabia Insight Engines Market by Application, 2023 - 2029, USD Million
- TABLE 595 Saudi Arabia Insight Engines Market by Component, 2019 - 2022, USD Million
- TABLE 596 Saudi Arabia Insight Engines Market by Component, 2023 - 2029, USD Million
- TABLE 597 Saudi Arabia Insight Engines Market by Deployment Type, 2019 - 2022, USD Million
- TABLE 598 Saudi Arabia Insight Engines Market by Deployment Type, 2023 - 2029, USD Million
- TABLE 599 Saudi Arabia Insight Engines Market by Organization Size, 2019 - 2022, USD Million
- TABLE 600 Saudi Arabia Insight Engines Market by Organization Size, 2023 - 2029, USD Million
- TABLE 601 Saudi Arabia Insight Engines Market by Vertical, 2019 - 2022, USD Million
- TABLE 602 Saudi Arabia Insight Engines Market by Vertical, 2023 - 2029, USD Million
- TABLE 603 South Africa Insight Engines Market, 2019 - 2022, USD Million
- TABLE 604 South Africa Insight Engines Market, 2023 - 2029, USD Million
- TABLE 605 South Africa Insight Engines Market by Technology, 2019 - 2022, USD Million
- TABLE 606 South Africa Insight Engines Market by Technology, 2023 - 2029, USD Million
- TABLE 607 South Africa Insight Engines Market by Application, 2019 - 2022, USD Million
- TABLE 608 South Africa Insight Engines Market by Application, 2023 - 2029, USD Million
- TABLE 609 South Africa Insight Engines Market by Component, 2019 - 2022, USD Million
- TABLE 610 South Africa Insight Engines Market by Component, 2023 - 2029, USD Million
- TABLE 611 South Africa Insight Engines Market by Deployment Type, 2019 - 2022, USD Million
- TABLE 612 South Africa Insight Engines Market by Deployment Type, 2023 - 2029, USD Million
- TABLE 613 South Africa Insight Engines Market by Organization Size, 2019 - 2022, USD Million
- TABLE 614 South Africa Insight Engines Market by Organization Size, 2023 - 2029, USD Million
- TABLE 615 South Africa Insight Engines Market by Vertical, 2019 - 2022, USD Million
- TABLE 616 South Africa Insight Engines Market by Vertical, 2023 - 2029, USD Million
- TABLE 617 Nigeria Insight Engines Market, 2019 - 2022, USD Million
- TABLE 618 Nigeria Insight Engines Market, 2023 - 2029, USD Million
- TABLE 619 Nigeria Insight Engines Market by Technology, 2019 - 2022, USD Million
- TABLE 620 Nigeria Insight Engines Market by Technology, 2023 - 2029, USD Million
- TABLE 621 Nigeria Insight Engines Market by Application, 2019 - 2022, USD Million
- TABLE 622 Nigeria Insight Engines Market by Application, 2023 - 2029, USD Million
- TABLE 623 Nigeria Insight Engines Market by Component, 2019 - 2022, USD Million
- TABLE 624 Nigeria Insight Engines Market by Component, 2023 - 2029, USD Million
- TABLE 625 Nigeria Insight Engines Market by Deployment Type, 2019 - 2022, USD Million
- TABLE 626 Nigeria Insight Engines Market by Deployment Type, 2023 - 2029, USD Million
- TABLE 627 Nigeria Insight Engines Market by Organization Size, 2019 - 2022, USD Million
- TABLE 628 Nigeria Insight Engines Market by Organization Size, 2023 - 2029, USD Million
- TABLE 629 Nigeria Insight Engines Market by Vertical, 2019 - 2022, USD Million
- TABLE 630 Nigeria Insight Engines Market by Vertical, 2023 - 2029, USD Million
- TABLE 631 Rest of LAMEA Insight Engines Market, 2019 - 2022, USD Million
- TABLE 632 Rest of LAMEA Insight Engines Market, 2023 - 2029, USD Million
- TABLE 633 Rest of LAMEA Insight Engines Market by Technology, 2019 - 2022, USD Million
- TABLE 634 Rest of LAMEA Insight Engines Market by Technology, 2023 - 2029, USD Million
- TABLE 635 Rest of LAMEA Insight Engines Market by Application, 2019 - 2022, USD Million
- TABLE 636 Rest of LAMEA Insight Engines Market by Application, 2023 - 2029, USD Million
- TABLE 637 Rest of LAMEA Insight Engines Market by Component, 2019 - 2022, USD Million
- TABLE 638 Rest of LAMEA Insight Engines Market by Component, 2023 - 2029, USD Million
- TABLE 639 Rest of LAMEA Insight Engines Market by Deployment Type, 2019 - 2022, USD Million
- TABLE 640 Rest of LAMEA Insight Engines Market by Deployment Type, 2023 - 2029, USD Million
- TABLE 641 Rest of LAMEA Insight Engines Market by Organization Size, 2019 - 2022, USD Million
- TABLE 642 Rest of LAMEA Insight Engines Market by Organization Size, 2023 - 2029, USD Million
- TABLE 643 Rest of LAMEA Insight Engines Market by Vertical, 2019 - 2022, USD Million
- TABLE 644 Rest of LAMEA Insight Engines Market by Vertical, 2023 - 2029, USD Million
- TABLE 645 Key information - IBM Corporation
- TABLE 646 Key Information - Oracle Corporation
- TABLE 647 Key Information - SAP SE
- TABLE 648 key information - Microsoft Corporation
- TABLE 649 Key Information - OpenText Corporation
- TABLE 650 Key Information - Elastic N.V.
- TABLE 651 Key Information - expert.ai S.p.A.
- TABLE 652 Key Information - Almawave S.p.A.
- TABLE 653 Key Information - Mindbreeze GmbH
- TABLE 654 Key Information - Squirro AG
List of Figures
- FIG 1 Methodology for the research
- FIG 2 KBV Cardinal Matrix
- FIG 3 Key Leading Strategies: Percentage Distribution (2019-2023)
- FIG 4 Key Strategic Move: (Partnerships, Collaborations and Agreements : 2020, Nov - 2022, Nov) Leading Players
- FIG 5 Global Insight Engines Market share by Technology, 2022
- FIG 6 Global Insight Engines Market share by Technology, 2029
- FIG 7 Global Insight Engines Market by Technology, 2019 - 2029, USD Million
- FIG 8 Global Insight Engines Market share by Application, 2022
- FIG 9 Global Insight Engines Market share by Application, 2029
- FIG 10 Global Insight Engines Market by Application, 2019 - 2029, USD Million
- FIG 11 Global Insight Engines Market share by Component, 2022
- FIG 12 Global Insight Engines Market share by Component, 2029
- FIG 13 Global Insight Engines Market by Component, 2019 - 2029, USD Million
- FIG 14 Global Insight Engines Market share by Deployment Type, 2022
- FIG 15 Global Insight Engines Market share by Deployment Type, 2029
- FIG 16 Global Insight Engines Market by Deployment Type, 2019 - 2029, USD Million
- FIG 17 Global Insight Engines Market share by Organization Size, 2022
- FIG 18 Global Insight Engines Market share by Organization Size, 2029
- FIG 19 Global Insight Engines Market by Organization Size, 2019 - 2029, USD Million
- FIG 20 Global Insight Engines Market share by Vertical, 2022
- FIG 21 Global Insight Engines Market share by Vertical, 2029
- FIG 22 Global Insight Engines Market by Vertical, 2019 - 2029, USD Million
- FIG 23 Global Insight Engines Market share by Region, 2022
- FIG 24 Global Insight Engines Market share by Region, 2029
- FIG 25 Global Insight Engines Market by Region, 2019 - 2029, USD Million
- FIG 26 Recent strategies and developments: IBM Corporation
- FIG 27 Swot analysis: IBM Corporation
- FIG 28 Recent strategies and developments: Oracle Corporation
- FIG 29 SWOT analysis: Oracle Corporation
- FIG 30 Recent strategies and developments: SAP SE
- FIG 31 SWOT Analysis: SAP SE
- FIG 32 SWOT Analysis: Microsoft Corporation
- FIG 33 Swot analysis: OpenText Corporation
- FIG 34 Recent strategies and developments: Squirro AG
The Global Insight Engines Market size is expected to reach $6.6 billion by 2029, rising at a market growth of 25.4% CAGR during the forecast period.
The use of insight engines for gathering useful information from vast quantities of complex and diverse data sources. It employs the principles of natural language processing, which enables businesses to communicate with customers and comprehend their needs. A wider variety of technologies are utilized by an insight engine to use all available data sources. These may be internal or external, organized or unorganized sources. It facilitates the delivery of consumer insights and enhances the quality and scope of the inquiry, allowing businesses to make better decisions.
Developing technologies, such as natural language processing and chatbots, are becoming an increasingly common occurrence in the modern workplace as a result of an increase in the prevalence of the use of these systems by organizations. In order to gather information, capture and consolidate existing knowledge, and find correlations between widely dispersed information, these systems use techniques from artificial intelligence. The end result is that they are able to deliver detailed insights.
Insight engines are those that use pertinent or suitable techniques to construct, evaluate, organize, and finally arrange data in a particular order. This makes it possible to transfer current or synthesized data in the context of digital employees, end-consumers, or stakeholders in a proactive or highly interactive manner at particular commerce moments.
Whether the data or information is structured or unstructured will have a significant impact on the quality and value of the data or information used to produce valuable insights, which is projected to propel the development of the insight engine market. Structured data consists of clearly defined data types that are organized or arranged into searchable fields whose patterns can be easily queried.
COVID-19 Impact Analysis
During COVID-19, insight engines gained momentum as one of the top knowledge discovery alternatives for enterprise search. The market has witnessed a significant increase in enterprise application-generated data. As a result, significantly more time was spent developing meaningful insights for business decision-making. To advertise their insight engine during the COVID-19 pandemic, major market vendors introduced cutting-edge products with industry-specific and post-pandemic search capabilities, which further aided the market to grow in the pandemic.
Market Growth Factors
Increasing use of insight engines in the BFSI industry
By scanning social media and using Natural Language Processing to analyze conversations about their services and strategy, banks and other financial institutions are also using insight engines to locate and parse customer sentiment. With the ability to access crucial and segregated data, financial services analysts may create reports with greater accuracy and provide customers and internal decision-makers with better guidance. Personalizing banking services with data enhance client engagement and boosts earnings. Thus, with the increasing dependency of the BFSI sector on insight engines, is expected to aiding the insight engines market's growth with the rise in the sector.
Search engines' increasing understanding of context and complex query
By consulting experts to uncover solutions and evaluate novel ideas, expediting compliance, and enhancing customer service, businesses may profit from this search function. Insight engines are utilized by numerous company divisions, units, and departments. As it might offer a network of support to help users overcome obstacles, prepare and present data carefully suited to each user's demands, and satisfy the requirements of numerous departments, workers, and applications. Hence, with the engine's increasing capability to understand the context and complex query joined with other factors, the market is expected to grow in the projected period.
Market Restraining Factors
Problems with data quality and source verification
Inadequate source validation and poor data quality could result in substantial fines for data security violations and a loss of customers, market share, and revenue. Data source validation capabilities, better data quality, and the requirement for highly protected access control, all of which must be configured per the organization's laws and regulations, are prerequisites for using insight engines. Data silos result from the use of unstructured and structured data and the involvement of numerous stakeholders, such as data stewards, custodians, and security teams. As a result, problems with data address quality and validation may severely restrict the market's expansion for insight engines.
Component Outlook
Based on component, the insight engines market is segmented into solution and services. The solution segment dominated the insight engines market with maximum revenue share in 2022. This is because these solutions provide comprehensive performance indicators, including ROI analysis reports. Their main objective is to provide information about customer interactions with websites and applications to identify effective content. The centralized interface of the platform provides simpler overviews and reports. The system integrates with other applications, such as CRMs and POS systems, to provide comprehensive consumer behavior overviews.
Application Outlook
On the basis of application, the insight engines market is divided into search & discovery, customer management, knowledge management, risk & compliance management and other applications. The search & discovery segment procured a substantial revenue share in the insight engines market in 2022. This is due to its capability that enables users to locate, comprehend, and have confidence in the facts they need to make data-driven decisions. Numerous contemporary businesses are based on their ability to use data to make intelligent and timely decisions. Traditional enterprise search, however, has proven incapable of meeting the needs of the modern knowledge worker.
Technology Outlook
By technology, the insight engines market is classified into natural language processing and machine learning. The machine learning segment witnessed the largest revenue share in the insight engines market in 2022. This is due to the fact that using machine learning algorithms, data can be analyzed to identify trends, make predictions, and suggest recommendations. In addition, using machine learning algorithms such as collaborative filtering, clustering, and similarity calculation, insight engines can determine the relevance of search results and match them to search queries, which is further boosting the segment's expansion.
Deployment Type Outlook
Based on the deployment Type, the insight engines market is bifurcated into cloud and on-premises. The on-premises segment procured a prominent revenue share in the insight engines market in 2022. This is due to the fact that during an on-premise deployment, the solution is set up on the servers of a business and protected by a firewall. To use on-premise software, a company must have bought a license or a copy of the application. The software is licensed, and the complete instance is kept on-site at an enterprise, so there is often stronger security than with a cloud computing infrastructure.
Organization Size Outlook
On the basis of organization size, the insight engines market is classified into large enterprises and small and medium enterprises. The large enterprises segment dominated the insight engines market with maximum revenue share in 2022. The growth is attributed to the fact that large businesses are the majority of insight engines' users. Although most businesses are drowning with data, they long for insights. To find and analyze data for digital power efforts, insight engines, which mix machine learning and AI, have experienced tremendous development. These companies have substantial resources to invest in these treatments.
Vertical Outlook
By vertical, the insight engines market is segmented into banking, financial services, & insurance, IT & ITeS, retail & ecommerce, healthcare & life sciences, telecom, manufacturing, government and other verticals. The IT & ITeS segment recorded a significant revenue share in the insight engines market in 2022. This is because building an insights engine for an IT & ITeS business has several benefits, ranging from organization to efficiency. With insights engine, a project's success chances significantly increase. In addition, teams inside a company often operate more efficiently after using an insights engine because it is easier to access historical data and to more clearly see the steps to take to produce the desired results.
Regional Outlook
Region-wise, the insight engines market is analyzed across North America, Europe, Asia Pacific, and LAMEA. The North America region witnessed the largest revenue share in the insight engines market in 2022. This is due to the highest adoption of cutting-edge technologies like chatbots, voice recognition, and natural language processing, in the North America region. The market for insight engines in this area is expanding as a result of a number of causes. These include the development of the IoT, the exponential growth of big data, and the decreased cost of ownership of cloud-based platforms.
The major strategies followed by the market participants are Partnerships. Based on the Analysis presented in the Cardinal matrix; Microsoft Corporation is the forerunner in the Insight Engines Market. Companies such as IBM Corporation, SAP SE, and Oracle Corporation are some of the key innovators in Insight Engines Market.
The market research report covers the analysis of key stake holders of the market. Key companies profiled in the report include Microsoft Corporation, IBM Corporation, OpenText Corporation, SAP SE, Oracle Corporation, Elastic N.V., expert.ai S.p.A., Almawave S.p.A. (Almaviva S.p.A), Mindbreeze GmbH, and Squirro AG.
Recent Strategies Deployed in Insight Engines Market
Mergers and Acquisitions:
Feb-2023: OpenText took over Micro Focus. The acquisition allows OpenText to integrate Micro Focus' offerings with its product portfolio thereby creating better offerings for customers.
Oct-2022: Oracle buys Newmetrix to integrate their AI-powered construction safety suite with Oracle Aconex. The acquisition will aid Oracle in serving its construction customers better.
Jul-2022: SAP took over Askdata, a startup focused on search-driven analytics. The acquisition aids SAP in providing AI-driven search solutions to its customers to help them make better decisions. Askdata acquisition allows SAP to address the needs of a larger array of consumers.
Oct-2021: Elastic took over Optimize. The acquisition allows Elastic to serve its customers in better ways by improving the ability to detect reason in complex distributed environments. The acquisition also allows Elastic to unify the capabilities of both companies into a single search platform namely, Elastic search platform.
Apr-2021: IBM acquires MyInvenio. The acquisition allows IBM to integrate MyInvenio's technology into its Cloud Pak platform. The acquisition serves as a builder of IBM's automation strategy.
Mar-2021: SAP SE has acquired Signavio GmbH, a leader in the enterprise business process intelligence and process management space. The acquisition allows SAP to provide business transformation solutions to their customers including gap analysis, process design, and process change management. This acquisition also places SAP as a leading player in the market.
Partnerships, Collaborations and Agreements:
Nov-2022: Squirro has partnered with Semantic Web Company to create a composite AI platform. The partnership places Squirro as a market leader in predictive AI.
Oct-2022: Oracle has partnered with NVIDIA to integrate NVIDIA AI with Oracle Cloud Infrastructure. The combined capabilities of both companies will serve customers across various industries.
May-2022: Oracle has partnered with Informatica to combine Informatica's governance and data integration with Oracle Cloud Infrastructure (OCI). The combined capabilities of the two companies will benefit the customers by simplifying moving to OCI and providing a common management platform across all the data structures.
Apr-2022: Squirro has entered into a partnership with FPT software to offer end-to-end augmented intelligence solutions. The two companies will combine their capabilities to serve customers across various industries. FPT will integrate Squiro's solutions with its product portfolio. The partnership aids Squirro in strengthening its position and expanding across various markets globally.
Feb-2022: Microsoft has partnered with Teradata to combine Teradata Vantage platform with Microsoft Azure. The partnership aims at enabling the different companies to take data-driven decisions quicker.
Nov-2021: IBM has partnered with NeuReality. The main aim of the partnership is to develop AI interference platforms for delivering power consumption improvements and cost improvements ultimately creating an infrastructure that is more accessible and streamlined.
Oct-2021: IBM has teamed up with Apptio, Inc. to enhance cloud technology decision-making. By combining the expertise of both companies, IBM will be able to design a better offering for their client.
Product Launches and Expansions:
Feb-2023: Microsoft has unveiled a new version of Bing. The new version features GPT 3.5 AI. The new Bing can search queries with the latest information. The updated version also features 'Chat' and 'Compose', Chat feature allows the users to summarize the context, and 'Compose' allows the users to generate the text based on the summary.
Nov-2022: Squirro has launched the 'Allocators Insight' app. The app will be used to assign strategy data to users, The app features Squirro's insight engine. The app provides useful information regarding fluctuations in the market to users when making investment decisions. The app features machine learning and language processing to find the correct information across a large array of data. The app also features dashboards that facilitate automatic tracking of allocators that users wish to monitor.
Feb-2022: OpenText unveils OpenText Insight Predict. Insight prediction displays the best paragraph in a document that facilitates greater efficiency. It also features a contextual diversity algorithm that removes the risk of missing relevant documents.
Geographical Expansions:
Apr-2023: Oracle has opened a second cloud region in Singapore due to increasing demand for its cloud infrastructure. The new facility offers the customers a choice to move their infrastructure for better performance. Customers will also be provided with a broad range of services to innovate with data analytics with AI.
Scope of the Study
Market Segments covered in the Report:
By Technology
- Machine Learning
- Nature Language Processing
By Application
- Customer Management
- Search & Discovery
- Knowledge Management
- Risk & Compliance Management
- Others
By Component
- Solution
- Services
By Deployment Type
- Cloud
- On-premise
By Organization Size
- Large Enterprises
- Small & Medium Enterprises
By Vertical
- BFSI
- IT & ITeS
- Retail & Ecommerce
- Telecom
- Manufacturing
- Healthcare & Lifesciences
- Government
- Others
By Geography
- North America
- US
- Canada
- Mexico
- Rest of North America
- Europe
- Germany
- UK
- France
- Russia
- Spain
- Italy
- Rest of Europe
- Asia Pacific
- China
- Japan
- India
- South Korea
- Singapore
- Malaysia
- Rest of Asia Pacific
- LAMEA
- Brazil
- Argentina
- UAE
- Saudi Arabia
- South Africa
- Nigeria
- Rest of LAMEA
Companies Profiled
- Microsoft Corporation
- IBM Corporation
- OpenText Corporation
- SAP SE
- Oracle Corporation
- Elastic N.V.
- expert.ai S.p.A.
- Almawave S.p.A. (Almaviva S.p.A)
- Mindbreeze GmbH
- Squirro AG
Unique Offerings from KBV Research
- Exhaustive coverage
- Highest number of market tables and figures
- Subscription based model available
- Guaranteed best price
- Assured post sales research support with 10% customization free
Table of Contents
Chapter 1. Market Scope & Methodology
- 1.1 Market Definition
- 1.2 Objectives
- 1.3 Market Scope
- 1.4 Segmentation
- 1.4.1 Global Insight Engines Market, by Technology
- 1.4.2 Global Insight Engines Market, by Application
- 1.4.3 Global Insight Engines Market, by Component
- 1.4.4 Global Insight Engines Market, by Deployment Type
- 1.4.5 Global Insight Engines Market, by Organization Size
- 1.4.6 Global Insight Engines Market, by Vertical
- 1.4.7 Global Insight Engines Market, by Geography
- 1.5 Methodology for the research
Chapter 2. Market Overview
- 2.1 Introduction
- 2.1.1 Overview
- 2.1.1.1 Market composition & scenario
- 2.1.1 Overview
- 2.2 Key Factors Impacting the Market
- 2.2.1 Market Drivers
- 2.2.2 Market Restraints
Chapter 3. Competition Analysis - Global
- 3.1 KBV Cardinal Matrix
- 3.2 Recent Industry Wide Strategic Developments
- 3.2.1 Partnerships, Collaborations and Agreements
- 3.2.2 Product Launches and Product Expansions
- 3.2.3 Acquisition and Mergers
- 3.2.4 Geographical Expansions
- 3.3 Top Winning Strategies
- 3.3.1 Key Leading Strategies: Percentage Distribution (2019-2023)
- 3.3.2 Key Strategic Move: (Partnerships, Collaborations and Agreements : 2020, Nov - 2022, Nov) Leading Players
Chapter 4. Global Insight Engines Market by Technology
- 4.1 Global Machine Learning Market by Region
- 4.2 Global Nature Language Processing Market by Region
Chapter 5. Global Insight Engines Market by Application
- 5.1 Global Customer Management Market by Region
- 5.2 Global Search & Discovery Market by Region
- 5.3 Global Knowledge Management Market by Region
- 5.4 Global Risk & Compliance Management Market by Region
- 5.5 Global Other Application Market by Region
Chapter 6. Global Insight Engines Market by Component
- 6.1 Global Solution Market by Region
- 6.2 Global Services Market by Region
Chapter 7. Global Insight Engines Market by Deployment Type
- 7.1 Global Cloud Market by Region
- 7.2 Global On-premise Market by Region
Chapter 8. Global Insight Engines Market by Organization Size
- 8.1 Global Large Enterprises Market by Region
- 8.2 Global Small & Medium Enterprises Market by Region
Chapter 9. Global Insight Engines Market by Vertical
- 9.1 Global BFSI Market by Region
- 9.2 Global IT & ITeS Market by Region
- 9.3 Global Retail & Ecommerce Market by Region
- 9.4 Global Telecom Market by Region
- 9.5 Global Manufacturing Market by Region
- 9.6 Global Healthcare & Lifesciences Market by Region
- 9.7 Global Government Market by Region
- 9.8 Global Others Market by Region
Chapter 10. Global Insight Engines Market by Region
- 10.1 North America Insight Engines Market
- 10.1.1 North America Insight Engines Market by Technology
- 10.1.1.1 North America Machine Learning Market by Country
- 10.1.1.2 North America Nature Language Processing Market by Country
- 10.1.2 North America Insight Engines Market by Application
- 10.1.2.1 North America Customer Management Market by Country
- 10.1.2.2 North America Search & Discovery Market by Country
- 10.1.2.3 North America Knowledge Management Market by Country
- 10.1.2.4 North America Risk & Compliance Management Market by Country
- 10.1.2.5 North America Other Application Market by Country
- 10.1.3 North America Insight Engines Market by Component
- 10.1.3.1 North America Solution Market by Country
- 10.1.3.2 North America Services Market by Country
- 10.1.4 North America Insight Engines Market by Deployment Type
- 10.1.4.1 North America Cloud Market by Country
- 10.1.4.2 North America On-premise Market by Country
- 10.1.5 North America Insight Engines Market by Organization Size
- 10.1.5.1 North America Large Enterprises Market by Country
- 10.1.5.2 North America Small & Medium Enterprises Market by Country
- 10.1.6 North America Insight Engines Market by Vertical
- 10.1.6.1 North America BFSI Market by Country
- 10.1.6.2 North America IT & ITeS Market by Country
- 10.1.6.3 North America Retail & Ecommerce Market by Country
- 10.1.6.4 North America Telecom Market by Country
- 10.1.6.5 North America Manufacturing Market by Country
- 10.1.6.6 North America Healthcare & Lifesciences Market by Country
- 10.1.6.7 North America Government Market by Country
- 10.1.6.8 North America Others Market by Country
- 10.1.7 North America Insight Engines Market by Country
- 10.1.7.1 US Insight Engines Market
- 10.1.7.1.1 US Insight Engines Market by Technology
- 10.1.7.1.2 US Insight Engines Market by Application
- 10.1.7.1.3 US Insight Engines Market by Component
- 10.1.7.1.4 US Insight Engines Market by Deployment Type
- 10.1.7.1.5 US Insight Engines Market by Organization Size
- 10.1.7.1.6 US Insight Engines Market by Vertical
- 10.1.7.2 Canada Insight Engines Market
- 10.1.7.2.1 Canada Insight Engines Market by Technology
- 10.1.7.2.2 Canada Insight Engines Market by Application
- 10.1.7.2.3 Canada Insight Engines Market by Component
- 10.1.7.2.4 Canada Insight Engines Market by Deployment Type
- 10.1.7.2.5 Canada Insight Engines Market by Organization Size
- 10.1.7.2.6 Canada Insight Engines Market by Vertical
- 10.1.7.3 Mexico Insight Engines Market
- 10.1.7.3.1 Mexico Insight Engines Market by Technology
- 10.1.7.3.2 Mexico Insight Engines Market by Application
- 10.1.7.3.3 Mexico Insight Engines Market by Component
- 10.1.7.3.4 Mexico Insight Engines Market by Deployment Type
- 10.1.7.3.5 Mexico Insight Engines Market by Organization Size
- 10.1.7.3.6 Mexico Insight Engines Market by Vertical
- 10.1.7.4 Rest of North America Insight Engines Market
- 10.1.7.4.1 Rest of North America Insight Engines Market by Technology
- 10.1.7.4.2 Rest of North America Insight Engines Market by Application
- 10.1.7.4.3 Rest of North America Insight Engines Market by Component
- 10.1.7.4.4 Rest of North America Insight Engines Market by Deployment Type
- 10.1.7.4.5 Rest of North America Insight Engines Market by Organization Size
- 10.1.7.4.6 Rest of North America Insight Engines Market by Vertical
- 10.1.7.1 US Insight Engines Market
- 10.1.1 North America Insight Engines Market by Technology
- 10.2 Europe Insight Engines Market
- 10.2.1 Europe Insight Engines Market by Technology
- 10.2.1.1 Europe Machine Learning Market by Country
- 10.2.1.2 Europe Nature Language Processing Market by Country
- 10.2.2 Europe Insight Engines Market by Application
- 10.2.2.1 Europe Customer Management Market by Country
- 10.2.2.2 Europe Search & Discovery Market by Country
- 10.2.2.3 Europe Knowledge Management Market by Country
- 10.2.2.4 Europe Risk & Compliance Management Market by Country
- 10.2.2.5 Europe Other Application Market by Country
- 10.2.3 Europe Insight Engines Market by Component
- 10.2.3.1 Europe Solution Market by Country
- 10.2.3.2 Europe Services Market by Country
- 10.2.4 Europe Insight Engines Market by Deployment Type
- 10.2.4.1 Europe Cloud Market by Country
- 10.2.4.2 Europe On-premise Market by Country
- 10.2.5 Europe Insight Engines Market by Organization Size
- 10.2.5.1 Europe Large Enterprises Market by Country
- 10.2.5.2 Europe Small & Medium Enterprises Market by Country
- 10.2.6 Europe Insight Engines Market by Vertical
- 10.2.6.1 Europe BFSI Market by Country
- 10.2.6.2 Europe IT & ITeS Market by Country
- 10.2.6.3 Europe Retail & Ecommerce Market by Country
- 10.2.6.4 Europe Telecom Market by Country
- 10.2.6.5 Europe Manufacturing Market by Country
- 10.2.6.6 Europe Healthcare & Lifesciences Market by Country
- 10.2.6.7 Europe Government Market by Country
- 10.2.6.8 Europe Others Market by Country
- 10.2.7 Europe Insight Engines Market by Country
- 10.2.7.1 Germany Insight Engines Market
- 10.2.7.1.1 Germany Insight Engines Market by Technology
- 10.2.7.1.2 Germany Insight Engines Market by Application
- 10.2.7.1.3 Germany Insight Engines Market by Component
- 10.2.7.1.4 Germany Insight Engines Market by Deployment Type
- 10.2.7.1.5 Germany Insight Engines Market by Organization Size
- 10.2.7.1.6 Germany Insight Engines Market by Vertical
- 10.2.7.2 UK Insight Engines Market
- 10.2.7.2.1 UK Insight Engines Market by Technology
- 10.2.7.2.2 UK Insight Engines Market by Application
- 10.2.7.2.3 UK Insight Engines Market by Component
- 10.2.7.2.4 UK Insight Engines Market by Deployment Type
- 10.2.7.2.5 UK Insight Engines Market by Organization Size
- 10.2.7.2.6 UK Insight Engines Market by Vertical
- 10.2.7.3 France Insight Engines Market
- 10.2.7.3.1 France Insight Engines Market by Technology
- 10.2.7.3.2 France Insight Engines Market by Application
- 10.2.7.3.3 France Insight Engines Market by Component
- 10.2.7.3.4 France Insight Engines Market by Deployment Type
- 10.2.7.3.5 France Insight Engines Market by Organization Size
- 10.2.7.3.6 France Insight Engines Market by Vertical
- 10.2.7.4 Russia Insight Engines Market
- 10.2.7.4.1 Russia Insight Engines Market by Technology
- 10.2.7.4.2 Russia Insight Engines Market by Application
- 10.2.7.4.3 Russia Insight Engines Market by Component
- 10.2.7.4.4 Russia Insight Engines Market by Deployment Type
- 10.2.7.4.5 Russia Insight Engines Market by Organization Size
- 10.2.7.4.6 Russia Insight Engines Market by Vertical
- 10.2.7.5 Spain Insight Engines Market
- 10.2.7.5.1 Spain Insight Engines Market by Technology
- 10.2.7.5.2 Spain Insight Engines Market by Application
- 10.2.7.5.3 Spain Insight Engines Market by Component
- 10.2.7.5.4 Spain Insight Engines Market by Deployment Type
- 10.2.7.5.5 Spain Insight Engines Market by Organization Size
- 10.2.7.5.6 Spain Insight Engines Market by Vertical
- 10.2.7.6 Italy Insight Engines Market
- 10.2.7.6.1 Italy Insight Engines Market by Technology
- 10.2.7.6.2 Italy Insight Engines Market by Application
- 10.2.7.6.3 Italy Insight Engines Market by Component
- 10.2.7.6.4 Italy Insight Engines Market by Deployment Type
- 10.2.7.6.5 Italy Insight Engines Market by Organization Size
- 10.2.7.6.6 Italy Insight Engines Market by Vertical
- 10.2.7.7 Rest of Europe Insight Engines Market
- 10.2.7.7.1 Rest of Europe Insight Engines Market by Technology
- 10.2.7.7.2 Rest of Europe Insight Engines Market by Application
- 10.2.7.7.3 Rest of Europe Insight Engines Market by Component
- 10.2.7.7.4 Rest of Europe Insight Engines Market by Deployment Type
- 10.2.7.7.5 Rest of Europe Insight Engines Market by Organization Size
- 10.2.7.7.6 Rest of Europe Insight Engines Market by Vertical
- 10.2.7.1 Germany Insight Engines Market
- 10.2.1 Europe Insight Engines Market by Technology
- 10.3 Asia Pacific Insight Engines Market
- 10.3.1 Asia Pacific Insight Engines Market by Technology
- 10.3.1.1 Asia Pacific Machine Learning Market by Country
- 10.3.1.2 Asia Pacific Nature Language Processing Market by Country
- 10.3.2 Asia Pacific Insight Engines Market by Application
- 10.3.2.1 Asia Pacific Customer Management Market by Country
- 10.3.2.2 Asia Pacific Search & Discovery Market by Country
- 10.3.2.3 Asia Pacific Knowledge Management Market by Country
- 10.3.2.4 Asia Pacific Risk & Compliance Management Market by Country
- 10.3.2.5 Asia Pacific Other Application Market by Country
- 10.3.3 Asia Pacific Insight Engines Market by Component
- 10.3.3.1 Asia Pacific Solution Market by Country
- 10.3.3.2 Asia Pacific Services Market by Country
- 10.3.4 Asia Pacific Insight Engines Market by Deployment Type
- 10.3.4.1 Asia Pacific Cloud Market by Country
- 10.3.4.2 Asia Pacific On-premise Market by Country
- 10.3.5 Asia Pacific Insight Engines Market by Organization Size
- 10.3.5.1 Asia Pacific Large Enterprises Market by Country
- 10.3.5.2 Asia Pacific Small & Medium Enterprises Market by Country
- 10.3.6 Asia Pacific Insight Engines Market by Vertical
- 10.3.6.1 Asia Pacific BFSI Market by Country
- 10.3.6.2 Asia Pacific IT & ITeS Market by Country
- 10.3.6.3 Asia Pacific Retail & Ecommerce Market by Country
- 10.3.6.4 Asia Pacific Telecom Market by Country
- 10.3.6.5 Asia Pacific Manufacturing Market by Country
- 10.3.6.6 Asia Pacific Healthcare & Lifesciences Market by Country
- 10.3.6.7 Asia Pacific Government Market by Country
- 10.3.6.8 Asia Pacific Others Market by Country
- 10.3.7 Asia Pacific Insight Engines Market by Country
- 10.3.7.1 China Insight Engines Market
- 10.3.7.1.1 China Insight Engines Market by Technology
- 10.3.7.1.2 China Insight Engines Market by Application
- 10.3.7.1.3 China Insight Engines Market by Component
- 10.3.7.1.4 China Insight Engines Market by Deployment Type
- 10.3.7.1.5 China Insight Engines Market by Organization Size
- 10.3.7.1.6 China Insight Engines Market by Vertical
- 10.3.7.2 Japan Insight Engines Market
- 10.3.7.2.1 Japan Insight Engines Market by Technology
- 10.3.7.2.2 Japan Insight Engines Market by Application
- 10.3.7.2.3 Japan Insight Engines Market by Component
- 10.3.7.2.4 Japan Insight Engines Market by Deployment Type
- 10.3.7.2.5 Japan Insight Engines Market by Organization Size
- 10.3.7.2.6 Japan Insight Engines Market by Vertical
- 10.3.7.3 India Insight Engines Market
- 10.3.7.3.1 India Insight Engines Market by Technology
- 10.3.7.3.2 India Insight Engines Market by Application
- 10.3.7.3.3 India Insight Engines Market by Component
- 10.3.7.3.4 India Insight Engines Market by Deployment Type
- 10.3.7.3.5 India Insight Engines Market by Organization Size
- 10.3.7.3.6 India Insight Engines Market by Vertical
- 10.3.7.4 South Korea Insight Engines Market
- 10.3.7.4.1 South Korea Insight Engines Market by Technology
- 10.3.7.4.2 South Korea Insight Engines Market by Application
- 10.3.7.4.3 South Korea Insight Engines Market by Component
- 10.3.7.4.4 South Korea Insight Engines Market by Deployment Type
- 10.3.7.4.5 South Korea Insight Engines Market by Organization Size
- 10.3.7.4.6 South Korea Insight Engines Market by Vertical
- 10.3.7.5 Singapore Insight Engines Market
- 10.3.7.5.1 Singapore Insight Engines Market by Technology
- 10.3.7.5.2 Singapore Insight Engines Market by Application
- 10.3.7.5.3 Singapore Insight Engines Market by Component
- 10.3.7.5.4 Singapore Insight Engines Market by Deployment Type
- 10.3.7.5.5 Singapore Insight Engines Market by Organization Size
- 10.3.7.5.6 Singapore Insight Engines Market by Vertical
- 10.3.7.6 Malaysia Insight Engines Market
- 10.3.7.6.1 Malaysia Insight Engines Market by Technology
- 10.3.7.6.2 Malaysia Insight Engines Market by Application
- 10.3.7.6.3 Malaysia Insight Engines Market by Component
- 10.3.7.6.4 Malaysia Insight Engines Market by Deployment Type
- 10.3.7.6.5 Malaysia Insight Engines Market by Organization Size
- 10.3.7.6.6 Malaysia Insight Engines Market by Vertical
- 10.3.7.7 Rest of Asia Pacific Insight Engines Market
- 10.3.7.7.1 Rest of Asia Pacific Insight Engines Market by Technology
- 10.3.7.7.2 Rest of Asia Pacific Insight Engines Market by Application
- 10.3.7.7.3 Rest of Asia Pacific Insight Engines Market by Component
- 10.3.7.7.4 Rest of Asia Pacific Insight Engines Market by Deployment Type
- 10.3.7.7.5 Rest of Asia Pacific Insight Engines Market by Organization Size
- 10.3.7.7.6 Rest of Asia Pacific Insight Engines Market by Vertical
- 10.3.7.1 China Insight Engines Market
- 10.3.1 Asia Pacific Insight Engines Market by Technology
- 10.4 LAMEA Insight Engines Market
- 10.4.1 LAMEA Insight Engines Market by Technology
- 10.4.1.1 LAMEA Machine Learning Market by Country
- 10.4.1.2 LAMEA Nature Language Processing Market by Country
- 10.4.2 LAMEA Insight Engines Market by Application
- 10.4.2.1 LAMEA Customer Management Market by Country
- 10.4.2.2 LAMEA Search & Discovery Market by Country
- 10.4.2.3 LAMEA Knowledge Management Market by Country
- 10.4.2.4 LAMEA Risk & Compliance Management Market by Country
- 10.4.2.5 LAMEA Other Application Market by Country
- 10.4.3 LAMEA Insight Engines Market by Component
- 10.4.3.1 LAMEA Solution Market by Country
- 10.4.3.2 LAMEA Services Market by Country
- 10.4.4 LAMEA Insight Engines Market by Deployment Type
- 10.4.4.1 LAMEA Cloud Market by Country
- 10.4.4.2 LAMEA On-premise Market by Country
- 10.4.5 LAMEA Insight Engines Market by Organization Size
- 10.4.5.1 LAMEA Large Enterprises Market by Country
- 10.4.5.2 LAMEA Small & Medium Enterprises Market by Country
- 10.4.6 LAMEA Insight Engines Market by Vertical
- 10.4.6.1 LAMEA BFSI Market by Country
- 10.4.6.2 LAMEA IT & ITeS Market by Country
- 10.4.6.3 LAMEA Retail & Ecommerce Market by Country
- 10.4.6.4 LAMEA Telecom Market by Country
- 10.4.6.5 LAMEA Manufacturing Market by Country
- 10.4.6.6 LAMEA Healthcare & Lifesciences Market by Country
- 10.4.6.7 LAMEA Government Market by Country
- 10.4.6.8 LAMEA Others Market by Country
- 10.4.7 LAMEA Insight Engines Market by Country
- 10.4.7.1 Brazil Insight Engines Market
- 10.4.7.1.1 Brazil Insight Engines Market by Technology
- 10.4.7.1.2 Brazil Insight Engines Market by Application
- 10.4.7.1.3 Brazil Insight Engines Market by Component
- 10.4.7.1.4 Brazil Insight Engines Market by Deployment Type
- 10.4.7.1.5 Brazil Insight Engines Market by Organization Size
- 10.4.7.1.6 Brazil Insight Engines Market by Vertical
- 10.4.7.2 Argentina Insight Engines Market
- 10.4.7.2.1 Argentina Insight Engines Market by Technology
- 10.4.7.2.2 Argentina Insight Engines Market by Application
- 10.4.7.2.3 Argentina Insight Engines Market by Component
- 10.4.7.2.4 Argentina Insight Engines Market by Deployment Type
- 10.4.7.2.5 Argentina Insight Engines Market by Organization Size
- 10.4.7.2.6 Argentina Insight Engines Market by Vertical
- 10.4.7.3 UAE Insight Engines Market
- 10.4.7.3.1 UAE Insight Engines Market by Technology
- 10.4.7.3.2 UAE Insight Engines Market by Application
- 10.4.7.3.3 UAE Insight Engines Market by Component
- 10.4.7.3.4 UAE Insight Engines Market by Deployment Type
- 10.4.7.3.5 UAE Insight Engines Market by Organization Size
- 10.4.7.3.6 UAE Insight Engines Market by Vertical
- 10.4.7.4 Saudi Arabia Insight Engines Market
- 10.4.7.4.1 Saudi Arabia Insight Engines Market by Technology
- 10.4.7.4.2 Saudi Arabia Insight Engines Market by Application
- 10.4.7.4.3 Saudi Arabia Insight Engines Market by Component
- 10.4.7.4.4 Saudi Arabia Insight Engines Market by Deployment Type
- 10.4.7.4.5 Saudi Arabia Insight Engines Market by Organization Size
- 10.4.7.4.6 Saudi Arabia Insight Engines Market by Vertical
- 10.4.7.5 South Africa Insight Engines Market
- 10.4.7.5.1 South Africa Insight Engines Market by Technology
- 10.4.7.5.2 South Africa Insight Engines Market by Application
- 10.4.7.5.3 South Africa Insight Engines Market by Component
- 10.4.7.5.4 South Africa Insight Engines Market by Deployment Type
- 10.4.7.5.5 South Africa Insight Engines Market by Organization Size
- 10.4.7.5.6 South Africa Insight Engines Market by Vertical
- 10.4.7.6 Nigeria Insight Engines Market
- 10.4.7.6.1 Nigeria Insight Engines Market by Technology
- 10.4.7.6.2 Nigeria Insight Engines Market by Application
- 10.4.7.6.3 Nigeria Insight Engines Market by Component
- 10.4.7.6.4 Nigeria Insight Engines Market by Deployment Type
- 10.4.7.6.5 Nigeria Insight Engines Market by Organization Size
- 10.4.7.6.6 Nigeria Insight Engines Market by Vertical
- 10.4.7.7 Rest of LAMEA Insight Engines Market
- 10.4.7.7.1 Rest of LAMEA Insight Engines Market by Technology
- 10.4.7.7.2 Rest of LAMEA Insight Engines Market by Application
- 10.4.7.7.3 Rest of LAMEA Insight Engines Market by Component
- 10.4.7.7.4 Rest of LAMEA Insight Engines Market by Deployment Type
- 10.4.7.7.5 Rest of LAMEA Insight Engines Market by Organization Size
- 10.4.7.7.6 Rest of LAMEA Insight Engines Market by Vertical
- 10.4.7.1 Brazil Insight Engines Market
- 10.4.1 LAMEA Insight Engines Market by Technology
Chapter 11. Company Profiles
- 11.1 IBM Corporation
- 11.1.1 Company Overview
- 11.1.2 Financial Analysis
- 11.1.3 Regional & Segmental Analysis
- 11.1.4 Research & Development Expenses
- 11.1.5 Recent strategies and developments:
- 11.1.5.1 Partnerships, Collaborations, and Agreements:
- 11.1.5.2 Product Launches and Product Expansions:
- 11.1.5.3 Acquisition and Mergers:
- 11.1.6 SWOT Analysis
- 11.2 Oracle Corporation
- 11.2.1 Company Overview
- 11.2.2 Financial Analysis
- 11.2.3 Segmental and Regional Analysis
- 11.2.4 Research & Development Expense
- 11.2.5 Recent strategies and developments:
- 11.2.5.1 Partnerships, Collaborations, and Agreements:
- 11.2.5.2 Acquisition and Mergers:
- 11.2.5.3 Geographical Expansions:
- 11.2.6 SWOT Analysis
- 11.3 SAP SE
- 11.3.1 Company Overview
- 11.3.2 Financial Analysis
- 11.3.3 Segmental and Regional Analysis
- 11.3.4 Research & Development Expense
- 11.3.5 Recent strategies and developments:
- 11.3.5.1 Partnerships, Collaborations, and Agreements:
- 11.3.5.2 Acquisition and Mergers:
- 11.3.6 SWOT Analysis
- 11.4 Microsoft Corporation
- 11.4.1 Company Overview
- 11.4.2 Financial Analysis
- 11.4.3 Segmental and Regional Analysis
- 11.4.4 Recent strategies and developments:
- 11.4.4.1 Partnerships, Collaborations, and Agreements:
- 11.4.4.2 Product Launches and Product Expansions:
- 11.4.5 SWOT Analysis
- 11.5 OpenText Corporation
- 11.5.1 Company Overview
- 11.5.2 Financial Analysis
- 11.5.3 Product Type and Regional Analysis
- 11.5.4 Research & Development Expense
- 11.5.5 Recent strategies and developments:
- 11.5.5.1 Product Launches and Product Expansions:
- 11.5.5.2 Acquisition and Mergers:
- 11.5.6 SWOT Analysis
- 11.6 Elastic N.V.
- 11.6.1 Company Overview
- 11.6.2 Financial Analysis
- 11.6.3 Regional Analysis
- 11.6.4 Research & Development Expenses
- 11.6.5 Recent strategies and developments:
- 11.6.5.1 Product Launches and Product Expansions:
- 11.6.5.2 Acquisition and Mergers:
- 11.7 expert.ai S.p.A.
- 11.7.1 Company Overview
- 11.7.2 Financial Analysis
- 11.7.3 Regional Analysis
- 11.7.4 Research & Development Expenses
- 11.8 Almawave S.p.A. (Almaviva S.p.A)
- 11.8.1 Company Overview
- 11.8.2 Financial Analysis
- 11.9 Mindbreeze GmbH (Fabasoft AG)
- 11.9.1 Company Overview
- 11.9.2 Financial Analysis
- 11.9.3 Regional Analysis
- 11.9.4 Research & Development Expense
- 11.10. Squirro AG
- 11.10.1 Company Overview
- 11.10.2 Recent strategies and developments:
- 11.10.2.1 Partnerships, Collaborations, and Agreements:
- 11.10.2.2 Product Launches and Product Expansions: