|
|
市場調査レポート
商品コード
1245727
マーケティングアトリビューションソフトウェアの世界市場規模、シェア、産業動向分析レポート:コンポーネント別、タイプ別、展開モード別、組織規模別、業種別、地域別展望と予測、2022年~2028年Global Marketing Attribution Software Market Size, Share & Industry Trends Analysis Report By Component, By Type, By Deployment Mode, By Organization Size, By Vertical, By Regional Outlook and Forecast, 2022 - 2028 |
||||||
|
|
|||||||


| マーケティングアトリビューションソフトウェアの世界市場規模、シェア、産業動向分析レポート:コンポーネント別、タイプ別、展開モード別、組織規模別、業種別、地域別展望と予測、2022年~2028年 |
|
出版日: 2023年02月28日
発行: KBV Research
ページ情報: 英文 315 Pages
納期: 即納可能
|
- 全表示
- 概要
- 図表
- 目次
マーケティングアトリビューションソフトウェアの世界市場規模は、2028年までに72億米ドルに達すると予測され、予測期間中に13.7%のCAGRで市場成長するとされています。
マーケティングチームは、効果的なアトリビューションに必要なデータの粒度を達成するために、膨大なデータを正確かつ迅速に、キャンペーン中の調整に適用できる個人レベルのインサイトに変換できる最先端の分析ソリューションを必要としています。マーケティングのアトリビューションは、データの種類やタッチポイントの数が非常に多いため、より重要です。さらに、分析ツールはさまざまなソースから情報を引き出すことができるため、このアトリビューションから得られる教訓は、ビジネスのマーケティング・パフォーマンスとオーディエンスの習慣を完全に把握することができます。例えば、マーケティングのタッチポイントを評価する場合、分析システムによっては、資産の種類、露出順序、デバイスの種類を考慮することができます。
COVID-19影響度分析
COVID-19のパンデミックは、世界中の企業に大きな影響を与えました。多くの政府によって課されたロックダウンは、マーケティングアトリビューションソフトウェアを採用することで恩恵を受けた。企業はCOVID-19事件後、AIを搭載したソリューション、クラウドコンピューティング、自動化などの技術開発に集中しています。また、顧客体験を向上させる戦略としてパーソナライズドマーケティングの人気が拡大しているため、企業はマーケティングアトリビューションソフトウェアに多くの費用を投じています。また、マーケティング予算の管理、マーケティングチャネルやキャンペーンの効率性の評価など、いくつかのメリットを企業に提供しています。
市場の成長要因
クラウドベースのサービスやソリューションの受容が進んでいる
企業の大半は、複数の環境にリソースを分散させ、クラウドベースの戦略を取り入れています。その結果、クラウドベースのマーケティングアトリビューションソリューションは、その適応性、拡張性、低コストにより、人気が高まっています。また、複数の場所で作成されたデータを一元的に評価したり、多様なアプリケーションやプラットフォームからデータを取得することができるため、データの収集や分析が容易になります。さらに、毎日何十億ものイベントを追跡し、機械学習によって視聴と購買を結びつけ、クライアントや社内のチームに対して結果を可視化することも可能です。
ターゲティングマーケティングのための顧客行動モニタリング
デジタルマーケティングという未知の領域に挑み続ける企業にとって、デバイスをまたいだユーザー行動を考慮することは不可欠です。広告主は、データを分析し、デバイスをまたいだアトリビューションを実現し、効果的な広告戦略を立案することが求められます。このような購買ジャーニーの変化により、商品の認知から始まり、購入検討、商品へのロイヤリティ、そして商品アドボカシーに至るまで、デジタル消費者の経路を正確にアトリビューションすることが求められています。
市場の抑制要因
プライバシーやセキュリティに関する懸念
SMAC技術の利用が増えるにつれ、企業は侵害を防ぐために、より厳格なセキュリティとプライバシー対策を必要としており、適切に対処しなければ、デジタル化の成功に悪影響を及ぼす可能性があります。顧客データの量が増えるにつれて、セキュリティ&プライバシーに関する懸念も増え、ハッカーの攻撃に対してますます脆弱になっています。データのプライバシーとセキュリティは、十分に対処しなければならない重要な懸念事項です。クラウドベースのマーケティングオートメーションソフトウェアでは、アカウントの乗っ取り、内部脅威、安全でないAPI(Application Programming Interfaces)、マルウェアの注入、共有の脆弱性、データ損失などのセキュリティ上の懸念がより一般的になっています。
タイプアウトルック
タイプに基づき、マーケティングアトリビューションソフトウェア市場は、マルチソースアトリビューション、確率的またはアルゴリズムアトリビューション、およびシングルソースアトリビューションに区分されます。確率的またはアルゴリズムによるアトリビューションセグメントは、2021年のマーケティングアトリビューションソフトウェア市場においてかなりの収益シェアを占めています。このセグメントの増加は、確率的またはアルゴリズムによるアトリビューションモデルが、消費者の旅行を分析し、変換し、失格にする能力を持つことと関連づけることができます。また、カスタマージャーニーのさまざまなタッチポイントにおいて、どのマーケティングチャネルが最も大きな影響と重要性を持つかを判断するのに役立ちます。
組織規模の見通し
組織規模別では、マーケティングアトリビューションソフトウェア市場は、大企業と中小企業に二分されます。2021年のマーケティングアトリビューションソフトウェア市場では、中小企業セグメントがかなりの収益シェアを獲得しています。このセグメントの成長は、デジタルSMEマーケティングへの取り組みを含む政府プログラムの数が世界的に増加していることに起因していると考えられます。
業界別の展望
業種別では、マーケティングアトリビューションソフトウェア市場は、消費財・小売、IT・通信、BFSI、メディア・エンターテイメント、ヘルスケア、旅行・ホスピタリティ、その他に分類されます。2021年、旅行&ホスピタリティセグメントは、マーケティングアトリビューションソフトウェア市場で有望な成長率を調達しました。アトリビューションにより、ホテルブランドはソーシャルイニシアチブのリーチの価値を確立し、この分野への投資が宿泊や収益に関する適切なリターンをもたらすかどうかを確認することができます。さらに、ホテルのマーケティング担当者は、さまざまなネットワークにおけるさまざまなタイプのソーシャル投資や個々のキャンペーンが、根本的に異なるROI特性を持つことを理解することができます。
コンポーネントの展望
コンポーネントに基づいて、マーケティングアトリビューションソフトウェア市場は、ソリューションとサービスに細分化されます。2021年には、ソリューションセグメントがマーケティングアトリビューションソフトウェア市場において最大の収益シェアを獲得しました。企業は、マーケティングにマルチチャネル戦略を採用し、ファネルの各レベルに特化したマーケティングキャンペーンを頻繁に作成します。マーケティングアトリビューションは、デジタルキャンペーンへの支出が業績に与える影響を定量化するモデルです。企業を支援するために、マーケティング属性評価ソリューションは、企業にとっての価値に応じてチャネルを評価します。また、マーケティング・チャネルを理解することもできます。
展開モードの展望
市場アトリビューションソフトウェア市場は、導入形態によってオンプレミスとクラウドに分類されます。これは、高いレベルのデータ保護と安全性を含む、オンプレミスの展開に伴う多くの利点に起因しています。オンプレミス型はクラウドベース型に比べてデータセキュリティが高く、データ漏洩も少ないため、業界ではオンプレミス型が好まれ、オンプレミス型に対する業界の需要が高まっています。
地域別展望
地域別に見ると、マーケティングアトリビューションソフトウェア市場は、北米、欧州、アジア太平洋、LAMEAで分析されています。2021年、北米地域は最大の収益シェアを獲得し、マーケティングアトリビューションソフトウェア市場をリードしました。BFSI、観光、ヘルスケア、その他の業界では、組織と顧客体験を強化するために、マーケティングアトリビューションソフトウェアソリューションの活用頻度が高まっています。北米のマーケティングアトリビューションソフトウェア市場は、このような有利な成長ポテンシャルから恩恵を受けると予想されます。
目次
第1章 市場の範囲と調査手法
- 市場の定義
- 目的
- 市場の範囲
- セグメンテーション
- マーケティングアトリビューションソフトウェアの世界市場、構成要素別
- マーケティングアトリビューションソフトウェアの世界市場、タイプ別
- マーケティングアトリビューションソフトウェアの世界市場、展開モード別
- マーケティングアトリビューションソフトウェアの世界市場:組織規模別
- マーケティングアトリビューションソフトウェアの世界市場:業界別
- マーケティングアトリビューションソフトウェアの世界市場、地域別
- 調査手法
第2章 市場の概要
- イントロダクションです
- 概要
- 市場の構成とシナリオ
- 概要
- 市場に影響を与える主な要因
- 市場促進要因
- 市場抑制要因
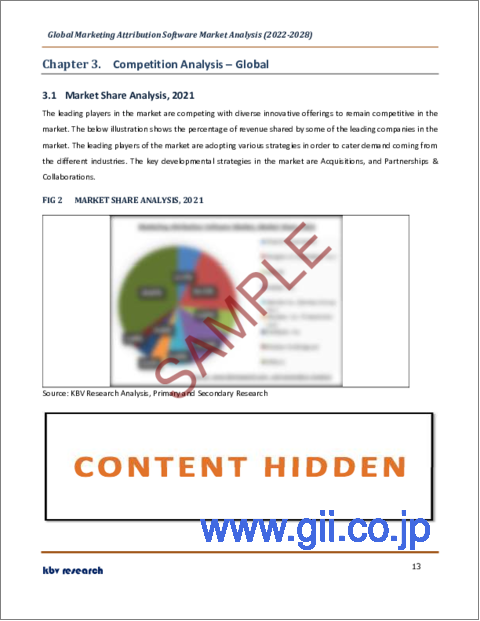
第3章 競合分析-世界
- 市場シェア分析、2021年
第4章 マーケティングアトリビューションソフトウェアの世界市場:コンポーネント別
- ソリューションの世界市場:地域別
- サービスの世界市場:地域別
第5章 マーケティングアトリビューションソフトウェアの世界市場:タイプ別
- マルチソース型アトリビューションの世界市場:地域別
- 確率的またはアルゴリズム別アトリビューションの世界市場:地域別
- 世界のシングルソース帰属市場:地域別
第6章 マーケティングアトリビューションソフトウェアの世界市場:デプロイメントモード別
- オンプレミスの世界市場:地域別
- 世界のクラウド市場:地域別
第7章 マーケティングアトリビューションソフトウェアの世界市場:組織規模別
- 大企業の世界市場:地域別
- 世界の中小企業市場:地域別
第8章 マーケティングアトリビューションソフトウェアの世界市場:業界別市場
- 消費財・小売の世界市場:地域別
- BFSIの世界市場:地域別
- テレコム・ITの世界市場:地域別
- ヘルスケアの世界市場:地域別
- 旅行・ホスピタリティの世界市場:地域別
- メディア&エンターテインメントの世界市場:地域別
- 世界の地域別その他市場
第9章 マーケティングアトリビューションソフトウェアの世界市場:地域別
- 北米
- 北米マーケティングアトリビューションソフトウェア市場:国別内訳
- 米国
- カナダ
- メキシコ
- その他北米地域
- 北米マーケティングアトリビューションソフトウェア市場:国別内訳
- 欧州
- 欧州マーケティングアトリビューションソフトウェア市場:国別
- ドイツ
- 英国
- フランス
- ロシア
- スペイン
- イタリア
- その他欧州
- 欧州マーケティングアトリビューションソフトウェア市場:国別
- アジア太平洋地域
- アジア太平洋地域のマーケティングアトリビューションソフトウェア市場:国別
- 中国
- 日本
- インド
- 韓国
- シンガポール
- マレーシア
- その他アジア太平洋地域
- アジア太平洋地域のマーケティングアトリビューションソフトウェア市場:国別
- LAMEA
- LAMEAマーケティングアトリビューションソフトウェア市場:国別
- ブラジル
- アルゼンチン
- UAE
- サウジアラビア
- 南アフリカ
- ナイジェリア
- LAMEAの残りの地域
- LAMEAマーケティングアトリビューションソフトウェア市場:国別
第10章 企業プロファイル
- Oracle Corporation
- Google LLC(Alphabet, Inc.)
- SAP SE
- Adobe, Inc.
- Merkle Inc.(Dentsu Group Inc.)
- Neustar, Inc.(TransUnion LLC)
- HubSpot, Inc.
- Nielsen Holdings plc(Elliott Investment Management L.P.)
- Ruler Analytics Limited
- Windsor Group AG
LIST OF TABLES
- TABLE 1 Global Marketing Attribution Software Market, 2018 - 2021, USD Million
- TABLE 2 Global Marketing Attribution Software Market, 2022 - 2028, USD Million
- TABLE 3 Global Marketing Attribution Software Market by Component, 2018 - 2021, USD Million
- TABLE 4 Global Marketing Attribution Software Market by Component, 2022 - 2028, USD Million
- TABLE 5 Global Solution Market by Region, 2018 - 2021, USD Million
- TABLE 6 Global Solution Market by Region, 2022 - 2028, USD Million
- TABLE 7 Global Services Market by Region, 2018 - 2021, USD Million
- TABLE 8 Global Services Market by Region, 2022 - 2028, USD Million
- TABLE 9 Global Marketing Attribution Software Market by Type, 2018 - 2021, USD Million
- TABLE 10 Global Marketing Attribution Software Market by Type, 2022 - 2028, USD Million
- TABLE 11 Global Multi-source Attribution Market by Region, 2018 - 2021, USD Million
- TABLE 12 Global Multi-source Attribution Market by Region, 2022 - 2028, USD Million
- TABLE 13 Global Probabilistic or Algorithmic Attribution Market by Region, 2018 - 2021, USD Million
- TABLE 14 Global Probabilistic or Algorithmic Attribution Market by Region, 2022 - 2028, USD Million
- TABLE 15 Global Single-source Attribution Market by Region, 2018 - 2021, USD Million
- TABLE 16 Global Single-source Attribution Market by Region, 2022 - 2028, USD Million
- TABLE 17 Global Marketing Attribution Software Market by Deployment Mode, 2018 - 2021, USD Million
- TABLE 18 Global Marketing Attribution Software Market by Deployment Mode, 2022 - 2028, USD Million
- TABLE 19 Global On-premises Market by Region, 2018 - 2021, USD Million
- TABLE 20 Global On-premises Market by Region, 2022 - 2028, USD Million
- TABLE 21 Global Cloud Market by Region, 2018 - 2021, USD Million
- TABLE 22 Global Cloud Market by Region, 2022 - 2028, USD Million
- TABLE 23 Global Marketing Attribution Software Market by Organization Size, 2018 - 2021, USD Million
- TABLE 24 Global Marketing Attribution Software Market by Organization Size, 2022 - 2028, USD Million
- TABLE 25 Global Large Enterprises Market by Region, 2018 - 2021, USD Million
- TABLE 26 Global Large Enterprises Market by Region, 2022 - 2028, USD Million
- TABLE 27 Global Small & Medium Enterprises (SMEs) Market by Region, 2018 - 2021, USD Million
- TABLE 28 Global Small & Medium Enterprises (SMEs) Market by Region, 2022 - 2028, USD Million
- TABLE 29 Global Marketing Attribution Software Market by Vertical, 2018 - 2021, USD Million
- TABLE 30 Global Marketing Attribution Software Market by Vertical, 2022 - 2028, USD Million
- TABLE 31 Global Consumer Goods & Retail Market by Region, 2018 - 2021, USD Million
- TABLE 32 Global Consumer Goods & Retail Market by Region, 2022 - 2028, USD Million
- TABLE 33 Global BFSI Market by Region, 2018 - 2021, USD Million
- TABLE 34 Global BFSI Market by Region, 2022 - 2028, USD Million
- TABLE 35 Global Telecom & IT Market by Region, 2018 - 2021, USD Million
- TABLE 36 Global Telecom & IT Market by Region, 2022 - 2028, USD Million
- TABLE 37 Global Healthcare Market by Region, 2018 - 2021, USD Million
- TABLE 38 Global Healthcare Market by Region, 2022 - 2028, USD Million
- TABLE 39 Global Travel & Hospitality Market by Region, 2018 - 2021, USD Million
- TABLE 40 Global Travel & Hospitality Market by Region, 2022 - 2028, USD Million
- TABLE 41 Global Media & Entertainment Market by Region, 2018 - 2021, USD Million
- TABLE 42 Global Media & Entertainment Market by Region, 2022 - 2028, USD Million
- TABLE 43 Global Others Market by Region, 2018 - 2021, USD Million
- TABLE 44 Global Others Market by Region, 2022 - 2028, USD Million
- TABLE 45 Global Marketing Attribution Software Market by Region, 2018 - 2021, USD Million
- TABLE 46 Global Marketing Attribution Software Market by Region, 2022 - 2028, USD Million
- TABLE 47 North America Marketing Attribution Software Market, 2018 - 2021, USD Million
- TABLE 48 North America Marketing Attribution Software Market, 2022 - 2028, USD Million
- TABLE 49 North America Marketing Attribution Software Market by Component, 2018 - 2021, USD Million
- TABLE 50 North America Marketing Attribution Software Market by Component, 2022 - 2028, USD Million
- TABLE 51 North America Solution Market by Country, 2018 - 2021, USD Million
- TABLE 52 North America Solution Market by Country, 2022 - 2028, USD Million
- TABLE 53 North America Services Market by Country, 2018 - 2021, USD Million
- TABLE 54 North America Services Market by Country, 2022 - 2028, USD Million
- TABLE 55 North America Marketing Attribution Software Market by Type, 2018 - 2021, USD Million
- TABLE 56 North America Marketing Attribution Software Market by Type, 2022 - 2028, USD Million
- TABLE 57 North America Multi-source Attribution Market by Country, 2018 - 2021, USD Million
- TABLE 58 North America Multi-source Attribution Market by Country, 2022 - 2028, USD Million
- TABLE 59 North America Probabilistic or Algorithmic Attribution Market by Country, 2018 - 2021, USD Million
- TABLE 60 North America Probabilistic or Algorithmic Attribution Market by Country, 2022 - 2028, USD Million
- TABLE 61 North America Single-source Attribution Market by Country, 2018 - 2021, USD Million
- TABLE 62 North America Single-source Attribution Market by Country, 2022 - 2028, USD Million
- TABLE 63 North America Marketing Attribution Software Market by Deployment Mode, 2018 - 2021, USD Million
- TABLE 64 North America Marketing Attribution Software Market by Deployment Mode, 2022 - 2028, USD Million
- TABLE 65 North America On-premises Market by Country, 2018 - 2021, USD Million
- TABLE 66 North America On-premises Market by Country, 2022 - 2028, USD Million
- TABLE 67 North America Cloud Market by Country, 2018 - 2021, USD Million
- TABLE 68 North America Cloud Market by Country, 2022 - 2028, USD Million
- TABLE 69 North America Marketing Attribution Software Market by Organization Size, 2018 - 2021, USD Million
- TABLE 70 North America Marketing Attribution Software Market by Organization Size, 2022 - 2028, USD Million
- TABLE 71 North America Large Enterprises Market by Country, 2018 - 2021, USD Million
- TABLE 72 North America Large Enterprises Market by Country, 2022 - 2028, USD Million
- TABLE 73 North America Small & Medium Enterprises (SMEs) Market by Country, 2018 - 2021, USD Million
- TABLE 74 North America Small & Medium Enterprises (SMEs) Market by Country, 2022 - 2028, USD Million
- TABLE 75 North America Marketing Attribution Software Market by Vertical, 2018 - 2021, USD Million
- TABLE 76 North America Marketing Attribution Software Market by Vertical, 2022 - 2028, USD Million
- TABLE 77 North America Consumer Goods & Retail Market by Country, 2018 - 2021, USD Million
- TABLE 78 North America Consumer Goods & Retail Market by Country, 2022 - 2028, USD Million
- TABLE 79 North America BFSI Market by Country, 2018 - 2021, USD Million
- TABLE 80 North America BFSI Market by Country, 2022 - 2028, USD Million
- TABLE 81 North America Telecom & IT Market by Country, 2018 - 2021, USD Million
- TABLE 82 North America Telecom & IT Market by Country, 2022 - 2028, USD Million
- TABLE 83 North America Healthcare Market by Country, 2018 - 2021, USD Million
- TABLE 84 North America Healthcare Market by Country, 2022 - 2028, USD Million
- TABLE 85 North America Travel & Hospitality Market by Country, 2018 - 2021, USD Million
- TABLE 86 North America Travel & Hospitality Market by Country, 2022 - 2028, USD Million
- TABLE 87 North America Media & Entertainment Market by Country, 2018 - 2021, USD Million
- TABLE 88 North America Media & Entertainment Market by Country, 2022 - 2028, USD Million
- TABLE 89 North America Others Market by Country, 2018 - 2021, USD Million
- TABLE 90 North America Others Market by Country, 2022 - 2028, USD Million
- TABLE 91 North America Marketing Attribution Software Market by Country, 2018 - 2021, USD Million
- TABLE 92 North America Marketing Attribution Software Market by Country, 2022 - 2028, USD Million
- TABLE 93 US Marketing Attribution Software Market, 2018 - 2021, USD Million
- TABLE 94 US Marketing Attribution Software Market, 2022 - 2028, USD Million
- TABLE 95 US Marketing Attribution Software Market by Component, 2018 - 2021, USD Million
- TABLE 96 US Marketing Attribution Software Market by Component, 2022 - 2028, USD Million
- TABLE 97 US Marketing Attribution Software Market by Type, 2018 - 2021, USD Million
- TABLE 98 US Marketing Attribution Software Market by Type, 2022 - 2028, USD Million
- TABLE 99 US Marketing Attribution Software Market by Deployment Mode, 2018 - 2021, USD Million
- TABLE 100 US Marketing Attribution Software Market by Deployment Mode, 2022 - 2028, USD Million
- TABLE 101 US Marketing Attribution Software Market by Organization Size, 2018 - 2021, USD Million
- TABLE 102 US Marketing Attribution Software Market by Organization Size, 2022 - 2028, USD Million
- TABLE 103 US Marketing Attribution Software Market by Vertical, 2018 - 2021, USD Million
- TABLE 104 US Marketing Attribution Software Market by Vertical, 2022 - 2028, USD Million
- TABLE 105 Canada Marketing Attribution Software Market, 2018 - 2021, USD Million
- TABLE 106 Canada Marketing Attribution Software Market, 2022 - 2028, USD Million
- TABLE 107 Canada Marketing Attribution Software Market by Component, 2018 - 2021, USD Million
- TABLE 108 Canada Marketing Attribution Software Market by Component, 2022 - 2028, USD Million
- TABLE 109 Canada Marketing Attribution Software Market by Type, 2018 - 2021, USD Million
- TABLE 110 Canada Marketing Attribution Software Market by Type, 2022 - 2028, USD Million
- TABLE 111 Canada Marketing Attribution Software Market by Deployment Mode, 2018 - 2021, USD Million
- TABLE 112 Canada Marketing Attribution Software Market by Deployment Mode, 2022 - 2028, USD Million
- TABLE 113 Canada Marketing Attribution Software Market by Organization Size, 2018 - 2021, USD Million
- TABLE 114 Canada Marketing Attribution Software Market by Organization Size, 2022 - 2028, USD Million
- TABLE 115 Canada Marketing Attribution Software Market by Vertical, 2018 - 2021, USD Million
- TABLE 116 Canada Marketing Attribution Software Market by Vertical, 2022 - 2028, USD Million
- TABLE 117 Mexico Marketing Attribution Software Market, 2018 - 2021, USD Million
- TABLE 118 Mexico Marketing Attribution Software Market, 2022 - 2028, USD Million
- TABLE 119 Mexico Marketing Attribution Software Market by Component, 2018 - 2021, USD Million
- TABLE 120 Mexico Marketing Attribution Software Market by Component, 2022 - 2028, USD Million
- TABLE 121 Mexico Marketing Attribution Software Market by Type, 2018 - 2021, USD Million
- TABLE 122 Mexico Marketing Attribution Software Market by Type, 2022 - 2028, USD Million
- TABLE 123 Mexico Marketing Attribution Software Market by Deployment Mode, 2018 - 2021, USD Million
- TABLE 124 Mexico Marketing Attribution Software Market by Deployment Mode, 2022 - 2028, USD Million
- TABLE 125 Mexico Marketing Attribution Software Market by Organization Size, 2018 - 2021, USD Million
- TABLE 126 Mexico Marketing Attribution Software Market by Organization Size, 2022 - 2028, USD Million
- TABLE 127 Mexico Marketing Attribution Software Market by Vertical, 2018 - 2021, USD Million
- TABLE 128 Mexico Marketing Attribution Software Market by Vertical, 2022 - 2028, USD Million
- TABLE 129 Rest of North America Marketing Attribution Software Market, 2018 - 2021, USD Million
- TABLE 130 Rest of North America Marketing Attribution Software Market, 2022 - 2028, USD Million
- TABLE 131 Rest of North America Marketing Attribution Software Market by Component, 2018 - 2021, USD Million
- TABLE 132 Rest of North America Marketing Attribution Software Market by Component, 2022 - 2028, USD Million
- TABLE 133 Rest of North America Marketing Attribution Software Market by Type, 2018 - 2021, USD Million
- TABLE 134 Rest of North America Marketing Attribution Software Market by Type, 2022 - 2028, USD Million
- TABLE 135 Rest of North America Marketing Attribution Software Market by Deployment Mode, 2018 - 2021, USD Million
- TABLE 136 Rest of North America Marketing Attribution Software Market by Deployment Mode, 2022 - 2028, USD Million
- TABLE 137 Rest of North America Marketing Attribution Software Market by Organization Size, 2018 - 2021, USD Million
- TABLE 138 Rest of North America Marketing Attribution Software Market by Organization Size, 2022 - 2028, USD Million
- TABLE 139 Rest of North America Marketing Attribution Software Market by Vertical, 2018 - 2021, USD Million
- TABLE 140 Rest of North America Marketing Attribution Software Market by Vertical, 2022 - 2028, USD Million
- TABLE 141 Europe Marketing Attribution Software Market, 2018 - 2021, USD Million
- TABLE 142 Europe Marketing Attribution Software Market, 2022 - 2028, USD Million
- TABLE 143 Europe Marketing Attribution Software Market by Component, 2018 - 2021, USD Million
- TABLE 144 Europe Marketing Attribution Software Market by Component, 2022 - 2028, USD Million
- TABLE 145 Europe Solution Market by Country, 2018 - 2021, USD Million
- TABLE 146 Europe Solution Market by Country, 2022 - 2028, USD Million
- TABLE 147 Europe Services Market by Country, 2018 - 2021, USD Million
- TABLE 148 Europe Services Market by Country, 2022 - 2028, USD Million
- TABLE 149 Europe Marketing Attribution Software Market by Type, 2018 - 2021, USD Million
- TABLE 150 Europe Marketing Attribution Software Market by Type, 2022 - 2028, USD Million
- TABLE 151 Europe Multi-source Attribution Market by Country, 2018 - 2021, USD Million
- TABLE 152 Europe Multi-source Attribution Market by Country, 2022 - 2028, USD Million
- TABLE 153 Europe Probabilistic or Algorithmic Attribution Market by Country, 2018 - 2021, USD Million
- TABLE 154 Europe Probabilistic or Algorithmic Attribution Market by Country, 2022 - 2028, USD Million
- TABLE 155 Europe Single-source Attribution Market by Country, 2018 - 2021, USD Million
- TABLE 156 Europe Single-source Attribution Market by Country, 2022 - 2028, USD Million
- TABLE 157 Europe Marketing Attribution Software Market by Deployment Mode, 2018 - 2021, USD Million
- TABLE 158 Europe Marketing Attribution Software Market by Deployment Mode, 2022 - 2028, USD Million
- TABLE 159 Europe On-premises Market by Country, 2018 - 2021, USD Million
- TABLE 160 Europe On-premises Market by Country, 2022 - 2028, USD Million
- TABLE 161 Europe Cloud Market by Country, 2018 - 2021, USD Million
- TABLE 162 Europe Cloud Market by Country, 2022 - 2028, USD Million
- TABLE 163 Europe Marketing Attribution Software Market by Organization Size, 2018 - 2021, USD Million
- TABLE 164 Europe Marketing Attribution Software Market by Organization Size, 2022 - 2028, USD Million
- TABLE 165 Europe Large Enterprises Market by Country, 2018 - 2021, USD Million
- TABLE 166 Europe Large Enterprises Market by Country, 2022 - 2028, USD Million
- TABLE 167 Europe Small & Medium Enterprises (SMEs) Market by Country, 2018 - 2021, USD Million
- TABLE 168 Europe Small & Medium Enterprises (SMEs) Market by Country, 2022 - 2028, USD Million
- TABLE 169 Europe Marketing Attribution Software Market by Vertical, 2018 - 2021, USD Million
- TABLE 170 Europe Marketing Attribution Software Market by Vertical, 2022 - 2028, USD Million
- TABLE 171 Europe Consumer Goods & Retail Market by Country, 2018 - 2021, USD Million
- TABLE 172 Europe Consumer Goods & Retail Market by Country, 2022 - 2028, USD Million
- TABLE 173 Europe BFSI Market by Country, 2018 - 2021, USD Million
- TABLE 174 Europe BFSI Market by Country, 2022 - 2028, USD Million
- TABLE 175 Europe Telecom & IT Market by Country, 2018 - 2021, USD Million
- TABLE 176 Europe Telecom & IT Market by Country, 2022 - 2028, USD Million
- TABLE 177 Europe Healthcare Market by Country, 2018 - 2021, USD Million
- TABLE 178 Europe Healthcare Market by Country, 2022 - 2028, USD Million
- TABLE 179 Europe Travel & Hospitality Market by Country, 2018 - 2021, USD Million
- TABLE 180 Europe Travel & Hospitality Market by Country, 2022 - 2028, USD Million
- TABLE 181 Europe Media & Entertainment Market by Country, 2018 - 2021, USD Million
- TABLE 182 Europe Media & Entertainment Market by Country, 2022 - 2028, USD Million
- TABLE 183 Europe Others Market by Country, 2018 - 2021, USD Million
- TABLE 184 Europe Others Market by Country, 2022 - 2028, USD Million
- TABLE 185 Europe Marketing Attribution Software Market by Country, 2018 - 2021, USD Million
- TABLE 186 Europe Marketing Attribution Software Market by Country, 2022 - 2028, USD Million
- TABLE 187 Germany Marketing Attribution Software Market, 2018 - 2021, USD Million
- TABLE 188 Germany Marketing Attribution Software Market, 2022 - 2028, USD Million
- TABLE 189 Germany Marketing Attribution Software Market by Component, 2018 - 2021, USD Million
- TABLE 190 Germany Marketing Attribution Software Market by Component, 2022 - 2028, USD Million
- TABLE 191 Germany Marketing Attribution Software Market by Type, 2018 - 2021, USD Million
- TABLE 192 Germany Marketing Attribution Software Market by Type, 2022 - 2028, USD Million
- TABLE 193 Germany Marketing Attribution Software Market by Deployment Mode, 2018 - 2021, USD Million
- TABLE 194 Germany Marketing Attribution Software Market by Deployment Mode, 2022 - 2028, USD Million
- TABLE 195 Germany Marketing Attribution Software Market by Organization Size, 2018 - 2021, USD Million
- TABLE 196 Germany Marketing Attribution Software Market by Organization Size, 2022 - 2028, USD Million
- TABLE 197 Germany Marketing Attribution Software Market by Vertical, 2018 - 2021, USD Million
- TABLE 198 Germany Marketing Attribution Software Market by Vertical, 2022 - 2028, USD Million
- TABLE 199 UK Marketing Attribution Software Market, 2018 - 2021, USD Million
- TABLE 200 UK Marketing Attribution Software Market, 2022 - 2028, USD Million
- TABLE 201 UK Marketing Attribution Software Market by Component, 2018 - 2021, USD Million
- TABLE 202 UK Marketing Attribution Software Market by Component, 2022 - 2028, USD Million
- TABLE 203 UK Marketing Attribution Software Market by Type, 2018 - 2021, USD Million
- TABLE 204 UK Marketing Attribution Software Market by Type, 2022 - 2028, USD Million
- TABLE 205 UK Marketing Attribution Software Market by Deployment Mode, 2018 - 2021, USD Million
- TABLE 206 UK Marketing Attribution Software Market by Deployment Mode, 2022 - 2028, USD Million
- TABLE 207 UK Marketing Attribution Software Market by Organization Size, 2018 - 2021, USD Million
- TABLE 208 UK Marketing Attribution Software Market by Organization Size, 2022 - 2028, USD Million
- TABLE 209 UK Marketing Attribution Software Market by Vertical, 2018 - 2021, USD Million
- TABLE 210 UK Marketing Attribution Software Market by Vertical, 2022 - 2028, USD Million
- TABLE 211 France Marketing Attribution Software Market, 2018 - 2021, USD Million
- TABLE 212 France Marketing Attribution Software Market, 2022 - 2028, USD Million
- TABLE 213 France Marketing Attribution Software Market by Component, 2018 - 2021, USD Million
- TABLE 214 France Marketing Attribution Software Market by Component, 2022 - 2028, USD Million
- TABLE 215 France Marketing Attribution Software Market by Type, 2018 - 2021, USD Million
- TABLE 216 France Marketing Attribution Software Market by Type, 2022 - 2028, USD Million
- TABLE 217 France Marketing Attribution Software Market by Deployment Mode, 2018 - 2021, USD Million
- TABLE 218 France Marketing Attribution Software Market by Deployment Mode, 2022 - 2028, USD Million
- TABLE 219 France Marketing Attribution Software Market by Organization Size, 2018 - 2021, USD Million
- TABLE 220 France Marketing Attribution Software Market by Organization Size, 2022 - 2028, USD Million
- TABLE 221 France Marketing Attribution Software Market by Vertical, 2018 - 2021, USD Million
- TABLE 222 France Marketing Attribution Software Market by Vertical, 2022 - 2028, USD Million
- TABLE 223 Russia Marketing Attribution Software Market, 2018 - 2021, USD Million
- TABLE 224 Russia Marketing Attribution Software Market, 2022 - 2028, USD Million
- TABLE 225 Russia Marketing Attribution Software Market by Component, 2018 - 2021, USD Million
- TABLE 226 Russia Marketing Attribution Software Market by Component, 2022 - 2028, USD Million
- TABLE 227 Russia Marketing Attribution Software Market by Type, 2018 - 2021, USD Million
- TABLE 228 Russia Marketing Attribution Software Market by Type, 2022 - 2028, USD Million
- TABLE 229 Russia Marketing Attribution Software Market by Deployment Mode, 2018 - 2021, USD Million
- TABLE 230 Russia Marketing Attribution Software Market by Deployment Mode, 2022 - 2028, USD Million
- TABLE 231 Russia Marketing Attribution Software Market by Organization Size, 2018 - 2021, USD Million
- TABLE 232 Russia Marketing Attribution Software Market by Organization Size, 2022 - 2028, USD Million
- TABLE 233 Russia Marketing Attribution Software Market by Vertical, 2018 - 2021, USD Million
- TABLE 234 Russia Marketing Attribution Software Market by Vertical, 2022 - 2028, USD Million
- TABLE 235 Spain Marketing Attribution Software Market, 2018 - 2021, USD Million
- TABLE 236 Spain Marketing Attribution Software Market, 2022 - 2028, USD Million
- TABLE 237 Spain Marketing Attribution Software Market by Component, 2018 - 2021, USD Million
- TABLE 238 Spain Marketing Attribution Software Market by Component, 2022 - 2028, USD Million
- TABLE 239 Spain Marketing Attribution Software Market by Type, 2018 - 2021, USD Million
- TABLE 240 Spain Marketing Attribution Software Market by Type, 2022 - 2028, USD Million
- TABLE 241 Spain Marketing Attribution Software Market by Deployment Mode, 2018 - 2021, USD Million
- TABLE 242 Spain Marketing Attribution Software Market by Deployment Mode, 2022 - 2028, USD Million
- TABLE 243 Spain Marketing Attribution Software Market by Organization Size, 2018 - 2021, USD Million
- TABLE 244 Spain Marketing Attribution Software Market by Organization Size, 2022 - 2028, USD Million
- TABLE 245 Spain Marketing Attribution Software Market by Vertical, 2018 - 2021, USD Million
- TABLE 246 Spain Marketing Attribution Software Market by Vertical, 2022 - 2028, USD Million
- TABLE 247 Italy Marketing Attribution Software Market, 2018 - 2021, USD Million
- TABLE 248 Italy Marketing Attribution Software Market, 2022 - 2028, USD Million
- TABLE 249 Italy Marketing Attribution Software Market by Component, 2018 - 2021, USD Million
- TABLE 250 Italy Marketing Attribution Software Market by Component, 2022 - 2028, USD Million
- TABLE 251 Italy Marketing Attribution Software Market by Type, 2018 - 2021, USD Million
- TABLE 252 Italy Marketing Attribution Software Market by Type, 2022 - 2028, USD Million
- TABLE 253 Italy Marketing Attribution Software Market by Deployment Mode, 2018 - 2021, USD Million
- TABLE 254 Italy Marketing Attribution Software Market by Deployment Mode, 2022 - 2028, USD Million
- TABLE 255 Italy Marketing Attribution Software Market by Organization Size, 2018 - 2021, USD Million
- TABLE 256 Italy Marketing Attribution Software Market by Organization Size, 2022 - 2028, USD Million
- TABLE 257 Italy Marketing Attribution Software Market by Vertical, 2018 - 2021, USD Million
- TABLE 258 Italy Marketing Attribution Software Market by Vertical, 2022 - 2028, USD Million
- TABLE 259 Rest of Europe Marketing Attribution Software Market, 2018 - 2021, USD Million
- TABLE 260 Rest of Europe Marketing Attribution Software Market, 2022 - 2028, USD Million
- TABLE 261 Rest of Europe Marketing Attribution Software Market by Component, 2018 - 2021, USD Million
- TABLE 262 Rest of Europe Marketing Attribution Software Market by Component, 2022 - 2028, USD Million
- TABLE 263 Rest of Europe Marketing Attribution Software Market by Type, 2018 - 2021, USD Million
- TABLE 264 Rest of Europe Marketing Attribution Software Market by Type, 2022 - 2028, USD Million
- TABLE 265 Rest of Europe Marketing Attribution Software Market by Deployment Mode, 2018 - 2021, USD Million
- TABLE 266 Rest of Europe Marketing Attribution Software Market by Deployment Mode, 2022 - 2028, USD Million
- TABLE 267 Rest of Europe Marketing Attribution Software Market by Organization Size, 2018 - 2021, USD Million
- TABLE 268 Rest of Europe Marketing Attribution Software Market by Organization Size, 2022 - 2028, USD Million
- TABLE 269 Rest of Europe Marketing Attribution Software Market by Vertical, 2018 - 2021, USD Million
- TABLE 270 Rest of Europe Marketing Attribution Software Market by Vertical, 2022 - 2028, USD Million
- TABLE 271 Asia Pacific Marketing Attribution Software Market, 2018 - 2021, USD Million
- TABLE 272 Asia Pacific Marketing Attribution Software Market, 2022 - 2028, USD Million
- TABLE 273 Asia Pacific Marketing Attribution Software Market by Component, 2018 - 2021, USD Million
- TABLE 274 Asia Pacific Marketing Attribution Software Market by Component, 2022 - 2028, USD Million
- TABLE 275 Asia Pacific Solution Market by Country, 2018 - 2021, USD Million
- TABLE 276 Asia Pacific Solution Market by Country, 2022 - 2028, USD Million
- TABLE 277 Asia Pacific Services Market by Country, 2018 - 2021, USD Million
- TABLE 278 Asia Pacific Services Market by Country, 2022 - 2028, USD Million
- TABLE 279 Asia Pacific Marketing Attribution Software Market by Type, 2018 - 2021, USD Million
- TABLE 280 Asia Pacific Marketing Attribution Software Market by Type, 2022 - 2028, USD Million
- TABLE 281 Asia Pacific Multi-source Attribution Market by Country, 2018 - 2021, USD Million
- TABLE 282 Asia Pacific Multi-source Attribution Market by Country, 2022 - 2028, USD Million
- TABLE 283 Asia Pacific Probabilistic or Algorithmic Attribution Market by Country, 2018 - 2021, USD Million
- TABLE 284 Asia Pacific Probabilistic or Algorithmic Attribution Market by Country, 2022 - 2028, USD Million
- TABLE 285 Asia Pacific Single-source Attribution Market by Country, 2018 - 2021, USD Million
- TABLE 286 Asia Pacific Single-source Attribution Market by Country, 2022 - 2028, USD Million
- TABLE 287 Asia Pacific Marketing Attribution Software Market by Deployment Mode, 2018 - 2021, USD Million
- TABLE 288 Asia Pacific Marketing Attribution Software Market by Deployment Mode, 2022 - 2028, USD Million
- TABLE 289 Asia Pacific On-premises Market by Country, 2018 - 2021, USD Million
- TABLE 290 Asia Pacific On-premises Market by Country, 2022 - 2028, USD Million
- TABLE 291 Asia Pacific Cloud Market by Country, 2018 - 2021, USD Million
- TABLE 292 Asia Pacific Cloud Market by Country, 2022 - 2028, USD Million
- TABLE 293 Asia Pacific Marketing Attribution Software Market by Organization Size, 2018 - 2021, USD Million
- TABLE 294 Asia Pacific Marketing Attribution Software Market by Organization Size, 2022 - 2028, USD Million
- TABLE 295 Asia Pacific Large Enterprises Market by Country, 2018 - 2021, USD Million
- TABLE 296 Asia Pacific Large Enterprises Market by Country, 2022 - 2028, USD Million
- TABLE 297 Asia Pacific Small & Medium Enterprises (SMEs) Market by Country, 2018 - 2021, USD Million
- TABLE 298 Asia Pacific Small & Medium Enterprises (SMEs) Market by Country, 2022 - 2028, USD Million
- TABLE 299 Asia Pacific Marketing Attribution Software Market by Vertical, 2018 - 2021, USD Million
- TABLE 300 Asia Pacific Marketing Attribution Software Market by Vertical, 2022 - 2028, USD Million
- TABLE 301 Asia Pacific Consumer Goods & Retail Market by Country, 2018 - 2021, USD Million
- TABLE 302 Asia Pacific Consumer Goods & Retail Market by Country, 2022 - 2028, USD Million
- TABLE 303 Asia Pacific BFSI Market by Country, 2018 - 2021, USD Million
- TABLE 304 Asia Pacific BFSI Market by Country, 2022 - 2028, USD Million
- TABLE 305 Asia Pacific Telecom & IT Market by Country, 2018 - 2021, USD Million
- TABLE 306 Asia Pacific Telecom & IT Market by Country, 2022 - 2028, USD Million
- TABLE 307 Asia Pacific Healthcare Market by Country, 2018 - 2021, USD Million
- TABLE 308 Asia Pacific Healthcare Market by Country, 2022 - 2028, USD Million
- TABLE 309 Asia Pacific Travel & Hospitality Market by Country, 2018 - 2021, USD Million
- TABLE 310 Asia Pacific Travel & Hospitality Market by Country, 2022 - 2028, USD Million
- TABLE 311 Asia Pacific Media & Entertainment Market by Country, 2018 - 2021, USD Million
- TABLE 312 Asia Pacific Media & Entertainment Market by Country, 2022 - 2028, USD Million
- TABLE 313 Asia Pacific Others Market by Country, 2018 - 2021, USD Million
- TABLE 314 Asia Pacific Others Market by Country, 2022 - 2028, USD Million
- TABLE 315 Asia Pacific Marketing Attribution Software Market by Country, 2018 - 2021, USD Million
- TABLE 316 Asia Pacific Marketing Attribution Software Market by Country, 2022 - 2028, USD Million
- TABLE 317 China Marketing Attribution Software Market, 2018 - 2021, USD Million
- TABLE 318 China Marketing Attribution Software Market, 2022 - 2028, USD Million
- TABLE 319 China Marketing Attribution Software Market by Component, 2018 - 2021, USD Million
- TABLE 320 China Marketing Attribution Software Market by Component, 2022 - 2028, USD Million
- TABLE 321 China Marketing Attribution Software Market by Type, 2018 - 2021, USD Million
- TABLE 322 China Marketing Attribution Software Market by Type, 2022 - 2028, USD Million
- TABLE 323 China Marketing Attribution Software Market by Deployment Mode, 2018 - 2021, USD Million
- TABLE 324 China Marketing Attribution Software Market by Deployment Mode, 2022 - 2028, USD Million
- TABLE 325 China Marketing Attribution Software Market by Organization Size, 2018 - 2021, USD Million
- TABLE 326 China Marketing Attribution Software Market by Organization Size, 2022 - 2028, USD Million
- TABLE 327 China Marketing Attribution Software Market by Vertical, 2018 - 2021, USD Million
- TABLE 328 China Marketing Attribution Software Market by Vertical, 2022 - 2028, USD Million
- TABLE 329 Japan Marketing Attribution Software Market, 2018 - 2021, USD Million
- TABLE 330 Japan Marketing Attribution Software Market, 2022 - 2028, USD Million
- TABLE 331 Japan Marketing Attribution Software Market by Component, 2018 - 2021, USD Million
- TABLE 332 Japan Marketing Attribution Software Market by Component, 2022 - 2028, USD Million
- TABLE 333 Japan Marketing Attribution Software Market by Type, 2018 - 2021, USD Million
- TABLE 334 Japan Marketing Attribution Software Market by Type, 2022 - 2028, USD Million
- TABLE 335 Japan Marketing Attribution Software Market by Deployment Mode, 2018 - 2021, USD Million
- TABLE 336 Japan Marketing Attribution Software Market by Deployment Mode, 2022 - 2028, USD Million
- TABLE 337 Japan Marketing Attribution Software Market by Organization Size, 2018 - 2021, USD Million
- TABLE 338 Japan Marketing Attribution Software Market by Organization Size, 2022 - 2028, USD Million
- TABLE 339 Japan Marketing Attribution Software Market by Vertical, 2018 - 2021, USD Million
- TABLE 340 Japan Marketing Attribution Software Market by Vertical, 2022 - 2028, USD Million
- TABLE 341 India Marketing Attribution Software Market, 2018 - 2021, USD Million
- TABLE 342 India Marketing Attribution Software Market, 2022 - 2028, USD Million
- TABLE 343 India Marketing Attribution Software Market by Component, 2018 - 2021, USD Million
- TABLE 344 India Marketing Attribution Software Market by Component, 2022 - 2028, USD Million
- TABLE 345 India Marketing Attribution Software Market by Type, 2018 - 2021, USD Million
- TABLE 346 India Marketing Attribution Software Market by Type, 2022 - 2028, USD Million
- TABLE 347 India Marketing Attribution Software Market by Deployment Mode, 2018 - 2021, USD Million
- TABLE 348 India Marketing Attribution Software Market by Deployment Mode, 2022 - 2028, USD Million
- TABLE 349 India Marketing Attribution Software Market by Organization Size, 2018 - 2021, USD Million
- TABLE 350 India Marketing Attribution Software Market by Organization Size, 2022 - 2028, USD Million
- TABLE 351 India Marketing Attribution Software Market by Vertical, 2018 - 2021, USD Million
- TABLE 352 India Marketing Attribution Software Market by Vertical, 2022 - 2028, USD Million
- TABLE 353 South Korea Marketing Attribution Software Market, 2018 - 2021, USD Million
- TABLE 354 South Korea Marketing Attribution Software Market, 2022 - 2028, USD Million
- TABLE 355 South Korea Marketing Attribution Software Market by Component, 2018 - 2021, USD Million
- TABLE 356 South Korea Marketing Attribution Software Market by Component, 2022 - 2028, USD Million
- TABLE 357 South Korea Marketing Attribution Software Market by Type, 2018 - 2021, USD Million
- TABLE 358 South Korea Marketing Attribution Software Market by Type, 2022 - 2028, USD Million
- TABLE 359 South Korea Marketing Attribution Software Market by Deployment Mode, 2018 - 2021, USD Million
- TABLE 360 South Korea Marketing Attribution Software Market by Deployment Mode, 2022 - 2028, USD Million
- TABLE 361 South Korea Marketing Attribution Software Market by Organization Size, 2018 - 2021, USD Million
- TABLE 362 South Korea Marketing Attribution Software Market by Organization Size, 2022 - 2028, USD Million
- TABLE 363 South Korea Marketing Attribution Software Market by Vertical, 2018 - 2021, USD Million
- TABLE 364 South Korea Marketing Attribution Software Market by Vertical, 2022 - 2028, USD Million
- TABLE 365 Singapore Marketing Attribution Software Market, 2018 - 2021, USD Million
- TABLE 366 Singapore Marketing Attribution Software Market, 2022 - 2028, USD Million
- TABLE 367 Singapore Marketing Attribution Software Market by Component, 2018 - 2021, USD Million
- TABLE 368 Singapore Marketing Attribution Software Market by Component, 2022 - 2028, USD Million
- TABLE 369 Singapore Marketing Attribution Software Market by Type, 2018 - 2021, USD Million
- TABLE 370 Singapore Marketing Attribution Software Market by Type, 2022 - 2028, USD Million
- TABLE 371 Singapore Marketing Attribution Software Market by Deployment Mode, 2018 - 2021, USD Million
- TABLE 372 Singapore Marketing Attribution Software Market by Deployment Mode, 2022 - 2028, USD Million
- TABLE 373 Singapore Marketing Attribution Software Market by Organization Size, 2018 - 2021, USD Million
- TABLE 374 Singapore Marketing Attribution Software Market by Organization Size, 2022 - 2028, USD Million
- TABLE 375 Singapore Marketing Attribution Software Market by Vertical, 2018 - 2021, USD Million
- TABLE 376 Singapore Marketing Attribution Software Market by Vertical, 2022 - 2028, USD Million
- TABLE 377 Malaysia Marketing Attribution Software Market, 2018 - 2021, USD Million
- TABLE 378 Malaysia Marketing Attribution Software Market, 2022 - 2028, USD Million
- TABLE 379 Malaysia Marketing Attribution Software Market by Component, 2018 - 2021, USD Million
- TABLE 380 Malaysia Marketing Attribution Software Market by Component, 2022 - 2028, USD Million
- TABLE 381 Malaysia Marketing Attribution Software Market by Type, 2018 - 2021, USD Million
- TABLE 382 Malaysia Marketing Attribution Software Market by Type, 2022 - 2028, USD Million
- TABLE 383 Malaysia Marketing Attribution Software Market by Deployment Mode, 2018 - 2021, USD Million
- TABLE 384 Malaysia Marketing Attribution Software Market by Deployment Mode, 2022 - 2028, USD Million
- TABLE 385 Malaysia Marketing Attribution Software Market by Organization Size, 2018 - 2021, USD Million
- TABLE 386 Malaysia Marketing Attribution Software Market by Organization Size, 2022 - 2028, USD Million
- TABLE 387 Malaysia Marketing Attribution Software Market by Vertical, 2018 - 2021, USD Million
- TABLE 388 Malaysia Marketing Attribution Software Market by Vertical, 2022 - 2028, USD Million
- TABLE 389 Rest of Asia Pacific Marketing Attribution Software Market, 2018 - 2021, USD Million
- TABLE 390 Rest of Asia Pacific Marketing Attribution Software Market, 2022 - 2028, USD Million
- TABLE 391 Rest of Asia Pacific Marketing Attribution Software Market by Component, 2018 - 2021, USD Million
- TABLE 392 Rest of Asia Pacific Marketing Attribution Software Market by Component, 2022 - 2028, USD Million
- TABLE 393 Rest of Asia Pacific Marketing Attribution Software Market by Type, 2018 - 2021, USD Million
- TABLE 394 Rest of Asia Pacific Marketing Attribution Software Market by Type, 2022 - 2028, USD Million
- TABLE 395 Rest of Asia Pacific Marketing Attribution Software Market by Deployment Mode, 2018 - 2021, USD Million
- TABLE 396 Rest of Asia Pacific Marketing Attribution Software Market by Deployment Mode, 2022 - 2028, USD Million
- TABLE 397 Rest of Asia Pacific Marketing Attribution Software Market by Organization Size, 2018 - 2021, USD Million
- TABLE 398 Rest of Asia Pacific Marketing Attribution Software Market by Organization Size, 2022 - 2028, USD Million
- TABLE 399 Rest of Asia Pacific Marketing Attribution Software Market by Vertical, 2018 - 2021, USD Million
- TABLE 400 Rest of Asia Pacific Marketing Attribution Software Market by Vertical, 2022 - 2028, USD Million
- TABLE 401 LAMEA Marketing Attribution Software Market, 2018 - 2021, USD Million
- TABLE 402 LAMEA Marketing Attribution Software Market, 2022 - 2028, USD Million
- TABLE 403 LAMEA Marketing Attribution Software Market by Component, 2018 - 2021, USD Million
- TABLE 404 LAMEA Marketing Attribution Software Market by Component, 2022 - 2028, USD Million
- TABLE 405 LAMEA Solution Market by Country, 2018 - 2021, USD Million
- TABLE 406 LAMEA Solution Market by Country, 2022 - 2028, USD Million
- TABLE 407 LAMEA Services Market by Country, 2018 - 2021, USD Million
- TABLE 408 LAMEA Services Market by Country, 2022 - 2028, USD Million
- TABLE 409 LAMEA Marketing Attribution Software Market by Type, 2018 - 2021, USD Million
- TABLE 410 LAMEA Marketing Attribution Software Market by Type, 2022 - 2028, USD Million
- TABLE 411 LAMEA Multi-source Attribution Market by Country, 2018 - 2021, USD Million
- TABLE 412 LAMEA Multi-source Attribution Market by Country, 2022 - 2028, USD Million
- TABLE 413 LAMEA Probabilistic or Algorithmic Attribution Market by Country, 2018 - 2021, USD Million
- TABLE 414 LAMEA Probabilistic or Algorithmic Attribution Market by Country, 2022 - 2028, USD Million
- TABLE 415 LAMEA Single-source Attribution Market by Country, 2018 - 2021, USD Million
- TABLE 416 LAMEA Single-source Attribution Market by Country, 2022 - 2028, USD Million
- TABLE 417 LAMEA Marketing Attribution Software Market by Deployment Mode, 2018 - 2021, USD Million
- TABLE 418 LAMEA Marketing Attribution Software Market by Deployment Mode, 2022 - 2028, USD Million
- TABLE 419 LAMEA On-premises Market by Country, 2018 - 2021, USD Million
- TABLE 420 LAMEA On-premises Market by Country, 2022 - 2028, USD Million
- TABLE 421 LAMEA Cloud Market by Country, 2018 - 2021, USD Million
- TABLE 422 LAMEA Cloud Market by Country, 2022 - 2028, USD Million
- TABLE 423 LAMEA Marketing Attribution Software Market by Organization Size, 2018 - 2021, USD Million
- TABLE 424 LAMEA Marketing Attribution Software Market by Organization Size, 2022 - 2028, USD Million
- TABLE 425 LAMEA Large Enterprises Market by Country, 2018 - 2021, USD Million
- TABLE 426 LAMEA Large Enterprises Market by Country, 2022 - 2028, USD Million
- TABLE 427 LAMEA Small & Medium Enterprises (SMEs) Market by Country, 2018 - 2021, USD Million
- TABLE 428 LAMEA Small & Medium Enterprises (SMEs) Market by Country, 2022 - 2028, USD Million
- TABLE 429 LAMEA Marketing Attribution Software Market by Vertical, 2018 - 2021, USD Million
- TABLE 430 LAMEA Marketing Attribution Software Market by Vertical, 2022 - 2028, USD Million
- TABLE 431 LAMEA Consumer Goods & Retail Market by Country, 2018 - 2021, USD Million
- TABLE 432 LAMEA Consumer Goods & Retail Market by Country, 2022 - 2028, USD Million
- TABLE 433 LAMEA BFSI Market by Country, 2018 - 2021, USD Million
- TABLE 434 LAMEA BFSI Market by Country, 2022 - 2028, USD Million
- TABLE 435 LAMEA Telecom & IT Market by Country, 2018 - 2021, USD Million
- TABLE 436 LAMEA Telecom & IT Market by Country, 2022 - 2028, USD Million
- TABLE 437 LAMEA Healthcare Market by Country, 2018 - 2021, USD Million
- TABLE 438 LAMEA Healthcare Market by Country, 2022 - 2028, USD Million
- TABLE 439 LAMEA Travel & Hospitality Market by Country, 2018 - 2021, USD Million
- TABLE 440 LAMEA Travel & Hospitality Market by Country, 2022 - 2028, USD Million
- TABLE 441 LAMEA Media & Entertainment Market by Country, 2018 - 2021, USD Million
- TABLE 442 LAMEA Media & Entertainment Market by Country, 2022 - 2028, USD Million
- TABLE 443 LAMEA Others Market by Country, 2018 - 2021, USD Million
- TABLE 444 LAMEA Others Market by Country, 2022 - 2028, USD Million
- TABLE 445 LAMEA Marketing Attribution Software Market by Country, 2018 - 2021, USD Million
- TABLE 446 LAMEA Marketing Attribution Software Market by Country, 2022 - 2028, USD Million
- TABLE 447 Brazil Marketing Attribution Software Market, 2018 - 2021, USD Million
- TABLE 448 Brazil Marketing Attribution Software Market, 2022 - 2028, USD Million
- TABLE 449 Brazil Marketing Attribution Software Market by Component, 2018 - 2021, USD Million
- TABLE 450 Brazil Marketing Attribution Software Market by Component, 2022 - 2028, USD Million
- TABLE 451 Brazil Marketing Attribution Software Market by Type, 2018 - 2021, USD Million
- TABLE 452 Brazil Marketing Attribution Software Market by Type, 2022 - 2028, USD Million
- TABLE 453 Brazil Marketing Attribution Software Market by Deployment Mode, 2018 - 2021, USD Million
- TABLE 454 Brazil Marketing Attribution Software Market by Deployment Mode, 2022 - 2028, USD Million
- TABLE 455 Brazil Marketing Attribution Software Market by Organization Size, 2018 - 2021, USD Million
- TABLE 456 Brazil Marketing Attribution Software Market by Organization Size, 2022 - 2028, USD Million
- TABLE 457 Brazil Marketing Attribution Software Market by Vertical, 2018 - 2021, USD Million
- TABLE 458 Brazil Marketing Attribution Software Market by Vertical, 2022 - 2028, USD Million
- TABLE 459 Argentina Marketing Attribution Software Market, 2018 - 2021, USD Million
- TABLE 460 Argentina Marketing Attribution Software Market, 2022 - 2028, USD Million
- TABLE 461 Argentina Marketing Attribution Software Market by Component, 2018 - 2021, USD Million
- TABLE 462 Argentina Marketing Attribution Software Market by Component, 2022 - 2028, USD Million
- TABLE 463 Argentina Marketing Attribution Software Market by Type, 2018 - 2021, USD Million
- TABLE 464 Argentina Marketing Attribution Software Market by Type, 2022 - 2028, USD Million
- TABLE 465 Argentina Marketing Attribution Software Market by Deployment Mode, 2018 - 2021, USD Million
- TABLE 466 Argentina Marketing Attribution Software Market by Deployment Mode, 2022 - 2028, USD Million
- TABLE 467 Argentina Marketing Attribution Software Market by Organization Size, 2018 - 2021, USD Million
- TABLE 468 Argentina Marketing Attribution Software Market by Organization Size, 2022 - 2028, USD Million
- TABLE 469 Argentina Marketing Attribution Software Market by Vertical, 2018 - 2021, USD Million
- TABLE 470 Argentina Marketing Attribution Software Market by Vertical, 2022 - 2028, USD Million
- TABLE 471 UAE Marketing Attribution Software Market, 2018 - 2021, USD Million
- TABLE 472 UAE Marketing Attribution Software Market, 2022 - 2028, USD Million
- TABLE 473 UAE Marketing Attribution Software Market by Component, 2018 - 2021, USD Million
- TABLE 474 UAE Marketing Attribution Software Market by Component, 2022 - 2028, USD Million
- TABLE 475 UAE Marketing Attribution Software Market by Type, 2018 - 2021, USD Million
- TABLE 476 UAE Marketing Attribution Software Market by Type, 2022 - 2028, USD Million
- TABLE 477 UAE Marketing Attribution Software Market by Deployment Mode, 2018 - 2021, USD Million
- TABLE 478 UAE Marketing Attribution Software Market by Deployment Mode, 2022 - 2028, USD Million
- TABLE 479 UAE Marketing Attribution Software Market by Organization Size, 2018 - 2021, USD Million
- TABLE 480 UAE Marketing Attribution Software Market by Organization Size, 2022 - 2028, USD Million
- TABLE 481 UAE Marketing Attribution Software Market by Vertical, 2018 - 2021, USD Million
- TABLE 482 UAE Marketing Attribution Software Market by Vertical, 2022 - 2028, USD Million
- TABLE 483 Saudi Arabia Marketing Attribution Software Market, 2018 - 2021, USD Million
- TABLE 484 Saudi Arabia Marketing Attribution Software Market, 2022 - 2028, USD Million
- TABLE 485 Saudi Arabia Marketing Attribution Software Market by Component, 2018 - 2021, USD Million
- TABLE 486 Saudi Arabia Marketing Attribution Software Market by Component, 2022 - 2028, USD Million
- TABLE 487 Saudi Arabia Marketing Attribution Software Market by Type, 2018 - 2021, USD Million
- TABLE 488 Saudi Arabia Marketing Attribution Software Market by Type, 2022 - 2028, USD Million
- TABLE 489 Saudi Arabia Marketing Attribution Software Market by Deployment Mode, 2018 - 2021, USD Million
- TABLE 490 Saudi Arabia Marketing Attribution Software Market by Deployment Mode, 2022 - 2028, USD Million
- TABLE 491 Saudi Arabia Marketing Attribution Software Market by Organization Size, 2018 - 2021, USD Million
- TABLE 492 Saudi Arabia Marketing Attribution Software Market by Organization Size, 2022 - 2028, USD Million
- TABLE 493 Saudi Arabia Marketing Attribution Software Market by Vertical, 2018 - 2021, USD Million
- TABLE 494 Saudi Arabia Marketing Attribution Software Market by Vertical, 2022 - 2028, USD Million
- TABLE 495 South Africa Marketing Attribution Software Market, 2018 - 2021, USD Million
- TABLE 496 South Africa Marketing Attribution Software Market, 2022 - 2028, USD Million
- TABLE 497 South Africa Marketing Attribution Software Market by Component, 2018 - 2021, USD Million
- TABLE 498 South Africa Marketing Attribution Software Market by Component, 2022 - 2028, USD Million
- TABLE 499 South Africa Marketing Attribution Software Market by Type, 2018 - 2021, USD Million
- TABLE 500 South Africa Marketing Attribution Software Market by Type, 2022 - 2028, USD Million
- TABLE 501 South Africa Marketing Attribution Software Market by Deployment Mode, 2018 - 2021, USD Million
- TABLE 502 South Africa Marketing Attribution Software Market by Deployment Mode, 2022 - 2028, USD Million
- TABLE 503 South Africa Marketing Attribution Software Market by Organization Size, 2018 - 2021, USD Million
- TABLE 504 South Africa Marketing Attribution Software Market by Organization Size, 2022 - 2028, USD Million
- TABLE 505 South Africa Marketing Attribution Software Market by Vertical, 2018 - 2021, USD Million
- TABLE 506 South Africa Marketing Attribution Software Market by Vertical, 2022 - 2028, USD Million
- TABLE 507 Nigeria Marketing Attribution Software Market, 2018 - 2021, USD Million
- TABLE 508 Nigeria Marketing Attribution Software Market, 2022 - 2028, USD Million
- TABLE 509 Nigeria Marketing Attribution Software Market by Component, 2018 - 2021, USD Million
- TABLE 510 Nigeria Marketing Attribution Software Market by Component, 2022 - 2028, USD Million
- TABLE 511 Nigeria Marketing Attribution Software Market by Type, 2018 - 2021, USD Million
- TABLE 512 Nigeria Marketing Attribution Software Market by Type, 2022 - 2028, USD Million
- TABLE 513 Nigeria Marketing Attribution Software Market by Deployment Mode, 2018 - 2021, USD Million
- TABLE 514 Nigeria Marketing Attribution Software Market by Deployment Mode, 2022 - 2028, USD Million
- TABLE 515 Nigeria Marketing Attribution Software Market by Organization Size, 2018 - 2021, USD Million
- TABLE 516 Nigeria Marketing Attribution Software Market by Organization Size, 2022 - 2028, USD Million
- TABLE 517 Nigeria Marketing Attribution Software Market by Vertical, 2018 - 2021, USD Million
- TABLE 518 Nigeria Marketing Attribution Software Market by Vertical, 2022 - 2028, USD Million
- TABLE 519 Rest of LAMEA Marketing Attribution Software Market, 2018 - 2021, USD Million
- TABLE 520 Rest of LAMEA Marketing Attribution Software Market, 2022 - 2028, USD Million
- TABLE 521 Rest of LAMEA Marketing Attribution Software Market by Component, 2018 - 2021, USD Million
- TABLE 522 Rest of LAMEA Marketing Attribution Software Market by Component, 2022 - 2028, USD Million
- TABLE 523 Rest of LAMEA Marketing Attribution Software Market by Type, 2018 - 2021, USD Million
- TABLE 524 Rest of LAMEA Marketing Attribution Software Market by Type, 2022 - 2028, USD Million
- TABLE 525 Rest of LAMEA Marketing Attribution Software Market by Deployment Mode, 2018 - 2021, USD Million
- TABLE 526 Rest of LAMEA Marketing Attribution Software Market by Deployment Mode, 2022 - 2028, USD Million
- TABLE 527 Rest of LAMEA Marketing Attribution Software Market by Organization Size, 2018 - 2021, USD Million
- TABLE 528 Rest of LAMEA Marketing Attribution Software Market by Organization Size, 2022 - 2028, USD Million
- TABLE 529 Rest of LAMEA Marketing Attribution Software Market by Vertical, 2018 - 2021, USD Million
- TABLE 530 Rest of LAMEA Marketing Attribution Software Market by Vertical, 2022 - 2028, USD Million
- TABLE 531 Key Information - Oracle Corporation
- TABLE 532 Key Information - Google LLC
- TABLE 533 Key Information - SAP SE
- TABLE 534 Key Information - Adobe, Inc.
- TABLE 535 Key Information - Merkle Inc.
- TABLE 536 Key Information - Neustar, Inc.
- TABLE 537 Key Information - HubSpot, Inc.
- TABLE 538 Key Information - Nielsen Holdings plc
- TABLE 539 Key Information - Ruler Analytics Limited
- TABLE 540 Key Information - Windsor Group AG
List of Figures
- FIG 1 Methodology for the research
- FIG 2 Market Share Analysis, 2021
- FIG 3 Global Marketing Attribution Software Market Share by Component, 2021
- FIG 4 Global Marketing Attribution Software Market Share by Component, 2028
- FIG 5 Global Marketing Attribution Software Market by Component, 2018 - 2028, USD Million
- FIG 6 Global Marketing Attribution Software Market Share by Type, 2021
- FIG 7 Global Marketing Attribution Software Market Share by Type, 2028
- FIG 8 Global Marketing Attribution Software Market by Type, 2018 - 2028, USD Million
- FIG 9 Global Marketing Attribution Software Market Share by Deployment Mode, 2021
- FIG 10 Global Marketing Attribution Software Market Share by Deployment Mode, 2028
- FIG 11 Global Marketing Attribution Software Market by Deployment Mode, 2018 - 2028, USD Million
- FIG 12 Global Marketing Attribution Software Market Share by Organization Size, 2021
- FIG 13 Global Marketing Attribution Software Market Share by Organization Size, 2028
- FIG 14 Global Marketing Attribution Software Market by Organization Size, 2018 - 2028, USD Million
- FIG 15 Global Marketing Attribution Software Market Share by Vertical, 2021
- FIG 16 Global Marketing Attribution Software Market Share by Vertical, 2028
- FIG 17 Global Marketing Attribution Software Market by Vertical, 2018 - 2028, USD Million
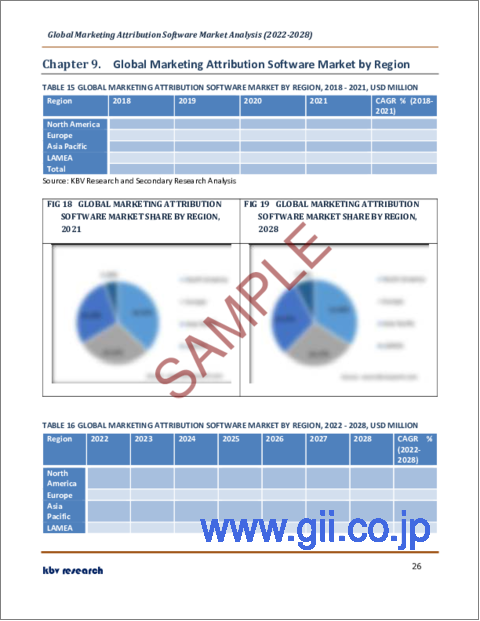
- FIG 18 Global Marketing Attribution Software Market Share by Region, 2021
- FIG 19 Global Marketing Attribution Software Market Share by Region, 2028
- FIG 20 Global Marketing Attribution Software Market by Region, 2018 - 2028, USD Million
- FIG 21 SWOT analysis: Oracle Corporation
- FIG 22 SWOT Analysis: Alphabet Inc. (Google LLC)
- FIG 23 SWOT Analysis: SAP SE
The Global Marketing Attribution Software Market size is expected to reach $7.2 billion by 2028, rising at a market growth of 13.7% CAGR during the forecast period.
Companies employ marketing attribution software to identify the activities, occasions, or touchpoints that contribute to the effectiveness of their marketing and sales teams during the prospecting and sales processes. It's quite challenging to determine what made a closed deal effective because it frequently involves balancing several variables and circumstances that may occur in any sequence.
Based on the impact each factor had on the customer or prospect throughout their contacts with the business, companies utilize marketing attribution software to assign a value to each factor that might have contributed to the success of a sale. Since marketing attribution software frequently integrates with other marketing and software tools used by sales, marketing, or public relations departments, such as CRM, email marketing, demand generation, marketing automation, email tracking, or sales analytics tools, it is a hub software that gathers data from other marketing and software tools.
Marketing teams need cutting-edge analytics solutions that can precisely and quickly transform massive data into person-level insights that can be applied for in-campaign adjustments to attain the level of data granularity necessary for effective attribution. Marketing attribution is much more crucial because of the variety of this data and the sheer number of potential touchpoints. In addition, because analytical tools may pull information from various sources, the lessons from this attribution provide a complete view of business marketing performance and audience habits. When assessing marketing touchpoints, for instance, some analytical systems can consider asset kind, exposure order, and device type.
COVID-19 Impact Analysis
The COVID-19 pandemic has had a significant impact on enterprises all over the world. The lockdown imposed by many governments has benefited from adopting marketing attribution software. Companies are concentrating on developing technology after the COVID-19 incident, including AI-powered solutions, cloud computing, and automation. Also, companies are spending more on marketing attribution software due to the expanding popularity of personalized marketing as a strategy to improve the customer experience. The program also provides businesses with several advantages, such as the capacity to manage marketing budgets and assess the efficiency of marketing channels and campaigns.
Market Growth Factors
Grown acceptance of cloud-based services and solutions
The majority of enterprises are embracing cloud-based strategies by dispersing their resources across multiple environments. As a result, the popularity of cloud-based marketing attribution solutions has increased due to their adaptability, scalability, and low cost. It also enables enterprises to centrally evaluate data created from several places and acquire data from diverse applications or platforms, making data collection and analysis easier. In addition, it permits the tracking of billions of events every day, the use of machine learning to connect the dots between views and purchases, and the visualization of results for clients and teams inside the company.
Monitoring client behavior for targeted marketing
It is essential for businesses to be able to take user behavior across devices into consideration as they continue to plow through the uncharted waters of digital marketing. Advertisers must be able to analyze data, accomplish cross-device attribution, and develop effective advertising strategies. This change in the purchasing journeys highlights the requirement for accurate attribution of the digital consumer's path, starting with product awareness, purchase consideration, loyalty to the product, and product advocacy.
Market Restraining Factors
Concerns regarding privacy & security
As the use of SMAC technology has increased, companies require more rigorous security and privacy measures to prevent breaches, which, if not taken properly, can have a negative impact on the success of digitalization. As the amount of client data increases, so do the number of security & privacy concerns, making them increasingly vulnerable to hacker attacks. Data privacy & security is a crucial concerns that must be adequately addressed. Additional security concerns, such as account hijacking, insider threats, insecure Application Programming Interfaces (APIs), malware injections, shared vulnerabilities, and data loss, are more common in cloud-based marketing automation software.
Type Outlook
Based on type, the marketing attribution software market is segmented into multi-source attribution, probabilistic or algorithmic attribution, and single-source attribution. The probabilistic or algorithmic attribution segment covered a considerable revenue share in the marketing attribution software market in 2021. The segment's rise can be linked to the capacity of probabilistic or algorithmic attribution models to analyze, convert, and disqualify consumer trips. In addition, it helps determine which marketing channels have the highest impact and significance at various touch points along the customer journey.
Organization Size Outlook
By organization Size, the marketing attribution software market is bifurcated into large enterprises and small & medium-sized enterprises. The SMEs segment garnered a substantial revenue share in the marketing attribution software market in 2021. The segment's growth can be attributed to the global increase in the number of government programs, including digital SME marketing efforts.
Vertical Outlook
On the basis of vertical, the marketing attribution software market is segmented into consumer goods & retail, IT & telecom, BFSI, media & entertainment, healthcare, travel & hospitality, and others. In 2021, the travel & hospitality segment procured a promising growth rate in the marketing attribution software market. With attribution, hotel brands can establish the value of the social initiative's reach and whether the investments in this area yield the appropriate return regarding room nights and revenue. In addition, the hotel marketer can comprehend how different types of social investments and individual campaigns within various networks have fundamentally distinct ROI characteristics.
Component Outlook
Based on component, the marketing attribution software market is fragmented into solution and service. In 2021, the solution segment generated the maximum revenue share in the marketing attribution software market. Businesses frequently employ a multi-channel strategy for marketing and create marketing campaigns specific to each level of the funnel. Models of marketing attribution quantify the impact of digital campaign expenditures on business results. To aid firms, marketing attribution solutions assess channels according to their value to them. They also comprehend marketing channels.
Deployment Mode Outlook
Based on deployment mode, the marketing attribution software market is segmented into on-premise and cloud. This can be attributed to the many benefits that come with on-premise deployment, including a high level of data protection and safety. Because on-premise deployment models have higher data security and fewer data breaches than cloud-based deployment models, industries prefer them, which fuels industry demand for on-premise deployment models.
Regional Outlook
Region wise, the marketing attribution software market is analyzed across North America, Europe, Asia Pacific, and LAMEA. In 2021, the North America region led the marketing attribution software market by generating the largest revenue share. In the BFSI, tourism, healthcare, and other industries, marketing attribution software solutions are being utilized increasingly frequently to enhance organizations and the customer experience. The market for marketing attribution software in North America is anticipated to benefit from these lucrative growth potentials
The market research report covers the analysis of key stake holders of the market. Key companies profiled in the report include Oracle Corporation, Google LLC (Alphabet, Inc.), SAP SE, Adobe, Inc., Merkle Inc. (Dentsu Group Inc.), Neustar, Inc. (TransUnion LLC), HubSpot, Inc., Nielsen Holdings plc (Elliott Investment Management L.P.), Ruler Analytics Limited, and Windsor Group AG
Scope of the Study
Market Segments covered in the Report:
By Component
- Solution
- Services
By Type
- Multi-source Attribution
- Probabilistic or Algorithmic Attribution
- Single-source Attribution
By Deployment Mode
- On-premises
- Cloud
By Organization Size
- Large Enterprises
- Small & Medium Enterprises (SMEs)
By Vertical
- Consumer Goods & Retail
- BFSI
- Telecom & IT
- Healthcare
- Travel & Hospitality
- Media & Entertainment
- Others
By Geography
- North America
- US
- Canada
- Mexico
- Rest of North America
- Europe
- Germany
- UK
- France
- Russia
- Spain
- Italy
- Rest of Europe
- Asia Pacific
- China
- Japan
- India
- South Korea
- Singapore
- Malaysia
- Rest of Asia Pacific
- LAMEA
- Brazil
- Argentina
- UAE
- Saudi Arabia
- South Africa
- Nigeria
- Rest of LAMEA
Companies Profiled
- Oracle Corporation
- Google LLC (Alphabet, Inc.)
- SAP SE
- Adobe, Inc.
- Merkle Inc. (Dentsu Group Inc.)
- Neustar, Inc. (TransUnion LLC)
- HubSpot, Inc.
- Nielsen Holdings plc (Elliott Investment Management L.P.)
- Ruler Analytics Limited
- Windsor Group AG
Unique Offerings from KBV Research
- Exhaustive coverage
- Highest number of market tables and figures
- Subscription based model available
- Guaranteed best price
- Assured post sales research support with 10% customization free
Table of Contents
Chapter 1. Market Scope & Methodology
- 1.1 Market Definition
- 1.2 Objectives
- 1.3 Market Scope
- 1.4 Segmentation
- 1.4.1 Global Marketing Attribution Software Market, by Component
- 1.4.2 Global Marketing Attribution Software Market, by Type
- 1.4.3 Global Marketing Attribution Software Market, by Deployment Mode
- 1.4.4 Global Marketing Attribution Software Market, by Organization Size
- 1.4.5 Global Marketing Attribution Software Market, by Vertical
- 1.4.6 Global Marketing Attribution Software Market, by Geography
- 1.5 Methodology for the research
Chapter 2. Market Overview
- 2.1 Introduction
- 2.1.1 Overview
- 2.1.1.1 Market Composition and Scenario
- 2.1.1 Overview
- 2.2 Key Factors Impacting the Market
- 2.2.1 Market Drivers
- 2.2.2 Market Restraints
Chapter 3. Competition Analysis - Global
- 3.1 Market Share Analysis, 2021
Chapter 4. Global Marketing Attribution Software Market by Component
- 4.1 Global Solution Market by Region
- 4.2 Global Services Market by Region
Chapter 5. Global Marketing Attribution Software Market by Type
- 5.1 Global Multi-source Attribution Market by Region
- 5.2 Global Probabilistic or Algorithmic Attribution Market by Region
- 5.3 Global Single-source Attribution Market by Region
Chapter 6. Global Marketing Attribution Software Market by Deployment Mode
- 6.1 Global On-premises Market by Region
- 6.2 Global Cloud Market by Region
Chapter 7. Global Marketing Attribution Software Market by Organization Size
- 7.1 Global Large Enterprises Market by Region
- 7.2 Global Small & Medium Enterprises (SMEs) Market by Region
Chapter 8. Global Marketing Attribution Software Market by Vertical
- 8.1 Global Consumer Goods & Retail Market by Region
- 8.2 Global BFSI Market by Region
- 8.3 Global Telecom & IT Market by Region
- 8.4 Global Healthcare Market by Region
- 8.5 Global Travel & Hospitality Market by Region
- 8.6 Global Media & Entertainment Market by Region
- 8.7 Global Others Market by Region
Chapter 9. Global Marketing Attribution Software Market by Region
- 9.1 North America Marketing Attribution Software Market
- 9.1.1 North America Marketing Attribution Software Market by Component
- 9.1.1.1 North America Solution Market by Country
- 9.1.1.2 North America Services Market by Country
- 9.1.2 North America Marketing Attribution Software Market by Type
- 9.1.2.1 North America Multi-source Attribution Market by Country
- 9.1.2.2 North America Probabilistic or Algorithmic Attribution Market by Country
- 9.1.2.3 North America Single-source Attribution Market by Country
- 9.1.3 North America Marketing Attribution Software Market by Deployment Mode
- 9.1.3.1 North America On-premises Market by Country
- 9.1.3.2 North America Cloud Market by Country
- 9.1.4 North America Marketing Attribution Software Market by Organization Size
- 9.1.4.1 North America Large Enterprises Market by Country
- 9.1.4.2 North America Small & Medium Enterprises (SMEs) Market by Country
- 9.1.5 North America Marketing Attribution Software Market by Vertical
- 9.1.5.1 North America Consumer Goods & Retail Market by Country
- 9.1.5.2 North America BFSI Market by Country
- 9.1.5.3 North America Telecom & IT Market by Country
- 9.1.5.4 North America Healthcare Market by Country
- 9.1.5.5 North America Travel & Hospitality Market by Country
- 9.1.5.6 North America Media & Entertainment Market by Country
- 9.1.5.7 North America Others Market by Country
- 9.1.6 North America Marketing Attribution Software Market by Country
- 9.1.6.1 US Marketing Attribution Software Market
- 9.1.6.1.1 US Marketing Attribution Software Market by Component
- 9.1.6.1.2 US Marketing Attribution Software Market by Type
- 9.1.6.1.3 US Marketing Attribution Software Market by Deployment Mode
- 9.1.6.1.4 US Marketing Attribution Software Market by Organization Size
- 9.1.6.1.5 US Marketing Attribution Software Market by Vertical
- 9.1.6.2 Canada Marketing Attribution Software Market
- 9.1.6.2.1 Canada Marketing Attribution Software Market by Component
- 9.1.6.2.2 Canada Marketing Attribution Software Market by Type
- 9.1.6.2.3 Canada Marketing Attribution Software Market by Deployment Mode
- 9.1.6.2.4 Canada Marketing Attribution Software Market by Organization Size
- 9.1.6.2.5 Canada Marketing Attribution Software Market by Vertical
- 9.1.6.3 Mexico Marketing Attribution Software Market
- 9.1.6.3.1 Mexico Marketing Attribution Software Market by Component
- 9.1.6.3.2 Mexico Marketing Attribution Software Market by Type
- 9.1.6.3.3 Mexico Marketing Attribution Software Market by Deployment Mode
- 9.1.6.3.4 Mexico Marketing Attribution Software Market by Organization Size
- 9.1.6.3.5 Mexico Marketing Attribution Software Market by Vertical
- 9.1.6.4 Rest of North America Marketing Attribution Software Market
- 9.1.6.4.1 Rest of North America Marketing Attribution Software Market by Component
- 9.1.6.4.2 Rest of North America Marketing Attribution Software Market by Type
- 9.1.6.4.3 Rest of North America Marketing Attribution Software Market by Deployment Mode
- 9.1.6.4.4 Rest of North America Marketing Attribution Software Market by Organization Size
- 9.1.6.4.5 Rest of North America Marketing Attribution Software Market by Vertical
- 9.1.6.1 US Marketing Attribution Software Market
- 9.1.1 North America Marketing Attribution Software Market by Component
- 9.2 Europe Marketing Attribution Software Market
- 9.2.1 Europe Marketing Attribution Software Market by Component
- 9.2.1.1 Europe Solution Market by Country
- 9.2.1.2 Europe Services Market by Country
- 9.2.2 Europe Marketing Attribution Software Market by Type
- 9.2.2.1 Europe Multi-source Attribution Market by Country
- 9.2.2.2 Europe Probabilistic or Algorithmic Attribution Market by Country
- 9.2.2.3 Europe Single-source Attribution Market by Country
- 9.2.3 Europe Marketing Attribution Software Market by Deployment Mode
- 9.2.3.1 Europe On-premises Market by Country
- 9.2.3.2 Europe Cloud Market by Country
- 9.2.4 Europe Marketing Attribution Software Market by Organization Size
- 9.2.4.1 Europe Large Enterprises Market by Country
- 9.2.4.2 Europe Small & Medium Enterprises (SMEs) Market by Country
- 9.2.5 Europe Marketing Attribution Software Market by Vertical
- 9.2.5.1 Europe Consumer Goods & Retail Market by Country
- 9.2.5.2 Europe BFSI Market by Country
- 9.2.5.3 Europe Telecom & IT Market by Country
- 9.2.5.4 Europe Healthcare Market by Country
- 9.2.5.5 Europe Travel & Hospitality Market by Country
- 9.2.5.6 Europe Media & Entertainment Market by Country
- 9.2.5.7 Europe Others Market by Country
- 9.2.6 Europe Marketing Attribution Software Market by Country
- 9.2.6.1 Germany Marketing Attribution Software Market
- 9.2.6.1.1 Germany Marketing Attribution Software Market by Component
- 9.2.6.1.2 Germany Marketing Attribution Software Market by Type
- 9.2.6.1.3 Germany Marketing Attribution Software Market by Deployment Mode
- 9.2.6.1.4 Germany Marketing Attribution Software Market by Organization Size
- 9.2.6.1.5 Germany Marketing Attribution Software Market by Vertical
- 9.2.6.2 UK Marketing Attribution Software Market
- 9.2.6.2.1 UK Marketing Attribution Software Market by Component
- 9.2.6.2.2 UK Marketing Attribution Software Market by Type
- 9.2.6.2.3 UK Marketing Attribution Software Market by Deployment Mode
- 9.2.6.2.4 UK Marketing Attribution Software Market by Organization Size
- 9.2.6.2.5 UK Marketing Attribution Software Market by Vertical
- 9.2.6.3 France Marketing Attribution Software Market
- 9.2.6.3.1 France Marketing Attribution Software Market by Component
- 9.2.6.3.2 France Marketing Attribution Software Market by Type
- 9.2.6.3.3 France Marketing Attribution Software Market by Deployment Mode
- 9.2.6.3.4 France Marketing Attribution Software Market by Organization Size
- 9.2.6.3.5 France Marketing Attribution Software Market by Vertical
- 9.2.6.4 Russia Marketing Attribution Software Market
- 9.2.6.4.1 Russia Marketing Attribution Software Market by Component
- 9.2.6.4.2 Russia Marketing Attribution Software Market by Type
- 9.2.6.4.3 Russia Marketing Attribution Software Market by Deployment Mode
- 9.2.6.4.4 Russia Marketing Attribution Software Market by Organization Size
- 9.2.6.4.5 Russia Marketing Attribution Software Market by Vertical
- 9.2.6.5 Spain Marketing Attribution Software Market
- 9.2.6.5.1 Spain Marketing Attribution Software Market by Component
- 9.2.6.5.2 Spain Marketing Attribution Software Market by Type
- 9.2.6.5.3 Spain Marketing Attribution Software Market by Deployment Mode
- 9.2.6.5.4 Spain Marketing Attribution Software Market by Organization Size
- 9.2.6.5.5 Spain Marketing Attribution Software Market by Vertical
- 9.2.6.6 Italy Marketing Attribution Software Market
- 9.2.6.6.1 Italy Marketing Attribution Software Market by Component
- 9.2.6.6.2 Italy Marketing Attribution Software Market by Type
- 9.2.6.6.3 Italy Marketing Attribution Software Market by Deployment Mode
- 9.2.6.6.4 Italy Marketing Attribution Software Market by Organization Size
- 9.2.6.6.5 Italy Marketing Attribution Software Market by Vertical
- 9.2.6.7 Rest of Europe Marketing Attribution Software Market
- 9.2.6.7.1 Rest of Europe Marketing Attribution Software Market by Component
- 9.2.6.7.2 Rest of Europe Marketing Attribution Software Market by Type
- 9.2.6.7.3 Rest of Europe Marketing Attribution Software Market by Deployment Mode
- 9.2.6.7.4 Rest of Europe Marketing Attribution Software Market by Organization Size
- 9.2.6.7.5 Rest of Europe Marketing Attribution Software Market by Vertical
- 9.2.6.1 Germany Marketing Attribution Software Market
- 9.2.1 Europe Marketing Attribution Software Market by Component
- 9.3 Asia Pacific Marketing Attribution Software Market
- 9.3.1 Asia Pacific Marketing Attribution Software Market by Component
- 9.3.1.1 Asia Pacific Solution Market by Country
- 9.3.1.2 Asia Pacific Services Market by Country
- 9.3.2 Asia Pacific Marketing Attribution Software Market by Type
- 9.3.2.1 Asia Pacific Multi-source Attribution Market by Country
- 9.3.2.2 Asia Pacific Probabilistic or Algorithmic Attribution Market by Country
- 9.3.2.3 Asia Pacific Single-source Attribution Market by Country
- 9.3.3 Asia Pacific Marketing Attribution Software Market by Deployment Mode
- 9.3.3.1 Asia Pacific On-premises Market by Country
- 9.3.3.2 Asia Pacific Cloud Market by Country
- 9.3.4 Asia Pacific Marketing Attribution Software Market by Organization Size
- 9.3.4.1 Asia Pacific Large Enterprises Market by Country
- 9.3.4.2 Asia Pacific Small & Medium Enterprises (SMEs) Market by Country
- 9.3.5 Asia Pacific Marketing Attribution Software Market by Vertical
- 9.3.5.1 Asia Pacific Consumer Goods & Retail Market by Country
- 9.3.5.2 Asia Pacific BFSI Market by Country
- 9.3.5.3 Asia Pacific Telecom & IT Market by Country
- 9.3.5.4 Asia Pacific Healthcare Market by Country
- 9.3.5.5 Asia Pacific Travel & Hospitality Market by Country
- 9.3.5.6 Asia Pacific Media & Entertainment Market by Country
- 9.3.5.7 Asia Pacific Others Market by Country
- 9.3.6 Asia Pacific Marketing Attribution Software Market by Country
- 9.3.6.1 China Marketing Attribution Software Market
- 9.3.6.1.1 China Marketing Attribution Software Market by Component
- 9.3.6.1.2 China Marketing Attribution Software Market by Type
- 9.3.6.1.3 China Marketing Attribution Software Market by Deployment Mode
- 9.3.6.1.4 China Marketing Attribution Software Market by Organization Size
- 9.3.6.1.5 China Marketing Attribution Software Market by Vertical
- 9.3.6.2 Japan Marketing Attribution Software Market
- 9.3.6.2.1 Japan Marketing Attribution Software Market by Component
- 9.3.6.2.2 Japan Marketing Attribution Software Market by Type
- 9.3.6.2.3 Japan Marketing Attribution Software Market by Deployment Mode
- 9.3.6.2.4 Japan Marketing Attribution Software Market by Organization Size
- 9.3.6.2.5 Japan Marketing Attribution Software Market by Vertical
- 9.3.6.3 India Marketing Attribution Software Market
- 9.3.6.3.1 India Marketing Attribution Software Market by Component
- 9.3.6.3.2 India Marketing Attribution Software Market by Type
- 9.3.6.3.3 India Marketing Attribution Software Market by Deployment Mode
- 9.3.6.3.4 India Marketing Attribution Software Market by Organization Size
- 9.3.6.3.5 India Marketing Attribution Software Market by Vertical
- 9.3.6.4 South Korea Marketing Attribution Software Market
- 9.3.6.4.1 South Korea Marketing Attribution Software Market by Component
- 9.3.6.4.2 South Korea Marketing Attribution Software Market by Type
- 9.3.6.4.3 South Korea Marketing Attribution Software Market by Deployment Mode
- 9.3.6.4.4 South Korea Marketing Attribution Software Market by Organization Size
- 9.3.6.4.5 South Korea Marketing Attribution Software Market by Vertical
- 9.3.6.5 Singapore Marketing Attribution Software Market
- 9.3.6.5.1 Singapore Marketing Attribution Software Market by Component
- 9.3.6.5.2 Singapore Marketing Attribution Software Market by Type
- 9.3.6.5.3 Singapore Marketing Attribution Software Market by Deployment Mode
- 9.3.6.5.4 Singapore Marketing Attribution Software Market by Organization Size
- 9.3.6.5.5 Singapore Marketing Attribution Software Market by Vertical
- 9.3.6.6 Malaysia Marketing Attribution Software Market
- 9.3.6.6.1 Malaysia Marketing Attribution Software Market by Component
- 9.3.6.6.2 Malaysia Marketing Attribution Software Market by Type
- 9.3.6.6.3 Malaysia Marketing Attribution Software Market by Deployment Mode
- 9.3.6.6.4 Malaysia Marketing Attribution Software Market by Organization Size
- 9.3.6.6.5 Malaysia Marketing Attribution Software Market by Vertical
- 9.3.6.7 Rest of Asia Pacific Marketing Attribution Software Market
- 9.3.6.7.1 Rest of Asia Pacific Marketing Attribution Software Market by Component
- 9.3.6.7.2 Rest of Asia Pacific Marketing Attribution Software Market by Type
- 9.3.6.7.3 Rest of Asia Pacific Marketing Attribution Software Market by Deployment Mode
- 9.3.6.7.4 Rest of Asia Pacific Marketing Attribution Software Market by Organization Size
- 9.3.6.7.5 Rest of Asia Pacific Marketing Attribution Software Market by Vertical
- 9.3.6.1 China Marketing Attribution Software Market
- 9.3.1 Asia Pacific Marketing Attribution Software Market by Component
- 9.4 LAMEA Marketing Attribution Software Market
- 9.4.1 LAMEA Marketing Attribution Software Market by Component
- 9.4.1.1 LAMEA Solution Market by Country
- 9.4.1.2 LAMEA Services Market by Country
- 9.4.2 LAMEA Marketing Attribution Software Market by Type
- 9.4.2.1 LAMEA Multi-source Attribution Market by Country
- 9.4.2.2 LAMEA Probabilistic or Algorithmic Attribution Market by Country
- 9.4.2.3 LAMEA Single-source Attribution Market by Country
- 9.4.3 LAMEA Marketing Attribution Software Market by Deployment Mode
- 9.4.3.1 LAMEA On-premises Market by Country
- 9.4.3.2 LAMEA Cloud Market by Country
- 9.4.4 LAMEA Marketing Attribution Software Market by Organization Size
- 9.4.4.1 LAMEA Large Enterprises Market by Country
- 9.4.4.2 LAMEA Small & Medium Enterprises (SMEs) Market by Country
- 9.4.5 LAMEA Marketing Attribution Software Market by Vertical
- 9.4.5.1 LAMEA Consumer Goods & Retail Market by Country
- 9.4.5.2 LAMEA BFSI Market by Country
- 9.4.5.3 LAMEA Telecom & IT Market by Country
- 9.4.5.4 LAMEA Healthcare Market by Country
- 9.4.5.5 LAMEA Travel & Hospitality Market by Country
- 9.4.5.6 LAMEA Media & Entertainment Market by Country
- 9.4.5.7 LAMEA Others Market by Country
- 9.4.6 LAMEA Marketing Attribution Software Market by Country
- 9.4.6.1 Brazil Marketing Attribution Software Market
- 9.4.6.1.1 Brazil Marketing Attribution Software Market by Component
- 9.4.6.1.2 Brazil Marketing Attribution Software Market by Type
- 9.4.6.1.3 Brazil Marketing Attribution Software Market by Deployment Mode
- 9.4.6.1.4 Brazil Marketing Attribution Software Market by Organization Size
- 9.4.6.1.5 Brazil Marketing Attribution Software Market by Vertical
- 9.4.6.2 Argentina Marketing Attribution Software Market
- 9.4.6.2.1 Argentina Marketing Attribution Software Market by Component
- 9.4.6.2.2 Argentina Marketing Attribution Software Market by Type
- 9.4.6.2.3 Argentina Marketing Attribution Software Market by Deployment Mode
- 9.4.6.2.4 Argentina Marketing Attribution Software Market by Organization Size
- 9.4.6.2.5 Argentina Marketing Attribution Software Market by Vertical
- 9.4.6.3 UAE Marketing Attribution Software Market
- 9.4.6.3.1 UAE Marketing Attribution Software Market by Component
- 9.4.6.3.2 UAE Marketing Attribution Software Market by Type
- 9.4.6.3.3 UAE Marketing Attribution Software Market by Deployment Mode
- 9.4.6.3.4 UAE Marketing Attribution Software Market by Organization Size
- 9.4.6.3.5 UAE Marketing Attribution Software Market by Vertical
- 9.4.6.4 Saudi Arabia Marketing Attribution Software Market
- 9.4.6.4.1 Saudi Arabia Marketing Attribution Software Market by Component
- 9.4.6.4.2 Saudi Arabia Marketing Attribution Software Market by Type
- 9.4.6.4.3 Saudi Arabia Marketing Attribution Software Market by Deployment Mode
- 9.4.6.4.4 Saudi Arabia Marketing Attribution Software Market by Organization Size
- 9.4.6.4.5 Saudi Arabia Marketing Attribution Software Market by Vertical
- 9.4.6.5 South Africa Marketing Attribution Software Market
- 9.4.6.5.1 South Africa Marketing Attribution Software Market by Component
- 9.4.6.5.2 South Africa Marketing Attribution Software Market by Type
- 9.4.6.5.3 South Africa Marketing Attribution Software Market by Deployment Mode
- 9.4.6.5.4 South Africa Marketing Attribution Software Market by Organization Size
- 9.4.6.5.5 South Africa Marketing Attribution Software Market by Vertical
- 9.4.6.6 Nigeria Marketing Attribution Software Market
- 9.4.6.6.1 Nigeria Marketing Attribution Software Market by Component
- 9.4.6.6.2 Nigeria Marketing Attribution Software Market by Type
- 9.4.6.6.3 Nigeria Marketing Attribution Software Market by Deployment Mode
- 9.4.6.6.4 Nigeria Marketing Attribution Software Market by Organization Size
- 9.4.6.6.5 Nigeria Marketing Attribution Software Market by Vertical
- 9.4.6.7 Rest of LAMEA Marketing Attribution Software Market
- 9.4.6.7.1 Rest of LAMEA Marketing Attribution Software Market by Component
- 9.4.6.7.2 Rest of LAMEA Marketing Attribution Software Market by Type
- 9.4.6.7.3 Rest of LAMEA Marketing Attribution Software Market by Deployment Mode
- 9.4.6.7.4 Rest of LAMEA Marketing Attribution Software Market by Organization Size
- 9.4.6.7.5 Rest of LAMEA Marketing Attribution Software Market by Vertical
- 9.4.6.1 Brazil Marketing Attribution Software Market
- 9.4.1 LAMEA Marketing Attribution Software Market by Component
Chapter 10. Company Profiles
- 10.1 Oracle Corporation
- 10.1.1 Company Overview
- 10.1.2 Financial Analysis
- 10.1.3 Segmental and Regional Analysis
- 10.1.4 Research & Development Expense
- 10.1.5 Recent strategies and developments:
- 10.1.5.1 Partnerships, Collaborations, and Agreements:
- 10.1.6 SWOT Analysis
- 10.2 Google LLC (Alphabet, Inc.)
- 10.2.1 Company Overview
- 10.2.2 Financial Analysis
- 10.2.3 Segmental and Regional Analysis
- 10.2.4 Research & Development Expense
- 10.2.5 SWOT Analysis
- 10.3 SAP SE
- 10.3.1 Company Overview
- 10.3.2 Financial Analysis
- 10.3.3 Segmental and Regional Analysis
- 10.3.4 Research & Development Expense
- 10.3.5 SWOT Analysis
- 10.4 Adobe, Inc.
- 10.4.1 Company Overview
- 10.4.2 Financial Analysis
- 10.4.3 Segmental and Regional Analysis
- 10.4.4 Research & Development Expense
- 10.4.5 Recent strategies and developments:
- 10.4.5.1 Acquisition and Mergers:
- 10.5 Merkle Inc. (Dentsu Group Inc.)
- 10.5.1 Company Overview
- 10.5.2 Financial Analysis
- 10.5.3 Recent strategies and developments:
- 10.5.3.1 Product Launches and Product Expansions:
- 10.6 Neustar, Inc. (TransUnion LLC)
- 10.6.1 Company Overview
- 10.6.2 Financial Analysis
- 10.6.3 Segmental Analysis
- 10.7 HubSpot, Inc.
- 10.7.1 Company Overview
- 10.7.2 Financial Analysis
- 10.7.3 Regional Analysis
- 10.7.4 Research & Development Expense
- 10.8 Nielsen Holdings plc (Elliott Investment Management L.P.)
- 10.8.1 Company Overview
- 10.8.2 Financial Analysis
- 10.8.3 Regional Analysis
- 10.9 Ruler Analytics Limited
- 10.9.1 Company Overview
- 10.10. Windsor Group AG
- 10.10.1 Company Overview