|
|
市場調査レポート
商品コード
1219650
食品用ロボットの世界市場規模、シェア、産業動向分析レポート:アプリケーション別(パレタイジング&加工、包装、再包装、ピック&プレース、その他)、ペイロード別、タイプ別、地域別展望と予測、2022年~2028年Global Food Robotics Market Size, Share & Industry Trends Analysis Report By Application (Palletizing & Processing, Packaging, Repackaging, Pick & Place, and Others), By Payload, By Type, By Regional Outlook and Forecast, 2022 - 2028 |
||||||
|
|
|||||||


| 食品用ロボットの世界市場規模、シェア、産業動向分析レポート:アプリケーション別(パレタイジング&加工、包装、再包装、ピック&プレース、その他)、ペイロード別、タイプ別、地域別展望と予測、2022年~2028年 |
|
出版日: 2023年01月31日
発行: KBV Research
ページ情報: 英文 239 Pages
納期: 即納可能
|
- 全表示
- 概要
- 図表
- 目次
食品ロボットの世界市場規模は、予測期間中にCAGR10.2%で成長し、2028年には40億米ドルに達すると予測されています。
さらに、最近では、収穫や除草のためのロボットとともに、自動運転トラクターも存在しています。ロボット工学は、非植物性農業の酪農、養鶏、牛の生産部門にも導入されています。自給自足の搾乳や給餌、採卵や選別、自給自足の洗浄などの用途があります。元々、重い金属部品を持ち上げるために開発されたにもかかわらず、現代の技術は、パン、チーズ、果物などの繊細なものを傷つけることなくピックアップすることができます。
食品を製造するメーカーは、製品だけでなく消費者の需要にも目を配り、データ分析によってこのニーズに合わせた出力を行うことができるようになっています。ロボット工学とAIソフトウェアの作成がこれを可能にします。企業は、出荷、加工、保管などの重要なプロセスや、食品が誤って汚染されていないか、その食品がどこに出荷されたか、その食品がどこから入手されたかを評価する能力が高まれば、食品の品質と安全性をよりよく監視することができます。最近、大手外食企業数社がロボットと人工知能に投資しています。
COVID-19の影響分析
COVID-19のパンデミックは、著しい経済不況をもたらしました。いくつかの国がウイルスを封じ込めるために厳しい封鎖を実施し、飲食品(F&B)加工施設の閉鎖とF&Bサプライチェーンの一時的な中断を引き起こしました。飲食料品や生活必需品の欠品、世界中の消費者のパニック買い、旅行制限によるサプライチェーンの混乱、労働力不足は、飲食料品のサプライチェーンに大きな影響を与えました。主要なロボットメーカーは、2020年上半期に景気後退による売上高の減少を報告しました。これは、世界各国の政府による検疫や封鎖の制限、自動化需要の一時的な減少によってもたらされたものです。
市場の成長要因
パッケージ食品の需要拡大
近年、調理済み食品や食べかけの食品に対するニーズが高まっており、保存期間を延ばし、消費者の需要に応えるために食品の包装が必要になっています。包装された食品の大量生産は、特に米国、日本、フランス、イタリアなどの国々で食品ロボットの市場を押し上げています。大規模な食品製造工場の多くは、品質と在庫管理単位(SKU)の一貫性を保証するために、手順を自動化しています。農業や食品製造の作業は、ロボットによる自動化がより困難であるにもかかわらず、企業はロボットを導入し続けています。その結果、パッケージ化された乳製品や焼き菓子産業の拡大も、これらの製品が地域を越えて大量生産されていることから、食品ロボット市場を牽引しています。
飲食品業界におけるデジタル化の進展
デジタル化とは、IT/OT融合、ビッグデータ解析、デジタルツイン、3Dプリンティング、人工知能、自動化技術など、新たなデジタル技術によって企業運営を最適化することです。IoTやAIは、高いレベルの食品安全の実現、食品トレーサビリティの強化、食品廃棄物の削減、食品加工・包装関連のコストやリスクの低減などで企業を支援しています。近年、デジタル化は自動化の重要な推進力として浮上しており、人工知能(AI)は労働力の生産性を高めることで業務の生産性を押し上げます。したがって、F&B業界全体でデジタル化の採用が進んでいることが、今後数年間の食品ロボティクス市場の成長を推進することになります。
市場の抑制要因
ロボットシステムのインストールにかかる高いコスト
追加の設置費用のため、ほとんどの飲食品事業者は自動化手順の導入に消極的です。安全バリア、センサー、プログラマブルロジックコントローラー(PLC)、ヒューマンマシンインターフェース(HMI)、安全システムなどの周辺機器を含む包括的なロボットシステムに個々のロボットを統合するための余分なコストが市場拡大の妨げになっています。また、エンジニアリング費用には、設置、プログラミング、試運転などが含まれます。このような費用の増大が、市場の成長を制限しています。中小規模の製造業では、投資回収期間を遅らせ、運用コストをさらに増加させる可能性があるため、最初から多額の設置費用を負担することにためらいがあります。
アプリケーションの展望
食品ロボット市場は、用途別にパレタイジング&加工、パッケージング、リパッケージング、ピック&プレイス、その他に分類されます。2021年には、パレタイジング&プロセシングセグメントが食品ロボティクス市場を独占し、最大収益シェアを獲得しました。ロボットパレタイジングは、スループットの向上、品質の改善、作業員の労働条件の改善など、迅速かつ効果的な作業を実現します。ロボットは、ケース、袋、木箱のいずれにもグリッパーを使用し、人と一緒に操作して生産量を増やします。現在の製造ラインにスムーズに組み込むことができます。食肉加工に関わる多くの作業は、人間が行うのがベストではありません。
ペイロードの展望
ペイロードに基づいて、食品ロボティクス市場は、低、中、高に細分化されます。低セグメントは、2021年の食品ロボット市場で顕著な収益シェアをカバーしました。利用可能なスカラ食品ロボットの多くは、物体のピッキングがかなり単純な作業と考えられているため、低可搬質量カテゴリに分類されます。食品ハンドリング、ピックアンドプレース、パッケージング&パレタイジング、シーリング、ラベリング、スプレーなどの専門知識が、このセグメントの爆発的拡大の大きな要因です。
タイプ別展望
食品ロボット市場は、タイプ別に、多関節型、直交型、スカラ型、円筒型、協働型、その他に区分されます。2021年の食品ロボット市場では、SCARAセグメントが突出した収益シェアを獲得しました。選択的コンプライアンス多関節ロボットアーム(SCARA)ロボットは、ピックアンドプレース用途を想定しており、比較的高速で高精度を有しています。SCARAロボットは、多くの自動組立アプリケーションを簡単かつ適応的に解決することができます。食品用ロボットの利用が拡大し、需要が高まっています。
地域別の展望
地域別では、食品ロボット市場は、北米、欧州、アジア太平洋、LAMEAで分析されています。2021年、アジア太平洋地域は食品ロボット市場で最も高い収益シェアを占めました。この地域における食品ロボティクス市場の急速な拡大は、食品の安全性やライフスタイルに対する懸念の高まりから、人口が調理済み食品やパッケージ食品にシフトしていることに起因しています。この地域では、消費者所得の増加により、ハイテク包装食品と飲食品への欲求に拍車がかかっています。アジア太平洋地域では、中国が食品ロボット導入の標準を設定する国としてよく知られています。
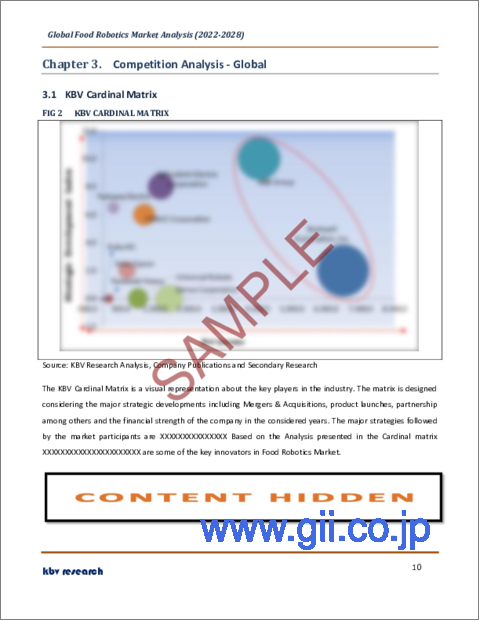
市場参入企業がとっている主な戦略は、製品立ち上げです。カーディナルマトリックスで提示された分析に基づいて、ロックウェルオートメーション社、ABBグループは、食品ロボット市場の先駆者です。三菱電機株式会社、ファナック株式会社、株式会社デンソーなどの企業は、食品ロボット市場の主要な革新者の一部です。
目次
第1章 市場の範囲と調査手法
- 市場の定義
- 目的
- 市場規模
- セグメンテーション
- 食品用ロボットの世界市場、用途別
- 食品用ロボットの世界市場、ペイロード別
- 食品用ロボットの世界市場、タイプ別
- 食品用ロボットの世界市場、地域別
- 調査手法
第2章 市場概要
- イントロダクション
- 概要の説明
- 市場の構成とシナリオ
- 概要の説明
- 市場に影響を与える主な要因
- 市場促進要因
- 市場の抑制要因
第3章 競合分析-世界
- KBVカーディナルマトリックス
- 最近の業界全体の戦略的展開
- パートナーシップ、コラボレーション、契約
- 製品上市と製品拡張
- 買収と合併
- 地理的拡大
- 主要成功戦略
- 主要なリーディング戦略:割合の分布(2018-2022)
- 主要な戦略的動き:(製品発表と製品拡張:2020年、8月~2022年、10月)主要なプレーヤーたち
第4章 食品ロボットの世界市場:アプリケーション別
- パレタイジング&プロセッシングの世界市場:地域別
- パッケージングの世界市場:地域別
- リパッケージングの世界市場:地域別
- ピック&プレイスの世界市場:地域別
- 地域別世界のその他市場
第5章 食品ロボットの世界市場:ペイロード別
- 中型の世界市場:地域別
- 高負荷の世界市場:地域別
- 低速の世界市場:地域別
第6章 食品用ロボットの世界市場:タイプ別
- 多関節型の世界市場:地域別
- 直交型ロボットの世界市場:地域別
- スカラの世界市場:地域別
- 円筒形の世界市場:地域別
- 地域別コラボレーション世界市場
- 地域別世界のその他市場
第7章 フードロボティクスの世界市場地域別
- 北米
- 北米の食品ロボット市場:国別内訳
- 米国
- カナダ
- メキシコ
- その他北米地域
- 北米の食品ロボット市場:国別内訳
- 欧州
- 欧州の食品ロボット市場:国別
- ドイツ
- 英国
- フランス
- ロシア
- スペイン
- イタリア
- その他欧州
- 欧州の食品ロボット市場:国別
- アジア太平洋地域
- アジア太平洋地域の食品用ロボットの国別市場
- 中国
- 日本
- インド
- 韓国
- シンガポール
- マレーシア
- その他アジア太平洋地域
- アジア太平洋地域の食品用ロボットの国別市場
- LAMEA
- LAMEAの食品ロボット市場:国別
- ブラジル
- アルゼンチン
- UAE
- サウジアラビア
- 南アフリカ共和国
- ナイジェリア
- LAMEAの他の地域
- LAMEAの食品ロボット市場:国別
第8章 企業プロファイル
- ABB Group
- Mitsubishi Electric Corporation
- FANUC Corporation
- Yaskawa Electric Corporation
- Rockwell Automation, Inc.
- Universal Robots A/S(Teradyne, Inc.)
- Denso Corporation
- Kawasaki Heavy Industries, Ltd.
- Seiko Epson Corporation
- Kuka AG(Midea Investment Holding Co., Ltd.)
LIST OF TABLES
- TABLE 1 Global Food Robotics Market, 2018 - 2021, USD Million
- TABLE 2 Global Food Robotics Market, 2022 - 2028, USD Million
- TABLE 3 Partnerships, Collaborations and Agreements- Food Robotics Market
- TABLE 4 Product Launches And Product Expansions- Food Robotics Market
- TABLE 5 Acquisition and Mergers- Food Robotics Market
- TABLE 6 Geographical Expansions - Food Robotics Market
- TABLE 7 Global Food Robotics Market by Application, 2018 - 2021, USD Million
- TABLE 8 Global Food Robotics Market by Application, 2022 - 2028, USD Million
- TABLE 9 Global Palletizing & Processing Market by Region, 2018 - 2021, USD Million
- TABLE 10 Global Palletizing & Processing Market by Region, 2022 - 2028, USD Million
- TABLE 11 Global Packaging Market by Region, 2018 - 2021, USD Million
- TABLE 12 Global Packaging Market by Region, 2022 - 2028, USD Million
- TABLE 13 Global Repackaging Market by Region, 2018 - 2021, USD Million
- TABLE 14 Global Repackaging Market by Region, 2022 - 2028, USD Million
- TABLE 15 Global Pick & Place Market by Region, 2018 - 2021, USD Million
- TABLE 16 Global Pick & Place Market by Region, 2022 - 2028, USD Million
- TABLE 17 Global Others Market by Region, 2018 - 2021, USD Million
- TABLE 18 Global Others Market by Region, 2022 - 2028, USD Million
- TABLE 19 Global Food Robotics Market by Payload, 2018 - 2021, USD Million
- TABLE 20 Global Food Robotics Market by Payload, 2022 - 2028, USD Million
- TABLE 21 Global Medium Market by Region, 2018 - 2021, USD Million
- TABLE 22 Global Medium Market by Region, 2022 - 2028, USD Million
- TABLE 23 Global High Market by Region, 2018 - 2021, USD Million
- TABLE 24 Global High Market by Region, 2022 - 2028, USD Million
- TABLE 25 Global Low Market by Region, 2018 - 2021, USD Million
- TABLE 26 Global Low Market by Region, 2022 - 2028, USD Million
- TABLE 27 Global Food Robotics Market by Type, 2018 - 2021, USD Million
- TABLE 28 Global Food Robotics Market by Type, 2022 - 2028, USD Million
- TABLE 29 Global Articulated Market by Region, 2018 - 2021, USD Million
- TABLE 30 Global Articulated Market by Region, 2022 - 2028, USD Million
- TABLE 31 Global Cartesian Market by Region, 2018 - 2021, USD Million
- TABLE 32 Global Cartesian Market by Region, 2022 - 2028, USD Million
- TABLE 33 Global Scara Market by Region, 2018 - 2021, USD Million
- TABLE 34 Global Scara Market by Region, 2022 - 2028, USD Million
- TABLE 35 Global Cylindrical Market by Region, 2018 - 2021, USD Million
- TABLE 36 Global Cylindrical Market by Region, 2022 - 2028, USD Million
- TABLE 37 Global Collaborative Market by Region, 2018 - 2021, USD Million
- TABLE 38 Global Collaborative Market by Region, 2022 - 2028, USD Million
- TABLE 39 Global Others Market by Region, 2018 - 2021, USD Million
- TABLE 40 Global Others Market by Region, 2022 - 2028, USD Million
- TABLE 41 Global Food Robotics Market by Region, 2018 - 2021, USD Million
- TABLE 42 Global Food Robotics Market by Region, 2022 - 2028, USD Million
- TABLE 43 North America Food Robotics Market, 2018 - 2021, USD Million
- TABLE 44 North America Food Robotics Market, 2022 - 2028, USD Million
- TABLE 45 North America Food Robotics Market by Application, 2018 - 2021, USD Million
- TABLE 46 North America Food Robotics Market by Application, 2022 - 2028, USD Million
- TABLE 47 North America Palletizing & Processing Market by Country, 2018 - 2021, USD Million
- TABLE 48 North America Palletizing & Processing Market by Country, 2022 - 2028, USD Million
- TABLE 49 North America Packaging Market by Country, 2018 - 2021, USD Million
- TABLE 50 North America Packaging Market by Country, 2022 - 2028, USD Million
- TABLE 51 North America Repackaging Market by Country, 2018 - 2021, USD Million
- TABLE 52 North America Repackaging Market by Country, 2022 - 2028, USD Million
- TABLE 53 North America Pick & Place Market by Country, 2018 - 2021, USD Million
- TABLE 54 North America Pick & Place Market by Country, 2022 - 2028, USD Million
- TABLE 55 North America Others Market by Country, 2018 - 2021, USD Million
- TABLE 56 North America Others Market by Country, 2022 - 2028, USD Million
- TABLE 57 North America Food Robotics Market by Payload, 2018 - 2021, USD Million
- TABLE 58 North America Food Robotics Market by Payload, 2022 - 2028, USD Million
- TABLE 59 North America Medium Market by Country, 2018 - 2021, USD Million
- TABLE 60 North America Medium Market by Country, 2022 - 2028, USD Million
- TABLE 61 North America High Market by Country, 2018 - 2021, USD Million
- TABLE 62 North America High Market by Country, 2022 - 2028, USD Million
- TABLE 63 North America Low Market by Country, 2018 - 2021, USD Million
- TABLE 64 North America Low Market by Country, 2022 - 2028, USD Million
- TABLE 65 North America Food Robotics Market by Type, 2018 - 2021, USD Million
- TABLE 66 North America Food Robotics Market by Type, 2022 - 2028, USD Million
- TABLE 67 North America Articulated Market by Country, 2018 - 2021, USD Million
- TABLE 68 North America Articulated Market by Country, 2022 - 2028, USD Million
- TABLE 69 North America Cartesian Market by Country, 2018 - 2021, USD Million
- TABLE 70 North America Cartesian Market by Country, 2022 - 2028, USD Million
- TABLE 71 North America Scara Market by Country, 2018 - 2021, USD Million
- TABLE 72 North America Scara Market by Country, 2022 - 2028, USD Million
- TABLE 73 North America Cylindrical Market by Country, 2018 - 2021, USD Million
- TABLE 74 North America Cylindrical Market by Country, 2022 - 2028, USD Million
- TABLE 75 North America Collaborative Market by Country, 2018 - 2021, USD Million
- TABLE 76 North America Collaborative Market by Country, 2022 - 2028, USD Million
- TABLE 77 North America Others Market by Country, 2018 - 2021, USD Million
- TABLE 78 North America Others Market by Country, 2022 - 2028, USD Million
- TABLE 79 North America Food Robotics Market by Country, 2018 - 2021, USD Million
- TABLE 80 North America Food Robotics Market by Country, 2022 - 2028, USD Million
- TABLE 81 US Food Robotics Market, 2018 - 2021, USD Million
- TABLE 82 US Food Robotics Market, 2022 - 2028, USD Million
- TABLE 83 US Food Robotics Market by Application, 2018 - 2021, USD Million
- TABLE 84 US Food Robotics Market by Application, 2022 - 2028, USD Million
- TABLE 85 US Food Robotics Market by Payload, 2018 - 2021, USD Million
- TABLE 86 US Food Robotics Market by Payload, 2022 - 2028, USD Million
- TABLE 87 US Food Robotics Market by Type, 2018 - 2021, USD Million
- TABLE 88 US Food Robotics Market by Type, 2022 - 2028, USD Million
- TABLE 89 Canada Food Robotics Market, 2018 - 2021, USD Million
- TABLE 90 Canada Food Robotics Market, 2022 - 2028, USD Million
- TABLE 91 Canada Food Robotics Market by Application, 2018 - 2021, USD Million
- TABLE 92 Canada Food Robotics Market by Application, 2022 - 2028, USD Million
- TABLE 93 Canada Food Robotics Market by Payload, 2018 - 2021, USD Million
- TABLE 94 Canada Food Robotics Market by Payload, 2022 - 2028, USD Million
- TABLE 95 Canada Food Robotics Market by Type, 2018 - 2021, USD Million
- TABLE 96 Canada Food Robotics Market by Type, 2022 - 2028, USD Million
- TABLE 97 Mexico Food Robotics Market, 2018 - 2021, USD Million
- TABLE 98 Mexico Food Robotics Market, 2022 - 2028, USD Million
- TABLE 99 Mexico Food Robotics Market by Application, 2018 - 2021, USD Million
- TABLE 100 Mexico Food Robotics Market by Application, 2022 - 2028, USD Million
- TABLE 101 Mexico Food Robotics Market by Payload, 2018 - 2021, USD Million
- TABLE 102 Mexico Food Robotics Market by Payload, 2022 - 2028, USD Million
- TABLE 103 Mexico Food Robotics Market by Type, 2018 - 2021, USD Million
- TABLE 104 Mexico Food Robotics Market by Type, 2022 - 2028, USD Million
- TABLE 105 Rest of North America Food Robotics Market, 2018 - 2021, USD Million
- TABLE 106 Rest of North America Food Robotics Market, 2022 - 2028, USD Million
- TABLE 107 Rest of North America Food Robotics Market by Application, 2018 - 2021, USD Million
- TABLE 108 Rest of North America Food Robotics Market by Application, 2022 - 2028, USD Million
- TABLE 109 Rest of North America Food Robotics Market by Payload, 2018 - 2021, USD Million
- TABLE 110 Rest of North America Food Robotics Market by Payload, 2022 - 2028, USD Million
- TABLE 111 Rest of North America Food Robotics Market by Type, 2018 - 2021, USD Million
- TABLE 112 Rest of North America Food Robotics Market by Type, 2022 - 2028, USD Million
- TABLE 113 Europe Food Robotics Market, 2018 - 2021, USD Million
- TABLE 114 Europe Food Robotics Market, 2022 - 2028, USD Million
- TABLE 115 Europe Food Robotics Market by Application, 2018 - 2021, USD Million
- TABLE 116 Europe Food Robotics Market by Application, 2022 - 2028, USD Million
- TABLE 117 Europe Palletizing & Processing Market by Country, 2018 - 2021, USD Million
- TABLE 118 Europe Palletizing & Processing Market by Country, 2022 - 2028, USD Million
- TABLE 119 Europe Packaging Market by Country, 2018 - 2021, USD Million
- TABLE 120 Europe Packaging Market by Country, 2022 - 2028, USD Million
- TABLE 121 Europe Repackaging Market by Country, 2018 - 2021, USD Million
- TABLE 122 Europe Repackaging Market by Country, 2022 - 2028, USD Million
- TABLE 123 Europe Pick & Place Market by Country, 2018 - 2021, USD Million
- TABLE 124 Europe Pick & Place Market by Country, 2022 - 2028, USD Million
- TABLE 125 Europe Others Market by Country, 2018 - 2021, USD Million
- TABLE 126 Europe Others Market by Country, 2022 - 2028, USD Million
- TABLE 127 Europe Food Robotics Market by Payload, 2018 - 2021, USD Million
- TABLE 128 Europe Food Robotics Market by Payload, 2022 - 2028, USD Million
- TABLE 129 Europe Medium Market by Country, 2018 - 2021, USD Million
- TABLE 130 Europe Medium Market by Country, 2022 - 2028, USD Million
- TABLE 131 Europe High Market by Country, 2018 - 2021, USD Million
- TABLE 132 Europe High Market by Country, 2022 - 2028, USD Million
- TABLE 133 Europe Low Market by Country, 2018 - 2021, USD Million
- TABLE 134 Europe Low Market by Country, 2022 - 2028, USD Million
- TABLE 135 Europe Food Robotics Market by Type, 2018 - 2021, USD Million
- TABLE 136 Europe Food Robotics Market by Type, 2022 - 2028, USD Million
- TABLE 137 Europe Articulated Market by Country, 2018 - 2021, USD Million
- TABLE 138 Europe Articulated Market by Country, 2022 - 2028, USD Million
- TABLE 139 Europe Cartesian Market by Country, 2018 - 2021, USD Million
- TABLE 140 Europe Cartesian Market by Country, 2022 - 2028, USD Million
- TABLE 141 Europe Scara Market by Country, 2018 - 2021, USD Million
- TABLE 142 Europe Scara Market by Country, 2022 - 2028, USD Million
- TABLE 143 Europe Cylindrical Market by Country, 2018 - 2021, USD Million
- TABLE 144 Europe Cylindrical Market by Country, 2022 - 2028, USD Million
- TABLE 145 Europe Collaborative Market by Country, 2018 - 2021, USD Million
- TABLE 146 Europe Collaborative Market by Country, 2022 - 2028, USD Million
- TABLE 147 Europe Others Market by Country, 2018 - 2021, USD Million
- TABLE 148 Europe Others Market by Country, 2022 - 2028, USD Million
- TABLE 149 Europe Food Robotics Market by Country, 2018 - 2021, USD Million
- TABLE 150 Europe Food Robotics Market by Country, 2022 - 2028, USD Million
- TABLE 151 Germany Food Robotics Market, 2018 - 2021, USD Million
- TABLE 152 Germany Food Robotics Market, 2022 - 2028, USD Million
- TABLE 153 Germany Food Robotics Market by Application, 2018 - 2021, USD Million
- TABLE 154 Germany Food Robotics Market by Application, 2022 - 2028, USD Million
- TABLE 155 Germany Food Robotics Market by Payload, 2018 - 2021, USD Million
- TABLE 156 Germany Food Robotics Market by Payload, 2022 - 2028, USD Million
- TABLE 157 Germany Food Robotics Market by Type, 2018 - 2021, USD Million
- TABLE 158 Germany Food Robotics Market by Type, 2022 - 2028, USD Million
- TABLE 159 UK Food Robotics Market, 2018 - 2021, USD Million
- TABLE 160 UK Food Robotics Market, 2022 - 2028, USD Million
- TABLE 161 UK Food Robotics Market by Application, 2018 - 2021, USD Million
- TABLE 162 UK Food Robotics Market by Application, 2022 - 2028, USD Million
- TABLE 163 UK Food Robotics Market by Payload, 2018 - 2021, USD Million
- TABLE 164 UK Food Robotics Market by Payload, 2022 - 2028, USD Million
- TABLE 165 UK Food Robotics Market by Type, 2018 - 2021, USD Million
- TABLE 166 UK Food Robotics Market by Type, 2022 - 2028, USD Million
- TABLE 167 France Food Robotics Market, 2018 - 2021, USD Million
- TABLE 168 France Food Robotics Market, 2022 - 2028, USD Million
- TABLE 169 France Food Robotics Market by Application, 2018 - 2021, USD Million
- TABLE 170 France Food Robotics Market by Application, 2022 - 2028, USD Million
- TABLE 171 France Food Robotics Market by Payload, 2018 - 2021, USD Million
- TABLE 172 France Food Robotics Market by Payload, 2022 - 2028, USD Million
- TABLE 173 France Food Robotics Market by Type, 2018 - 2021, USD Million
- TABLE 174 France Food Robotics Market by Type, 2022 - 2028, USD Million
- TABLE 175 Russia Food Robotics Market, 2018 - 2021, USD Million
- TABLE 176 Russia Food Robotics Market, 2022 - 2028, USD Million
- TABLE 177 Russia Food Robotics Market by Application, 2018 - 2021, USD Million
- TABLE 178 Russia Food Robotics Market by Application, 2022 - 2028, USD Million
- TABLE 179 Russia Food Robotics Market by Payload, 2018 - 2021, USD Million
- TABLE 180 Russia Food Robotics Market by Payload, 2022 - 2028, USD Million
- TABLE 181 Russia Food Robotics Market by Type, 2018 - 2021, USD Million
- TABLE 182 Russia Food Robotics Market by Type, 2022 - 2028, USD Million
- TABLE 183 Spain Food Robotics Market, 2018 - 2021, USD Million
- TABLE 184 Spain Food Robotics Market, 2022 - 2028, USD Million
- TABLE 185 Spain Food Robotics Market by Application, 2018 - 2021, USD Million
- TABLE 186 Spain Food Robotics Market by Application, 2022 - 2028, USD Million
- TABLE 187 Spain Food Robotics Market by Payload, 2018 - 2021, USD Million
- TABLE 188 Spain Food Robotics Market by Payload, 2022 - 2028, USD Million
- TABLE 189 Spain Food Robotics Market by Type, 2018 - 2021, USD Million
- TABLE 190 Spain Food Robotics Market by Type, 2022 - 2028, USD Million
- TABLE 191 Italy Food Robotics Market, 2018 - 2021, USD Million
- TABLE 192 Italy Food Robotics Market, 2022 - 2028, USD Million
- TABLE 193 Italy Food Robotics Market by Application, 2018 - 2021, USD Million
- TABLE 194 Italy Food Robotics Market by Application, 2022 - 2028, USD Million
- TABLE 195 Italy Food Robotics Market by Payload, 2018 - 2021, USD Million
- TABLE 196 Italy Food Robotics Market by Payload, 2022 - 2028, USD Million
- TABLE 197 Italy Food Robotics Market by Type, 2018 - 2021, USD Million
- TABLE 198 Italy Food Robotics Market by Type, 2022 - 2028, USD Million
- TABLE 199 Rest of Europe Food Robotics Market, 2018 - 2021, USD Million
- TABLE 200 Rest of Europe Food Robotics Market, 2022 - 2028, USD Million
- TABLE 201 Rest of Europe Food Robotics Market by Application, 2018 - 2021, USD Million
- TABLE 202 Rest of Europe Food Robotics Market by Application, 2022 - 2028, USD Million
- TABLE 203 Rest of Europe Food Robotics Market by Payload, 2018 - 2021, USD Million
- TABLE 204 Rest of Europe Food Robotics Market by Payload, 2022 - 2028, USD Million
- TABLE 205 Rest of Europe Food Robotics Market by Type, 2018 - 2021, USD Million
- TABLE 206 Rest of Europe Food Robotics Market by Type, 2022 - 2028, USD Million
- TABLE 207 Asia Pacific Food Robotics Market, 2018 - 2021, USD Million
- TABLE 208 Asia Pacific Food Robotics Market, 2022 - 2028, USD Million
- TABLE 209 Asia Pacific Food Robotics Market by Application, 2018 - 2021, USD Million
- TABLE 210 Asia Pacific Food Robotics Market by Application, 2022 - 2028, USD Million
- TABLE 211 Asia Pacific Palletizing & Processing Market by Country, 2018 - 2021, USD Million
- TABLE 212 Asia Pacific Palletizing & Processing Market by Country, 2022 - 2028, USD Million
- TABLE 213 Asia Pacific Packaging Market by Country, 2018 - 2021, USD Million
- TABLE 214 Asia Pacific Packaging Market by Country, 2022 - 2028, USD Million
- TABLE 215 Asia Pacific Repackaging Market by Country, 2018 - 2021, USD Million
- TABLE 216 Asia Pacific Repackaging Market by Country, 2022 - 2028, USD Million
- TABLE 217 Asia Pacific Pick & Place Market by Country, 2018 - 2021, USD Million
- TABLE 218 Asia Pacific Pick & Place Market by Country, 2022 - 2028, USD Million
- TABLE 219 Asia Pacific Others Market by Country, 2018 - 2021, USD Million
- TABLE 220 Asia Pacific Others Market by Country, 2022 - 2028, USD Million
- TABLE 221 Asia Pacific Food Robotics Market by Payload, 2018 - 2021, USD Million
- TABLE 222 Asia Pacific Food Robotics Market by Payload, 2022 - 2028, USD Million
- TABLE 223 Asia Pacific Medium Market by Country, 2018 - 2021, USD Million
- TABLE 224 Asia Pacific Medium Market by Country, 2022 - 2028, USD Million
- TABLE 225 Asia Pacific High Market by Country, 2018 - 2021, USD Million
- TABLE 226 Asia Pacific High Market by Country, 2022 - 2028, USD Million
- TABLE 227 Asia Pacific Low Market by Country, 2018 - 2021, USD Million
- TABLE 228 Asia Pacific Low Market by Country, 2022 - 2028, USD Million
- TABLE 229 Asia Pacific Food Robotics Market by Type, 2018 - 2021, USD Million
- TABLE 230 Asia Pacific Food Robotics Market by Type, 2022 - 2028, USD Million
- TABLE 231 Asia Pacific Articulated Market by Country, 2018 - 2021, USD Million
- TABLE 232 Asia Pacific Articulated Market by Country, 2022 - 2028, USD Million
- TABLE 233 Asia Pacific Cartesian Market by Country, 2018 - 2021, USD Million
- TABLE 234 Asia Pacific Cartesian Market by Country, 2022 - 2028, USD Million
- TABLE 235 Asia Pacific Scara Market by Country, 2018 - 2021, USD Million
- TABLE 236 Asia Pacific Scara Market by Country, 2022 - 2028, USD Million
- TABLE 237 Asia Pacific Cylindrical Market by Country, 2018 - 2021, USD Million
- TABLE 238 Asia Pacific Cylindrical Market by Country, 2022 - 2028, USD Million
- TABLE 239 Asia Pacific Collaborative Market by Country, 2018 - 2021, USD Million
- TABLE 240 Asia Pacific Collaborative Market by Country, 2022 - 2028, USD Million
- TABLE 241 Asia Pacific Others Market by Country, 2018 - 2021, USD Million
- TABLE 242 Asia Pacific Others Market by Country, 2022 - 2028, USD Million
- TABLE 243 Asia Pacific Food Robotics Market by Country, 2018 - 2021, USD Million
- TABLE 244 Asia Pacific Food Robotics Market by Country, 2022 - 2028, USD Million
- TABLE 245 China Food Robotics Market, 2018 - 2021, USD Million
- TABLE 246 China Food Robotics Market, 2022 - 2028, USD Million
- TABLE 247 China Food Robotics Market by Application, 2018 - 2021, USD Million
- TABLE 248 China Food Robotics Market by Application, 2022 - 2028, USD Million
- TABLE 249 China Food Robotics Market by Payload, 2018 - 2021, USD Million
- TABLE 250 China Food Robotics Market by Payload, 2022 - 2028, USD Million
- TABLE 251 China Food Robotics Market by Type, 2018 - 2021, USD Million
- TABLE 252 China Food Robotics Market by Type, 2022 - 2028, USD Million
- TABLE 253 Japan Food Robotics Market, 2018 - 2021, USD Million
- TABLE 254 Japan Food Robotics Market, 2022 - 2028, USD Million
- TABLE 255 Japan Food Robotics Market by Application, 2018 - 2021, USD Million
- TABLE 256 Japan Food Robotics Market by Application, 2022 - 2028, USD Million
- TABLE 257 Japan Food Robotics Market by Payload, 2018 - 2021, USD Million
- TABLE 258 Japan Food Robotics Market by Payload, 2022 - 2028, USD Million
- TABLE 259 Japan Food Robotics Market by Type, 2018 - 2021, USD Million
- TABLE 260 Japan Food Robotics Market by Type, 2022 - 2028, USD Million
- TABLE 261 India Food Robotics Market, 2018 - 2021, USD Million
- TABLE 262 India Food Robotics Market, 2022 - 2028, USD Million
- TABLE 263 India Food Robotics Market by Application, 2018 - 2021, USD Million
- TABLE 264 India Food Robotics Market by Application, 2022 - 2028, USD Million
- TABLE 265 India Food Robotics Market by Payload, 2018 - 2021, USD Million
- TABLE 266 India Food Robotics Market by Payload, 2022 - 2028, USD Million
- TABLE 267 India Food Robotics Market by Type, 2018 - 2021, USD Million
- TABLE 268 India Food Robotics Market by Type, 2022 - 2028, USD Million
- TABLE 269 South Korea Food Robotics Market, 2018 - 2021, USD Million
- TABLE 270 South Korea Food Robotics Market, 2022 - 2028, USD Million
- TABLE 271 South Korea Food Robotics Market by Application, 2018 - 2021, USD Million
- TABLE 272 South Korea Food Robotics Market by Application, 2022 - 2028, USD Million
- TABLE 273 South Korea Food Robotics Market by Payload, 2018 - 2021, USD Million
- TABLE 274 South Korea Food Robotics Market by Payload, 2022 - 2028, USD Million
- TABLE 275 South Korea Food Robotics Market by Type, 2018 - 2021, USD Million
- TABLE 276 South Korea Food Robotics Market by Type, 2022 - 2028, USD Million
- TABLE 277 Singapore Food Robotics Market, 2018 - 2021, USD Million
- TABLE 278 Singapore Food Robotics Market, 2022 - 2028, USD Million
- TABLE 279 Singapore Food Robotics Market by Application, 2018 - 2021, USD Million
- TABLE 280 Singapore Food Robotics Market by Application, 2022 - 2028, USD Million
- TABLE 281 Singapore Food Robotics Market by Payload, 2018 - 2021, USD Million
- TABLE 282 Singapore Food Robotics Market by Payload, 2022 - 2028, USD Million
- TABLE 283 Singapore Food Robotics Market by Type, 2018 - 2021, USD Million
- TABLE 284 Singapore Food Robotics Market by Type, 2022 - 2028, USD Million
- TABLE 285 Malaysia Food Robotics Market, 2018 - 2021, USD Million
- TABLE 286 Malaysia Food Robotics Market, 2022 - 2028, USD Million
- TABLE 287 Malaysia Food Robotics Market by Application, 2018 - 2021, USD Million
- TABLE 288 Malaysia Food Robotics Market by Application, 2022 - 2028, USD Million
- TABLE 289 Malaysia Food Robotics Market by Payload, 2018 - 2021, USD Million
- TABLE 290 Malaysia Food Robotics Market by Payload, 2022 - 2028, USD Million
- TABLE 291 Malaysia Food Robotics Market by Type, 2018 - 2021, USD Million
- TABLE 292 Malaysia Food Robotics Market by Type, 2022 - 2028, USD Million
- TABLE 293 Rest of Asia Pacific Food Robotics Market, 2018 - 2021, USD Million
- TABLE 294 Rest of Asia Pacific Food Robotics Market, 2022 - 2028, USD Million
- TABLE 295 Rest of Asia Pacific Food Robotics Market by Application, 2018 - 2021, USD Million
- TABLE 296 Rest of Asia Pacific Food Robotics Market by Application, 2022 - 2028, USD Million
- TABLE 297 Rest of Asia Pacific Food Robotics Market by Payload, 2018 - 2021, USD Million
- TABLE 298 Rest of Asia Pacific Food Robotics Market by Payload, 2022 - 2028, USD Million
- TABLE 299 Rest of Asia Pacific Food Robotics Market by Type, 2018 - 2021, USD Million
- TABLE 300 Rest of Asia Pacific Food Robotics Market by Type, 2022 - 2028, USD Million
- TABLE 301 LAMEA Food Robotics Market, 2018 - 2021, USD Million
- TABLE 302 LAMEA Food Robotics Market, 2022 - 2028, USD Million
- TABLE 303 LAMEA Food Robotics Market by Application, 2018 - 2021, USD Million
- TABLE 304 LAMEA Food Robotics Market by Application, 2022 - 2028, USD Million
- TABLE 305 LAMEA Palletizing & Processing Market by Country, 2018 - 2021, USD Million
- TABLE 306 LAMEA Palletizing & Processing Market by Country, 2022 - 2028, USD Million
- TABLE 307 LAMEA Packaging Market by Country, 2018 - 2021, USD Million
- TABLE 308 LAMEA Packaging Market by Country, 2022 - 2028, USD Million
- TABLE 309 LAMEA Repackaging Market by Country, 2018 - 2021, USD Million
- TABLE 310 LAMEA Repackaging Market by Country, 2022 - 2028, USD Million
- TABLE 311 LAMEA Pick & Place Market by Country, 2018 - 2021, USD Million
- TABLE 312 LAMEA Pick & Place Market by Country, 2022 - 2028, USD Million
- TABLE 313 LAMEA Others Market by Country, 2018 - 2021, USD Million
- TABLE 314 LAMEA Others Market by Country, 2022 - 2028, USD Million
- TABLE 315 LAMEA Food Robotics Market by Payload, 2018 - 2021, USD Million
- TABLE 316 LAMEA Food Robotics Market by Payload, 2022 - 2028, USD Million
- TABLE 317 LAMEA Medium Market by Country, 2018 - 2021, USD Million
- TABLE 318 LAMEA Medium Market by Country, 2022 - 2028, USD Million
- TABLE 319 LAMEA High Market by Country, 2018 - 2021, USD Million
- TABLE 320 LAMEA High Market by Country, 2022 - 2028, USD Million
- TABLE 321 LAMEA Low Market by Country, 2018 - 2021, USD Million
- TABLE 322 LAMEA Low Market by Country, 2022 - 2028, USD Million
- TABLE 323 LAMEA Food Robotics Market by Type, 2018 - 2021, USD Million
- TABLE 324 LAMEA Food Robotics Market by Type, 2022 - 2028, USD Million
- TABLE 325 LAMEA Articulated Market by Country, 2018 - 2021, USD Million
- TABLE 326 LAMEA Articulated Market by Country, 2022 - 2028, USD Million
- TABLE 327 LAMEA Cartesian Market by Country, 2018 - 2021, USD Million
- TABLE 328 LAMEA Cartesian Market by Country, 2022 - 2028, USD Million
- TABLE 329 LAMEA Scara Market by Country, 2018 - 2021, USD Million
- TABLE 330 LAMEA Scara Market by Country, 2022 - 2028, USD Million
- TABLE 331 LAMEA Cylindrical Market by Country, 2018 - 2021, USD Million
- TABLE 332 LAMEA Cylindrical Market by Country, 2022 - 2028, USD Million
- TABLE 333 LAMEA Collaborative Market by Country, 2018 - 2021, USD Million
- TABLE 334 LAMEA Collaborative Market by Country, 2022 - 2028, USD Million
- TABLE 335 LAMEA Others Market by Country, 2018 - 2021, USD Million
- TABLE 336 LAMEA Others Market by Country, 2022 - 2028, USD Million
- TABLE 337 LAMEA Food Robotics Market by Country, 2018 - 2021, USD Million
- TABLE 338 LAMEA Food Robotics Market by Country, 2022 - 2028, USD Million
- TABLE 339 Brazil Food Robotics Market, 2018 - 2021, USD Million
- TABLE 340 Brazil Food Robotics Market, 2022 - 2028, USD Million
- TABLE 341 Brazil Food Robotics Market by Application, 2018 - 2021, USD Million
- TABLE 342 Brazil Food Robotics Market by Application, 2022 - 2028, USD Million
- TABLE 343 Brazil Food Robotics Market by Payload, 2018 - 2021, USD Million
- TABLE 344 Brazil Food Robotics Market by Payload, 2022 - 2028, USD Million
- TABLE 345 Brazil Food Robotics Market by Type, 2018 - 2021, USD Million
- TABLE 346 Brazil Food Robotics Market by Type, 2022 - 2028, USD Million
- TABLE 347 Argentina Food Robotics Market, 2018 - 2021, USD Million
- TABLE 348 Argentina Food Robotics Market, 2022 - 2028, USD Million
- TABLE 349 Argentina Food Robotics Market by Application, 2018 - 2021, USD Million
- TABLE 350 Argentina Food Robotics Market by Application, 2022 - 2028, USD Million
- TABLE 351 Argentina Food Robotics Market by Payload, 2018 - 2021, USD Million
- TABLE 352 Argentina Food Robotics Market by Payload, 2022 - 2028, USD Million
- TABLE 353 Argentina Food Robotics Market by Type, 2018 - 2021, USD Million
- TABLE 354 Argentina Food Robotics Market by Type, 2022 - 2028, USD Million
- TABLE 355 UAE Food Robotics Market, 2018 - 2021, USD Million
- TABLE 356 UAE Food Robotics Market, 2022 - 2028, USD Million
- TABLE 357 UAE Food Robotics Market by Application, 2018 - 2021, USD Million
- TABLE 358 UAE Food Robotics Market by Application, 2022 - 2028, USD Million
- TABLE 359 UAE Food Robotics Market by Payload, 2018 - 2021, USD Million
- TABLE 360 UAE Food Robotics Market by Payload, 2022 - 2028, USD Million
- TABLE 361 UAE Food Robotics Market by Type, 2018 - 2021, USD Million
- TABLE 362 UAE Food Robotics Market by Type, 2022 - 2028, USD Million
- TABLE 363 Saudi Arabia Food Robotics Market, 2018 - 2021, USD Million
- TABLE 364 Saudi Arabia Food Robotics Market, 2022 - 2028, USD Million
- TABLE 365 Saudi Arabia Food Robotics Market by Application, 2018 - 2021, USD Million
- TABLE 366 Saudi Arabia Food Robotics Market by Application, 2022 - 2028, USD Million
- TABLE 367 Saudi Arabia Food Robotics Market by Payload, 2018 - 2021, USD Million
- TABLE 368 Saudi Arabia Food Robotics Market by Payload, 2022 - 2028, USD Million
- TABLE 369 Saudi Arabia Food Robotics Market by Type, 2018 - 2021, USD Million
- TABLE 370 Saudi Arabia Food Robotics Market by Type, 2022 - 2028, USD Million
- TABLE 371 South Africa Food Robotics Market, 2018 - 2021, USD Million
- TABLE 372 South Africa Food Robotics Market, 2022 - 2028, USD Million
- TABLE 373 South Africa Food Robotics Market by Application, 2018 - 2021, USD Million
- TABLE 374 South Africa Food Robotics Market by Application, 2022 - 2028, USD Million
- TABLE 375 South Africa Food Robotics Market by Payload, 2018 - 2021, USD Million
- TABLE 376 South Africa Food Robotics Market by Payload, 2022 - 2028, USD Million
- TABLE 377 South Africa Food Robotics Market by Type, 2018 - 2021, USD Million
- TABLE 378 South Africa Food Robotics Market by Type, 2022 - 2028, USD Million
- TABLE 379 Nigeria Food Robotics Market, 2018 - 2021, USD Million
- TABLE 380 Nigeria Food Robotics Market, 2022 - 2028, USD Million
- TABLE 381 Nigeria Food Robotics Market by Application, 2018 - 2021, USD Million
- TABLE 382 Nigeria Food Robotics Market by Application, 2022 - 2028, USD Million
- TABLE 383 Nigeria Food Robotics Market by Payload, 2018 - 2021, USD Million
- TABLE 384 Nigeria Food Robotics Market by Payload, 2022 - 2028, USD Million
- TABLE 385 Nigeria Food Robotics Market by Type, 2018 - 2021, USD Million
- TABLE 386 Nigeria Food Robotics Market by Type, 2022 - 2028, USD Million
- TABLE 387 Rest of LAMEA Food Robotics Market, 2018 - 2021, USD Million
- TABLE 388 Rest of LAMEA Food Robotics Market, 2022 - 2028, USD Million
- TABLE 389 Rest of LAMEA Food Robotics Market by Application, 2018 - 2021, USD Million
- TABLE 390 Rest of LAMEA Food Robotics Market by Application, 2022 - 2028, USD Million
- TABLE 391 Rest of LAMEA Food Robotics Market by Payload, 2018 - 2021, USD Million
- TABLE 392 Rest of LAMEA Food Robotics Market by Payload, 2022 - 2028, USD Million
- TABLE 393 Rest of LAMEA Food Robotics Market by Type, 2018 - 2021, USD Million
- TABLE 394 Rest of LAMEA Food Robotics Market by Type, 2022 - 2028, USD Million
- TABLE 395 Key Information - ABB Group
- TABLE 396 key information - Mitsubishi Electric Corporation
- TABLE 397 key information - FANUC Corporation
- TABLE 398 Key Information - Yaskawa Electric Corporation
- TABLE 399 Key information - Rockwell Automation, Inc.
- TABLE 400 Key Information - Universal Robots A/S
- TABLE 401 key information - Denso Corporation
- TABLE 402 Key Information - Kawasaki Heavy Industries, Ltd.
- TABLE 403 Key Information - Seiko Epson Corporation
- TABLE 404 Key Information - Kuka AG
List of Figures
- FIG 1 Methodology for the research
- FIG 2 KBV Cardinal Matrix
- FIG 3 Key Leading Strategies: Percentage Distribution (2018-2022)
- FIG 4 Key Strategic Move: (Product Launches and Product Expansions : 2020, Aug - 2022, Oct) Leading Players
- FIG 5 Global Food Robotics Market share by Application, 2021
- FIG 6 Global Food Robotics Market share by Application, 2028
- FIG 7 Global Food Robotics Market by Application, 2018 - 2028, USD Million
- FIG 8 Global Food Robotics Market share by Payload, 2021
- FIG 9 Global Food Robotics Market share by Payload, 2028
- FIG 10 Global Food Robotics Market by Payload, 2018 - 2028, USD Million
- FIG 11 Global Food Robotics Market share by Type, 2021
- FIG 12 Global Food Robotics Market share by Type, 2028
- FIG 13 Global Food Robotics Market by Type, 2018 - 2028, USD Million
- FIG 14 Global Food Robotics Market share by Region, 2021
- FIG 15 Global Food Robotics Market share by Region, 2028
- FIG 16 Global Food Robotics Market by Region, 2018 - 2028, USD Million
- FIG 17 Recent strategies and developments: ABB Group
- FIG 18 SWOT Analysis: ABB Group
- FIG 19 Recent strategies and developments: Mitsubishi Electric Corporation
- FIG 20 Recent strategies and developments: FANUC Corporation
- FIG 21 Recent strategies and developments: Yaskawa Electric Corporation
The Global Food Robotics Market size is expected to reach $4 billion by 2028, rising at a market growth of 10.2% CAGR during the forecast period.
Food robotics are referred to as robots employed in the food and beverage business to carry out intricate tasks like picking, packing, and palletizing. Robots from science fiction are already a reality owing to various technological developments. Furthermore, robots are becoming a crucial component of many sectors due to the rise in demand for increased productivity and the introduction of robots to job or task automation.
Automation and robotics play a significant role in the solution. The food manufacturing business has been particularly sluggish in incorporating robotics compared to other industries. Robotics, however, has begun to penetrate practically every stage of the food supply chain in the past few years, from the farm to the kitchen. Seedling planting, identification, and sorting are examples of robotic applications.
Additionally, self-driving tractors are also present nowadays along with robots for harvesting and weeding. Robotics are also being brought to the dairy, poultry, and cattle production sectors of non-plant agriculture. Applications include self-sufficient milking and feeding, egg gathering and sorting, and self-sufficient cleaning. Despite being originally developed to lift heavy metal components, modern technology can pick up delicate items like bread loaves, cheese, and fruits without causing any harm.
Manufacturers of food are now able to keep an eye on products as well as consumer demand, then use data analysis to tailor the output to this need. Robotics and the creation of AI software enable this. Companies can better monitor food quality and safety when they are better equipped to assess crucial processes like shipping, processing, and storage, as well as whether food is accidentally contaminated, where that food was shipped, and where that food was acquired from. Several large food service companies have recently invested in robots and artificial intelligence.
COVID-19 Impact Analysis
The COVID-19 pandemic brought on a significant economic depression. Several nations implemented strict lockdowns to contain the virus, which caused the closure of food & beverages (F&B) processing facilities and a brief disruption in the F&B supply chain. The absence of F&B products and necessities, panic buying by consumers worldwide, disruption of supply chains as a result of travel restrictions, and labor shortages had a substantial influence on the F&B supply chain. Major robot manufacturers reported lower revenue generation in the first half of 2020 due to lower sales brought on by an economic slowdown. This was brought on by quarantine and lockdown restrictions imposed by governments worldwide, as well as a temporary decrease in the demand for automation.
Market Growth Factor
Demand for packaged foods is increasing
The need for ready-to-cook and ready-to-eat foods has increased in recent years, necessitating the packaging of food goods to extend their shelf life and meet consumer demand. The mass production of packaged food goods has pushed the market for food robotics, especially in nations such as the United States, Japan, France, and Italy. Most large-scale food manufacturing factories are automating their procedures to assure quality and consistency in the Stock Keeping Units (SKUs). Agriculture and food manufacturing tasks are more difficult to automate using robots, yet companies continue to implement them. As a result, the expansion of the packaged dairy products and baked goods industries is also driving the market for food robotics, as these products are mass-produced across regions.
Increasing digitalization in the food and beverage industries
Digitalization is the optimization of corporate operations by emerging digital technologies, such as IT/OT convergence, big data analytics, digital twin, 3D printing, artificial intelligence, and automation technologies. IoT and AI are assisting businesses in achieving high levels of food safety, enhancing food traceability, reducing food waste, and lowering food processing and packaging-related costs and risks. In recent years, digitalization has emerged as a crucial driver for automation, where artificial intelligence (AI) pushes operational productivity through enhancing workforce productivity. Hence, the growing adoption of digitalization across the F&B industry will propel the growth of the food robotics market in the coming years.
Market Restraining Factor
High cost of robotic system installation
Due to the additional installation expense, most food and beverages businesses are unwilling to implement automated procedures. Market expansion is hindered by the extra cost of integrating individual robots into a comprehensive robotic system, including peripheral equipment such as safety barriers, sensors, programmable logic controllers (PLC), human-machine interface (HMI), and safety systems. In addition, engineering expenses include installation, programming, and commissioning. These increased expenses limit the growth of the market. Small and medium-sized manufacturers are hesitant to incur substantial installation expenditures at the outset since it could delay the payback period and further increase their operational cost.
Application Outlook
Based on application, the food robotics market is divided into palletizing & processing, packaging, repackaging, pick & place, and others. In 2021, the palletizing & processing segment dominated the food robotics market with maximum revenue share. Robotic palletizing ensures quick and effective operations to increase throughput, improve quality, and improve working conditions for personnel. Robotics use grippers for either cases, bags, or crates and operate with people to increase production. They smoothly integrate into the current manufacturing line. Humans do not best perform numerous tasks involved in meat preparation.
Payload Outlook
On the basis of payload, the food robotics market is fragmented into low, medium and high. The low segment covered a remarkable revenue share in the food robotics market in 2021. Many of the available SCARA food robots fall under the low payload category as picking objects is considered a rather simplistic task. The expertise in food handling, pick-and-place, packaging & palletizing, sealing, labeling, and spraying, among many other things, is largely responsible for the segment's explosive expansion.
Type Outlook
By type, the food robotics market is segmented into articulated, cartesian, SCARA, cylindrical, collaborative and others. The SCARA segment generated the prominent revenue share in the food robotics market in 2021. A selective compliance articulated robot arm (SCARA) robot is intended for pick-and-place applications and has a relatively high speed and a high degree of precision. SCARA robots can easily and adaptably solve a number of automated assembling applications. Demand is rising with the expanding use of food robotics in this industry.
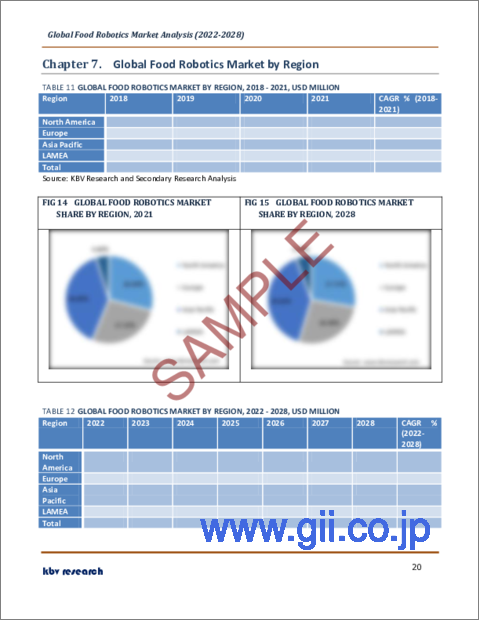
Regional Outlook
Region wise, the food robotics market is analyzed across North America, Europe, Asia Pacific and LAMEA. In 2021, the Asia Pacific region held the highest revenue share in the food robotics market. The rapid expansion of the food robotics market in this region is ascribed to the population's shift toward prepared and packaged foods as a result of growing concerns about food safety and lifestyle. The region's desire for high-tech packaged foods and beverages has been spurred by the rise in consumer income. In Asia Pacific, China is well-known as the nation that sets the standard for food robot adoption.
The major strategies followed by the market participants are Product Launches. Based on the Analysis presented in the Cardinal matrix; Rockwell Automation, Inc. and ABB Group are the forerunners in the Food Robotics Market. Companies such as Mitsubishi Electric Corporation, FANUC Corporation, and Denso Corporation are some of the key innovators in Food Robotics Market.
The market research report covers the analysis of key stake holders of the market. Key companies profiled in the report include Mitsubishi Electric Corporation, ABB Group, Rockwell Automation, Inc., Kawasaki Heavy Industries, Ltd., Kuka AG (Midea Investment Holding Co., Ltd.), FANUC Corporation, Yaskawa Electric Corporation, Seiko Epson Corporation, Teradyne, Inc. (Universal Robots A/S) and Denso Corporation
Recent Strategies Deployed in Food Robotics Market
Product Launches and Expansions:
Oct-2022: Yaskawa launched MOTOMAN-HC30PL, a collaborative robot. The new cobot features a 30 kg payload capacity, 1600 mm reach, easy connection with peripheral devices, secure design, increased safety, and is easy to operate.
Mar-2022: FANUC launched CRX-5iA, CRX-20iA/L and CRX-25iA cobots. These new cobots are a part of the CRX series. The new products are developed to serve every type of manufacturer. Further, these robots perfectly fit and align with FANUC's already existing CR and CRX series.
Mar-2022: Mitsubishi Electric introduced a system that allows robots to carry out tasks in conditions where they have had difficulty performing in the past. The new system has the potential to reduce the number of hours needed to perform a task.
Feb-2022: Yaskawa introduced two new collaborative robots, HC10DTP and HC20DTP, both equipped with six axes. The new cobots are made up of cast aluminum, are IP67-rated, are food-grade certified, and can be used in splash-prone or damp areas. The new robots have multiple applications including dispensing, machine tending, packaging, welding, etc.
Sep-2021: ABB launched GoFa CRB 15000, a collaborative robot. The GoFa CRB 15000 features, a 950mm reach and speed of up to 2.2 meters per second, and can perform multiple tasks including pick, pack-and-place, product handling, and kitting. Moreover, the new cobot caters to the evolving demand for heavy payload robots.
Feb-2021: ABB introduced GoFa and SWIFTI cobot (collaborative robot) families. The new robots features, a higher payload capacity, are faster and stronger and are simple to operate & configure. The new product expands and complements ABB's already existing cobot product offerings, and further advances the company's growth in multiple high-growth segments including, healthcare, food & beverage, electronics, etc.
Aug-2020: Mitsubishi Electric India, part of Mitsubishi Electric Corporation launched the MELFA ASSISTA Series of Collaborative Robots. The Cobot features collision detection and is ISO 10218-1 and ISO/TS15066 compliant. The new product would make the manufacturing process smooth and efficient, and would also improve productivity by working alongside the employees.
Acquisitions and Mergers:
Jul-2021: ABB acquired ASTI Mobile Robotics Group, a Spain-based provider of automated intralogistics technologies. The acquisition broadens ABB's robotics and automation portfolio. Further, the addition of ASTI aligns with ABB's external growth strategy.
Partnerships, Collaborations and Agreements:
Jan-2022: Mitsubishi came into partnership with Cartken, a US-based developer of an outdoor delivery robot. The partnership involves jointly working to introduce Cartken's delivery robots to a Japanese mall. The partnership allows Mitsubishi to explore other applications of the technology and enables them to enter the Japanese autonomous delivery market.
Apr-2021: Rockwell Automation partnered with Comau, an Italy-based provider of industrial automation and a manufacturer of robots. The partnership involves providing businesses globally with essential tools to boost efficiency in manufacturing processes. Moreover, the integration of Rockwell's expertise in food and beverage, life sciences, automated material handling, and Comau's competence in industrial and robotics automation benefits customers through improved value.
Feb-2021: Epson Robots, part of Seiko Epson came into partnership with Heitek Automation, a distributor of automation products and solutions. The partnership agreement involves establishing Heitek as Epson's official distributor for robot automation solutions.
Geographical Expansions:
Aug-2022: YASKAWA India, part of Yaskawa Electric Corporation opened a new robotic solution facility in Haryana, India. The new facility focuses on advancing and promoting innovation, and further aims to develop and advance industrial robotic automation.
Jul-2022: FANUC America expanded its Michigan facility to nearly two million square feet. This expansion of the facility allows FANUC to cater to the heavy demand for its automation solutions.
Jul-2022: FANUC expanded its footprint by setting up a new 109,000-sq.-ft. a facility in Aguascalientes, Mexico which would also act as robotics and automation headquarters. This geographical expansion enables FANUC to better take care of the needs of its clients operating in the aerospace, consumer goods, and aerospace industry. Moreover, the expansion further reflects FANUC's devotion to supporting organizations in enhancing their production processes.
Scope of the Study
Market Segments covered in the Report:
By Application
- Palletizing & Processing
- Packaging
- Repackaging
- Pick & Place
- Others
By Payload
- Medium
- High
- Low
By Type
- Articulated
- Cartesian
- Scara
- Cylindrical
- Collaborative
- Others
By Geography
- North America
- US
- Canada
- Mexico
- Rest of North America
- Europe
- Germany
- UK
- France
- Russia
- Spain
- Italy
- Rest of Europe
- Asia Pacific
- China
- Japan
- India
- South Korea
- Singapore
- Malaysia
- Rest of Asia Pacific
- LAMEA
- Brazil
- Argentina
- UAE
- Saudi Arabia
- South Africa
- Nigeria
- Rest of LAMEA
Companies Profiled
- Mitsubishi Electric Corporation
- ABB Group
- Rockwell Automation, Inc.
- Kawasaki Heavy Industries, Ltd.
- Kuka AG (Midea Investment Holding Co., Ltd.)
- FANUC Corporation
- Yaskawa Electric Corporation
- Seiko Epson Corporation
- Teradyne, Inc. (Universal Robots A/S)
- Denso Corporation
Unique Offerings from KBV Research
- Exhaustive coverage
- Highest number of market tables and figures
- Subscription based model available
- Guaranteed best price
- Assured post sales research support with 10% customization free
Table of Contents
Chapter 1. Market Scope & Methodology
- 1.1 Market Definition
- 1.2 Objectives
- 1.3 Market Scope
- 1.4 Segmentation
- 1.4.1 Global Food Robotics Market, by Application
- 1.4.2 Global Food Robotics Market, by Payload
- 1.4.3 Global Food Robotics Market, by Type
- 1.4.4 Global Food Robotics Market, by Geography
- 1.5 Methodology for the research
Chapter 2. Market Overview
- 2.1 Introduction
- 2.1.1 Overview
- 2.1.1.1 Market Composition & Scenario
- 2.1.1 Overview
- 2.2 Key Factors Impacting the Market
- 2.2.1 Market Drivers
- 2.2.2 Market Restraints
Chapter 3. Competition Analysis - Global
- 3.1 KBV Cardinal Matrix
- 3.2 Recent Industry Wide Strategic Developments
- 3.2.1 Partnerships, Collaborations and Agreements
- 3.2.2 Product Launches and Product Expansions
- 3.2.3 Acquisition and Mergers
- 3.2.4 Geographical Expansions
- 3.3 Top Winning Strategies
- 3.3.1 Key Leading Strategies: Percentage Distribution (2018-2022)
- 3.3.2 Key Strategic Move: (Product Launches and Product Expansions : 2020, Aug - 2022, Oct) Leading Players
Chapter 4. Global Food Robotics Market by Application
- 4.1 Global Palletizing & Processing Market by Region
- 4.2 Global Packaging Market by Region
- 4.3 Global Repackaging Market by Region
- 4.4 Global Pick & Place Market by Region
- 4.5 Global Others Market by Region
Chapter 5. Global Food Robotics Market by Payload
- 5.1 Global Medium Market by Region
- 5.2 Global High Market by Region
- 5.3 Global Low Market by Region
Chapter 6. Global Food Robotics Market by Type
- 6.1 Global Articulated Market by Region
- 6.2 Global Cartesian Market by Region
- 6.3 Global Scara Market by Region
- 6.4 Global Cylindrical Market by Region
- 6.5 Global Collaborative Market by Region
- 6.6 Global Others Market by Region
Chapter 7. Global Food Robotics Market by Region
- 7.1 North America Food Robotics Market
- 7.1.1 North America Food Robotics Market by Application
- 7.1.1.1 North America Palletizing & Processing Market by Country
- 7.1.1.2 North America Packaging Market by Country
- 7.1.1.3 North America Repackaging Market by Country
- 7.1.1.4 North America Pick & Place Market by Country
- 7.1.1.5 North America Others Market by Country
- 7.1.2 North America Food Robotics Market by Payload
- 7.1.2.1 North America Medium Market by Country
- 7.1.2.2 North America High Market by Country
- 7.1.2.3 North America Low Market by Country
- 7.1.3 North America Food Robotics Market by Type
- 7.1.3.1 North America Articulated Market by Country
- 7.1.3.2 North America Cartesian Market by Country
- 7.1.3.3 North America Scara Market by Country
- 7.1.3.4 North America Cylindrical Market by Country
- 7.1.3.5 North America Collaborative Market by Country
- 7.1.3.6 North America Others Market by Country
- 7.1.4 North America Food Robotics Market by Country
- 7.1.4.1 US Food Robotics Market
- 7.1.4.1.1 US Food Robotics Market by Application
- 7.1.4.1.2 US Food Robotics Market by Payload
- 7.1.4.1.3 US Food Robotics Market by Type
- 7.1.4.2 Canada Food Robotics Market
- 7.1.4.2.1 Canada Food Robotics Market by Application
- 7.1.4.2.2 Canada Food Robotics Market by Payload
- 7.1.4.2.3 Canada Food Robotics Market by Type
- 7.1.4.3 Mexico Food Robotics Market
- 7.1.4.3.1 Mexico Food Robotics Market by Application
- 7.1.4.3.2 Mexico Food Robotics Market by Payload
- 7.1.4.3.3 Mexico Food Robotics Market by Type
- 7.1.4.4 Rest of North America Food Robotics Market
- 7.1.4.4.1 Rest of North America Food Robotics Market by Application
- 7.1.4.4.2 Rest of North America Food Robotics Market by Payload
- 7.1.4.4.3 Rest of North America Food Robotics Market by Type
- 7.1.4.1 US Food Robotics Market
- 7.1.1 North America Food Robotics Market by Application
- 7.2 Europe Food Robotics Market
- 7.2.1 Europe Food Robotics Market by Application
- 7.2.1.1 Europe Palletizing & Processing Market by Country
- 7.2.1.2 Europe Packaging Market by Country
- 7.2.1.3 Europe Repackaging Market by Country
- 7.2.1.4 Europe Pick & Place Market by Country
- 7.2.1.5 Europe Others Market by Country
- 7.2.2 Europe Food Robotics Market by Payload
- 7.2.2.1 Europe Medium Market by Country
- 7.2.2.2 Europe High Market by Country
- 7.2.2.3 Europe Low Market by Country
- 7.2.3 Europe Food Robotics Market by Type
- 7.2.3.1 Europe Articulated Market by Country
- 7.2.3.2 Europe Cartesian Market by Country
- 7.2.3.3 Europe Scara Market by Country
- 7.2.3.4 Europe Cylindrical Market by Country
- 7.2.3.5 Europe Collaborative Market by Country
- 7.2.3.6 Europe Others Market by Country
- 7.2.4 Europe Food Robotics Market by Country
- 7.2.4.1 Germany Food Robotics Market
- 7.2.4.1.1 Germany Food Robotics Market by Application
- 7.2.4.1.2 Germany Food Robotics Market by Payload
- 7.2.4.1.3 Germany Food Robotics Market by Type
- 7.2.4.2 UK Food Robotics Market
- 7.2.4.2.1 UK Food Robotics Market by Application
- 7.2.4.2.2 UK Food Robotics Market by Payload
- 7.2.4.2.3 UK Food Robotics Market by Type
- 7.2.4.3 France Food Robotics Market
- 7.2.4.3.1 France Food Robotics Market by Application
- 7.2.4.3.2 France Food Robotics Market by Payload
- 7.2.4.3.3 France Food Robotics Market by Type
- 7.2.4.4 Russia Food Robotics Market
- 7.2.4.4.1 Russia Food Robotics Market by Application
- 7.2.4.4.2 Russia Food Robotics Market by Payload
- 7.2.4.4.3 Russia Food Robotics Market by Type
- 7.2.4.5 Spain Food Robotics Market
- 7.2.4.5.1 Spain Food Robotics Market by Application
- 7.2.4.5.2 Spain Food Robotics Market by Payload
- 7.2.4.5.3 Spain Food Robotics Market by Type
- 7.2.4.6 Italy Food Robotics Market
- 7.2.4.6.1 Italy Food Robotics Market by Application
- 7.2.4.6.2 Italy Food Robotics Market by Payload
- 7.2.4.6.3 Italy Food Robotics Market by Type
- 7.2.4.7 Rest of Europe Food Robotics Market
- 7.2.4.7.1 Rest of Europe Food Robotics Market by Application
- 7.2.4.7.2 Rest of Europe Food Robotics Market by Payload
- 7.2.4.7.3 Rest of Europe Food Robotics Market by Type
- 7.2.4.1 Germany Food Robotics Market
- 7.2.1 Europe Food Robotics Market by Application
- 7.3 Asia Pacific Food Robotics Market
- 7.3.1 Asia Pacific Food Robotics Market by Application
- 7.3.1.1 Asia Pacific Palletizing & Processing Market by Country
- 7.3.1.2 Asia Pacific Packaging Market by Country
- 7.3.1.3 Asia Pacific Repackaging Market by Country
- 7.3.1.4 Asia Pacific Pick & Place Market by Country
- 7.3.1.5 Asia Pacific Others Market by Country
- 7.3.2 Asia Pacific Food Robotics Market by Payload
- 7.3.2.1 Asia Pacific Medium Market by Country
- 7.3.2.2 Asia Pacific High Market by Country
- 7.3.2.3 Asia Pacific Low Market by Country
- 7.3.3 Asia Pacific Food Robotics Market by Type
- 7.3.3.1 Asia Pacific Articulated Market by Country
- 7.3.3.2 Asia Pacific Cartesian Market by Country
- 7.3.3.3 Asia Pacific Scara Market by Country
- 7.3.3.4 Asia Pacific Cylindrical Market by Country
- 7.3.3.5 Asia Pacific Collaborative Market by Country
- 7.3.3.6 Asia Pacific Others Market by Country
- 7.3.4 Asia Pacific Food Robotics Market by Country
- 7.3.4.1 China Food Robotics Market
- 7.3.4.1.1 China Food Robotics Market by Application
- 7.3.4.1.2 China Food Robotics Market by Payload
- 7.3.4.1.3 China Food Robotics Market by Type
- 7.3.4.2 Japan Food Robotics Market
- 7.3.4.2.1 Japan Food Robotics Market by Application
- 7.3.4.2.2 Japan Food Robotics Market by Payload
- 7.3.4.2.3 Japan Food Robotics Market by Type
- 7.3.4.3 India Food Robotics Market
- 7.3.4.3.1 India Food Robotics Market by Application
- 7.3.4.3.2 India Food Robotics Market by Payload
- 7.3.4.3.3 India Food Robotics Market by Type
- 7.3.4.4 South Korea Food Robotics Market
- 7.3.4.4.1 South Korea Food Robotics Market by Application
- 7.3.4.4.2 South Korea Food Robotics Market by Payload
- 7.3.4.4.3 South Korea Food Robotics Market by Type
- 7.3.4.5 Singapore Food Robotics Market
- 7.3.4.5.1 Singapore Food Robotics Market by Application
- 7.3.4.5.2 Singapore Food Robotics Market by Payload
- 7.3.4.5.3 Singapore Food Robotics Market by Type
- 7.3.4.6 Malaysia Food Robotics Market
- 7.3.4.6.1 Malaysia Food Robotics Market by Application
- 7.3.4.6.2 Malaysia Food Robotics Market by Payload
- 7.3.4.6.3 Malaysia Food Robotics Market by Type
- 7.3.4.7 Rest of Asia Pacific Food Robotics Market
- 7.3.4.7.1 Rest of Asia Pacific Food Robotics Market by Application
- 7.3.4.7.2 Rest of Asia Pacific Food Robotics Market by Payload
- 7.3.4.7.3 Rest of Asia Pacific Food Robotics Market by Type
- 7.3.4.1 China Food Robotics Market
- 7.3.1 Asia Pacific Food Robotics Market by Application
- 7.4 LAMEA Food Robotics Market
- 7.4.1 LAMEA Food Robotics Market by Application
- 7.4.1.1 LAMEA Palletizing & Processing Market by Country
- 7.4.1.2 LAMEA Packaging Market by Country
- 7.4.1.3 LAMEA Repackaging Market by Country
- 7.4.1.4 LAMEA Pick & Place Market by Country
- 7.4.1.5 LAMEA Others Market by Country
- 7.4.2 LAMEA Food Robotics Market by Payload
- 7.4.2.1 LAMEA Medium Market by Country
- 7.4.2.2 LAMEA High Market by Country
- 7.4.2.3 LAMEA Low Market by Country
- 7.4.3 LAMEA Food Robotics Market by Type
- 7.4.3.1 LAMEA Articulated Market by Country
- 7.4.3.2 LAMEA Cartesian Market by Country
- 7.4.3.3 LAMEA Scara Market by Country
- 7.4.3.4 LAMEA Cylindrical Market by Country
- 7.4.3.5 LAMEA Collaborative Market by Country
- 7.4.3.6 LAMEA Others Market by Country
- 7.4.4 LAMEA Food Robotics Market by Country
- 7.4.4.1 Brazil Food Robotics Market
- 7.4.4.1.1 Brazil Food Robotics Market by Application
- 7.4.4.1.2 Brazil Food Robotics Market by Payload
- 7.4.4.1.3 Brazil Food Robotics Market by Type
- 7.4.4.2 Argentina Food Robotics Market
- 7.4.4.2.1 Argentina Food Robotics Market by Application
- 7.4.4.2.2 Argentina Food Robotics Market by Payload
- 7.4.4.2.3 Argentina Food Robotics Market by Type
- 7.4.4.3 UAE Food Robotics Market
- 7.4.4.3.1 UAE Food Robotics Market by Application
- 7.4.4.3.2 UAE Food Robotics Market by Payload
- 7.4.4.3.3 UAE Food Robotics Market by Type
- 7.4.4.4 Saudi Arabia Food Robotics Market
- 7.4.4.4.1 Saudi Arabia Food Robotics Market by Application
- 7.4.4.4.2 Saudi Arabia Food Robotics Market by Payload
- 7.4.4.4.3 Saudi Arabia Food Robotics Market by Type
- 7.4.4.5 South Africa Food Robotics Market
- 7.4.4.5.1 South Africa Food Robotics Market by Application
- 7.4.4.5.2 South Africa Food Robotics Market by Payload
- 7.4.4.5.3 South Africa Food Robotics Market by Type
- 7.4.4.6 Nigeria Food Robotics Market
- 7.4.4.6.1 Nigeria Food Robotics Market by Application
- 7.4.4.6.2 Nigeria Food Robotics Market by Payload
- 7.4.4.6.3 Nigeria Food Robotics Market by Type
- 7.4.4.7 Rest of LAMEA Food Robotics Market
- 7.4.4.7.1 Rest of LAMEA Food Robotics Market by Application
- 7.4.4.7.2 Rest of LAMEA Food Robotics Market by Payload
- 7.4.4.7.3 Rest of LAMEA Food Robotics Market by Type
- 7.4.4.1 Brazil Food Robotics Market
- 7.4.1 LAMEA Food Robotics Market by Application
Chapter 8. Company Profiles
- 8.1 ABB Group
- 8.1.1 Company Overview
- 8.1.2 Financial Analysis
- 8.1.3 Segmental and Regional Analysis
- 8.1.4 Research & Development Expense
- 8.1.5 Recent strategies and developments:
- 8.1.5.1 Product Launches and Product Expansions:
- 8.1.5.2 Acquisition and Mergers:
- 8.1.6 SWOT Analysis
- 8.2 Mitsubishi Electric Corporation
- 8.2.1 Company Overview
- 8.2.2 Financial Analysis
- 8.2.3 Segmental and Regional Analysis
- 8.2.4 Research & Development Expense
- 8.2.5 Recent strategies and developments:
- 8.2.5.1 Partnerships, Collaborations, and Agreements:
- 8.2.5.2 Product Launches and Product Expansions:
- 8.3 FANUC Corporation
- 8.3.1 Company Overview
- 8.3.2 Financial Analysis
- 8.3.3 Regional Analysis
- 8.3.4 Research & Development Expense
- 8.3.5 Recent strategies and developments:
- 8.3.5.1 Partnerships, Collaborations, and Agreements:
- 8.3.5.2 Product Launches and Product Expansions:
- 8.3.5.3 Geographical Expansions:
- 8.4 Yaskawa Electric Corporation
- 8.4.1 Company Overview
- 8.4.2 Financial Analysis
- 8.4.3 Segmental and Regional Analysis
- 8.4.4 Research & Development Expenses
- 8.4.5 Recent strategies and developments:
- 8.4.5.1 Product Launches and Product Expansions:
- 8.4.5.2 Geographical Expansions:
- 8.5 Rockwell Automation, Inc.
- 8.5.1 Company Overview
- 8.5.2 Financial Analysis
- 8.5.3 Segmental and Regional Analysis
- 8.5.4 Research & Development Expenses
- 8.5.5 Recent strategies and developments:
- 8.5.5.1 Partnerships, Collaborations, and Agreements:
- 8.6 Universal Robots A/S (Teradyne, Inc.)
- 8.6.1 Company Overview
- 8.6.2 Financial Analysis
- 8.6.3 Segmental and Regional Analysis
- 8.7 Denso Corporation
- 8.7.1 Company Overview
- 8.7.2 Financial Analysis
- 8.7.3 Regional Analysis
- 8.7.4 Research & Development Expense
- 8.8 Kawasaki Heavy Industries, Ltd.
- 8.8.1 Company Overview
- 8.8.2 Financial Analysis
- 8.8.3 Segmental and Regional Analysis
- 8.8.4 Research & Development Expense
- 8.9 Seiko Epson Corporation
- 8.9.1 Company Overview
- 8.9.2 Financial Analysis
- 8.9.3 Segmental and Regional Analysis
- 8.9.4 Research & Development Expenses
- 8.9.5 Recent strategies and developments:
- 8.9.5.1 Partnerships, Collaborations, and Agreements:
- 8.10. Kuka AG (Midea Investment Holding Co., Ltd.)
- 8.10.1 Company Overview
- 8.10.2 Financial Analysis
- 8.10.3 Segmental and Regional Analysis
- 8.10.4 Research & Development Expense