|
|
市場調査レポート
商品コード
1155454
低糖食品・低糖飲料の世界市場規模、シェア、産業動向分析レポート:流通チャネル別(スーパーマーケット&ハイパーマーケット、コンビニエンスストア、オンライン、その他)、製品別、地域別展望・予測、2022~2028年版Global Reduced Sugar Food & Beverages Market Size, Share & Industry Trends Analysis Report By Distribution Channel (Supermarkets & Hypermarkets, Convenience Stores, Online and Others), By Product, By Regional Outlook and Forecast, 2022 - 2028 |
||||||
|
|
|||||||


| 低糖食品・低糖飲料の世界市場規模、シェア、産業動向分析レポート:流通チャネル別(スーパーマーケット&ハイパーマーケット、コンビニエンスストア、オンライン、その他)、製品別、地域別展望・予測、2022~2028年版 |
|
出版日: 2022年10月31日
発行: KBV Research
ページ情報: 英文 193 Pages
納期: 即納可能
|
- 全表示
- 概要
- 図表
- 目次
低糖食品・低糖飲料の世界市場規模は、2028年には795億米ドルに達し、予測期間中にCAGR8.6%の市場成長率で上昇すると予測されています。
顧客はスナックに大きく依存しているため、栄養価の高いスナックを消費する必要があります。なぜなら、不健康なスナックを摂取すると、体重増加や肥満など、さまざまな健康問題につながる可能性があるからです。悪い間食は様々な健康問題につながる一方、良い間食は身体の健康維持に役立つため、間食は人の食生活において重要な要素となっています。
そのため、砂糖控えめのフルーツスナックなど、ヘルシーなスナックの需要が今後高まると予想されます。糖尿病や低血圧など、食事と食事の間に一定量の食事を必要とする疾患の増加。また、糖質を抑えたフルーツスナックなど、様々な間食グッズを多くの人が取り入れるようになったことも、市場拡大に寄与しています。
COVID-19インパクト分析
小売流通チャネルにおける調理済み食品の驚異的な売上増は、避難所生活の初期段階において消費者が慌てて食料品を購入したことが一因でした。しかし近年、加工食品の衛生面や安全性に関する健康上の懸念が高まり、消費者が家庭で食事を作るために生の食材を選ぶようになったことが、これらの商品の市場に影響を及ぼしています。このことは、今後数年間、業界をリードするプレーヤーに新たな成長機会を提供することになるでしょう。グルテンフリー、ベジタリアン、ミートフリーの低糖質スナックに対する顧客の高いニーズが、予測期間を通じて低糖質フルーツスナック市場を牽引すると考えられます。
市場の成長要因
肥満の蔓延
肥満は、21世紀の公衆衛生に対する最も大きな脅威の1つであり、地球上のどの国にも存在する問題です。成人の肥満は、健康状態の悪化や様々な疾患による早期死亡の原因となる主要な危険因子です。これらの疾患には、心血管疾患、変形性関節症、糖尿病、および多数の有病性悪性腫瘍が含まれます。体重過多と肥満の有病率は、子供と大人の両方で憂慮すべき速度で増加しています。この飲料には人工甘味料が含まれていますが、人工甘味料は通常の砂糖の600倍の甘さがあるため、微量にしか使用されていません。
生活習慣病の増加
健康的なライフスタイルの普及に伴い、無糖のエナジードリンクの人気は急上昇しています。炭酸飲料は、肥満の増加に大きく寄与しており、無糖エナジードリンクは、炭酸飲料の消費によって残された空白を埋める優れた代替品として登場したのです。無糖エナジードリンクの最も有名なブランドには、Red Bull、Monster、Rockstarなどがあり、最もよく消費されている無糖エナジードリンクのリストに含まれています。
市場抑制要因
医学研究における人工甘味料の使用に関する懸念
無糖食品・飲料事業の拡大を阻む問題の一つは、人工甘味料の安全性プロファイルが曖昧であることによる普及率の低下です。人工甘味料の使用は、健康に悪影響を及ぼす可能性があるという証拠があります。砂糖で甘味をつけた飲料と人工甘味料で甘味をつけた飲料の2つのグループでメタボリックシンドロームのリスクを比較したところ、砂糖で甘味をつけた飲料の方が、人工甘味料で甘味をつけた飲料よりもメタボリックシンドロームのリスクが高いという結果が出ています。
流通経路の展望
低糖食品・低糖飲料市場は、流通チャネル別に、スーパーマーケット&ハイパーマーケット、コンビニエンスストア、オンライン、その他に分けられます。オンラインセグメントは、2021年の還元糖食品&飲食品市場でかなりの収益シェアを登録しました。なぜなら、現在、より多くの人がスマートフォンなどを利用できるようになり、インターネットを利用する人が増えたからです。また、世界中の消費者の間で、食料品の買い物にオンラインプラットフォームを利用したいという欲求が高まっていることも、予測期間を通じて市場の拡大を後押しする要因となっています。
製品別の展望
低糖食品・低糖飲料市場は、製品別にベーカリー、飲料、菓子類、乳製品、スナック、その他に区分されます。2021年の低糖質食品&飲料市場では、飲料分野が最も高い収益シェアを獲得しました。消費者にとってより良い、添加糖分の少ないスポーツ飲料やエネルギー飲料に対する需要が世界中で大きいためです。また、低糖質でミネラルを多く含むフレーバーウォーターや炭酸飲料の需要が高まっていることも、市場拡大の要因となっています。
地域別の展望
地域別では、北米、欧州、アジア太平洋、LAMEAで低糖食品・低糖飲料市場を分析しています。北米セグメントは、2021年の還元糖食品&飲料市場で最も高い収益シェアを獲得しています。この市場を牽引している主な要因は、この地域に住む糖尿病患者の数が増加していることで、この地域では砂糖の含有量が少ない食品に対する需要が増加しています。全米糖尿病統計報告書によると、米国には糖尿病を患う人が約3,730万人いるとされています。
目次
第1章 市場の範囲と調査手法
- 市場の定義
- 目的
- 市場規模
- セグメンテーション
- 低糖食品・低糖飲料の世界市場、流通チャネル別
- 低糖食品・低糖飲料の世界市場、製品別
- 低糖食品・低糖飲料の世界市場、地域別
- 調査手法
第2章 市場概要
- イントロダクション
- 概要説明
- 市場の構成とシナリオ
- 概要説明
- 市場に影響を与える主要因
- 市場促進要因
- 市場抑制要因
第3章 低糖食品・低糖飲料市場で展開されている戦略
第4章 低糖食品・低糖飲料の世界市場:流通チャネル別
- スーパーマーケット・ハイパーマーケットの世界市場:地域別
- コンビニエンスストアの世界地域別市場
- 世界のオンライン市場:地域別
- 世界の地域別その他市場
第5章 低糖食品・低糖飲料の世界市場:製品別
- 飲料の世界市場:地域別
- ベーカリーの世界市場:地域別
- 菓子類の世界市場:地域別
- 乳製品の世界市場:地域別
- スナックの世界市場:地域別
- その他の地域別世界市場
第6章 低糖食品・低糖飲料の世界市場:地域別
- 北米
- 北米の低糖食品・低糖飲料の国別市場
- 米国
- カナダ
- メキシコ
- その他北米地域
- 北米の低糖食品・低糖飲料の国別市場
- 欧州
- 欧州の低糖食品・低糖飲料市場:国別
- ドイツ
- 英国
- フランス
- ロシア
- スペイン
- イタリア
- その他欧州
- 欧州の低糖食品・低糖飲料市場:国別
- アジア太平洋地域
- アジア太平洋地域の低糖食品・低糖飲料市場:国別
- 中国
- 日本
- インド
- 韓国
- シンガポール
- マレーシア
- その他アジア太平洋地域
- アジア太平洋地域の低糖食品・低糖飲料市場:国別
- LAMEA
- LAMEAの低糖食品・低糖飲料の国別市場
- ブラジル
- アルゼンチン
- UAE
- サウジアラビア
- 南アフリカ
- ナイジェリア
- その他のLAMEA
- LAMEAの低糖食品・低糖飲料の国別市場
第7章 企業プロファイル
- Nestle S.A
- Givaudan S.A
- NOW Foods, Inc.
- Cargill Corporation
- PepsiCo, Inc.
- The Coca-Cola Company
- Danone S.A.(Sofina Group)
- The Hain Celestial Group, Inc.
- Mondelez International, Inc.
- Unilever PLC(Tazo Tea)
LIST OF TABLES
- TABLE 1 Global Reduced Sugar Food & Beverages Market, 2018 - 2021, USD Million
- TABLE 2 Global Reduced Sugar Food & Beverages Market, 2022 - 2028, USD Million
- TABLE 3 Global Reduced Sugar Food & Beverages Market by Distribution Channel, 2018 - 2021, USD Million
- TABLE 4 Global Reduced Sugar Food & Beverages Market by Distribution Channel, 2022 - 2028, USD Million
- TABLE 5 Global Supermarkets & Hypermarkets Market by Region, 2018 - 2021, USD Million
- TABLE 6 Global Supermarkets & Hypermarkets Market by Region, 2022 - 2028, USD Million
- TABLE 7 Global Convenience Stores Market by Region, 2018 - 2021, USD Million
- TABLE 8 Global Convenience Stores Market by Region, 2022 - 2028, USD Million
- TABLE 9 Global Online Market by Region, 2018 - 2021, USD Million
- TABLE 10 Global Online Market by Region, 2022 - 2028, USD Million
- TABLE 11 Global Others Market by Region, 2018 - 2021, USD Million
- TABLE 12 Global Others Market by Region, 2022 - 2028, USD Million
- TABLE 13 Global Reduced Sugar Food & Beverages Market by Product, 2018 - 2021, USD Million
- TABLE 14 Global Reduced Sugar Food & Beverages Market by Product, 2022 - 2028, USD Million
- TABLE 15 Global Beverages Market by Region, 2018 - 2021, USD Million
- TABLE 16 Global Beverages Market by Region, 2022 - 2028, USD Million
- TABLE 17 Global Bakery Market by Region, 2018 - 2021, USD Million
- TABLE 18 Global Bakery Market by Region, 2022 - 2028, USD Million
- TABLE 19 Global Confectionery Market by Region, 2018 - 2021, USD Million
- TABLE 20 Global Confectionery Market by Region, 2022 - 2028, USD Million
- TABLE 21 Global Dairy Market by Region, 2018 - 2021, USD Million
- TABLE 22 Global Dairy Market by Region, 2022 - 2028, USD Million
- TABLE 23 Global Snacks Market by Region, 2018 - 2021, USD Million
- TABLE 24 Global Snacks Market by Region, 2022 - 2028, USD Million
- TABLE 25 Global Others Market by Region, 2018 - 2021, USD Million
- TABLE 26 Global Others Market by Region, 2022 - 2028, USD Million
- TABLE 27 Global Reduced Sugar Food & Beverages Market by Region, 2018 - 2021, USD Million
- TABLE 28 Global Reduced Sugar Food & Beverages Market by Region, 2022 - 2028, USD Million
- TABLE 29 North America Reduced Sugar Food & Beverages Market, 2018 - 2021, USD Million
- TABLE 30 North America Reduced Sugar Food & Beverages Market, 2022 - 2028, USD Million
- TABLE 31 North America Reduced Sugar Food & Beverages Market by Distribution Channel, 2018 - 2021, USD Million
- TABLE 32 North America Reduced Sugar Food & Beverages Market by Distribution Channel, 2022 - 2028, USD Million
- TABLE 33 North America Supermarkets & Hypermarkets Market by Country, 2018 - 2021, USD Million
- TABLE 34 North America Supermarkets & Hypermarkets Market by Country, 2022 - 2028, USD Million
- TABLE 35 North America Convenience Stores Market by Country, 2018 - 2021, USD Million
- TABLE 36 North America Convenience Stores Market by Country, 2022 - 2028, USD Million
- TABLE 37 North America Online Market by Country, 2018 - 2021, USD Million
- TABLE 38 North America Online Market by Country, 2022 - 2028, USD Million
- TABLE 39 North America Others Market by Country, 2018 - 2021, USD Million
- TABLE 40 North America Others Market by Country, 2022 - 2028, USD Million
- TABLE 41 North America Reduced Sugar Food & Beverages Market by Product, 2018 - 2021, USD Million
- TABLE 42 North America Reduced Sugar Food & Beverages Market by Product, 2022 - 2028, USD Million
- TABLE 43 North America Beverages Market by Country, 2018 - 2021, USD Million
- TABLE 44 North America Beverages Market by Country, 2022 - 2028, USD Million
- TABLE 45 North America Bakery Market by Country, 2018 - 2021, USD Million
- TABLE 46 North America Bakery Market by Country, 2022 - 2028, USD Million
- TABLE 47 North America Confectionery Market by Country, 2018 - 2021, USD Million
- TABLE 48 North America Confectionery Market by Country, 2022 - 2028, USD Million
- TABLE 49 North America Dairy Market by Country, 2018 - 2021, USD Million
- TABLE 50 North America Dairy Market by Country, 2022 - 2028, USD Million
- TABLE 51 North America Snacks Market by Country, 2018 - 2021, USD Million
- TABLE 52 North America Snacks Market by Country, 2022 - 2028, USD Million
- TABLE 53 North America Others Market by Country, 2018 - 2021, USD Million
- TABLE 54 North America Others Market by Country, 2022 - 2028, USD Million
- TABLE 55 North America Reduced Sugar Food & Beverages Market by Country, 2018 - 2021, USD Million
- TABLE 56 North America Reduced Sugar Food & Beverages Market by Country, 2022 - 2028, USD Million
- TABLE 57 US Reduced Sugar Food & Beverages Market, 2018 - 2021, USD Million
- TABLE 58 US Reduced Sugar Food & Beverages Market, 2022 - 2028, USD Million
- TABLE 59 US Reduced Sugar Food & Beverages Market by Distribution Channel, 2018 - 2021, USD Million
- TABLE 60 US Reduced Sugar Food & Beverages Market by Distribution Channel, 2022 - 2028, USD Million
- TABLE 61 US Reduced Sugar Food & Beverages Market by Product, 2018 - 2021, USD Million
- TABLE 62 US Reduced Sugar Food & Beverages Market by Product, 2022 - 2028, USD Million
- TABLE 63 Canada Reduced Sugar Food & Beverages Market, 2018 - 2021, USD Million
- TABLE 64 Canada Reduced Sugar Food & Beverages Market, 2022 - 2028, USD Million
- TABLE 65 Canada Reduced Sugar Food & Beverages Market by Distribution Channel, 2018 - 2021, USD Million
- TABLE 66 Canada Reduced Sugar Food & Beverages Market by Distribution Channel, 2022 - 2028, USD Million
- TABLE 67 Canada Reduced Sugar Food & Beverages Market by Product, 2018 - 2021, USD Million
- TABLE 68 Canada Reduced Sugar Food & Beverages Market by Product, 2022 - 2028, USD Million
- TABLE 69 Mexico Reduced Sugar Food & Beverages Market, 2018 - 2021, USD Million
- TABLE 70 Mexico Reduced Sugar Food & Beverages Market, 2022 - 2028, USD Million
- TABLE 71 Mexico Reduced Sugar Food & Beverages Market by Distribution Channel, 2018 - 2021, USD Million
- TABLE 72 Mexico Reduced Sugar Food & Beverages Market by Distribution Channel, 2022 - 2028, USD Million
- TABLE 73 Mexico Reduced Sugar Food & Beverages Market by Product, 2018 - 2021, USD Million
- TABLE 74 Mexico Reduced Sugar Food & Beverages Market by Product, 2022 - 2028, USD Million
- TABLE 75 Rest of North America Reduced Sugar Food & Beverages Market, 2018 - 2021, USD Million
- TABLE 76 Rest of North America Reduced Sugar Food & Beverages Market, 2022 - 2028, USD Million
- TABLE 77 Rest of North America Reduced Sugar Food & Beverages Market by Distribution Channel, 2018 - 2021, USD Million
- TABLE 78 Rest of North America Reduced Sugar Food & Beverages Market by Distribution Channel, 2022 - 2028, USD Million
- TABLE 79 Rest of North America Reduced Sugar Food & Beverages Market by Product, 2018 - 2021, USD Million
- TABLE 80 Rest of North America Reduced Sugar Food & Beverages Market by Product, 2022 - 2028, USD Million
- TABLE 81 Europe Reduced Sugar Food & Beverages Market, 2018 - 2021, USD Million
- TABLE 82 Europe Reduced Sugar Food & Beverages Market, 2022 - 2028, USD Million
- TABLE 83 Europe Reduced Sugar Food & Beverages Market by Distribution Channel, 2018 - 2021, USD Million
- TABLE 84 Europe Reduced Sugar Food & Beverages Market by Distribution Channel, 2022 - 2028, USD Million
- TABLE 85 Europe Supermarkets & Hypermarkets Market by Country, 2018 - 2021, USD Million
- TABLE 86 Europe Supermarkets & Hypermarkets Market by Country, 2022 - 2028, USD Million
- TABLE 87 Europe Convenience Stores Market by Country, 2018 - 2021, USD Million
- TABLE 88 Europe Convenience Stores Market by Country, 2022 - 2028, USD Million
- TABLE 89 Europe Online Market by Country, 2018 - 2021, USD Million
- TABLE 90 Europe Online Market by Country, 2022 - 2028, USD Million
- TABLE 91 Europe Others Market by Country, 2018 - 2021, USD Million
- TABLE 92 Europe Others Market by Country, 2022 - 2028, USD Million
- TABLE 93 Europe Reduced Sugar Food & Beverages Market by Product, 2018 - 2021, USD Million
- TABLE 94 Europe Reduced Sugar Food & Beverages Market by Product, 2022 - 2028, USD Million
- TABLE 95 Europe Beverages Market by Country, 2018 - 2021, USD Million
- TABLE 96 Europe Beverages Market by Country, 2022 - 2028, USD Million
- TABLE 97 Europe Bakery Market by Country, 2018 - 2021, USD Million
- TABLE 98 Europe Bakery Market by Country, 2022 - 2028, USD Million
- TABLE 99 Europe Confectionery Market by Country, 2018 - 2021, USD Million
- TABLE 100 Europe Confectionery Market by Country, 2022 - 2028, USD Million
- TABLE 101 Europe Dairy Market by Country, 2018 - 2021, USD Million
- TABLE 102 Europe Dairy Market by Country, 2022 - 2028, USD Million
- TABLE 103 Europe Snacks Market by Country, 2018 - 2021, USD Million
- TABLE 104 Europe Snacks Market by Country, 2022 - 2028, USD Million
- TABLE 105 Europe Others Market by Country, 2018 - 2021, USD Million
- TABLE 106 Europe Others Market by Country, 2022 - 2028, USD Million
- TABLE 107 Europe Reduced Sugar Food & Beverages Market by Country, 2018 - 2021, USD Million
- TABLE 108 Europe Reduced Sugar Food & Beverages Market by Country, 2022 - 2028, USD Million
- TABLE 109 Germany Reduced Sugar Food & Beverages Market, 2018 - 2021, USD Million
- TABLE 110 Germany Reduced Sugar Food & Beverages Market, 2022 - 2028, USD Million
- TABLE 111 Germany Reduced Sugar Food & Beverages Market by Distribution Channel, 2018 - 2021, USD Million
- TABLE 112 Germany Reduced Sugar Food & Beverages Market by Distribution Channel, 2022 - 2028, USD Million
- TABLE 113 Germany Reduced Sugar Food & Beverages Market by Product, 2018 - 2021, USD Million
- TABLE 114 Germany Reduced Sugar Food & Beverages Market by Product, 2022 - 2028, USD Million
- TABLE 115 UK Reduced Sugar Food & Beverages Market, 2018 - 2021, USD Million
- TABLE 116 UK Reduced Sugar Food & Beverages Market, 2022 - 2028, USD Million
- TABLE 117 UK Reduced Sugar Food & Beverages Market by Distribution Channel, 2018 - 2021, USD Million
- TABLE 118 UK Reduced Sugar Food & Beverages Market by Distribution Channel, 2022 - 2028, USD Million
- TABLE 119 UK Reduced Sugar Food & Beverages Market by Product, 2018 - 2021, USD Million
- TABLE 120 UK Reduced Sugar Food & Beverages Market by Product, 2022 - 2028, USD Million
- TABLE 121 France Reduced Sugar Food & Beverages Market, 2018 - 2021, USD Million
- TABLE 122 France Reduced Sugar Food & Beverages Market, 2022 - 2028, USD Million
- TABLE 123 France Reduced Sugar Food & Beverages Market by Distribution Channel, 2018 - 2021, USD Million
- TABLE 124 France Reduced Sugar Food & Beverages Market by Distribution Channel, 2022 - 2028, USD Million
- TABLE 125 France Reduced Sugar Food & Beverages Market by Product, 2018 - 2021, USD Million
- TABLE 126 France Reduced Sugar Food & Beverages Market by Product, 2022 - 2028, USD Million
- TABLE 127 Russia Reduced Sugar Food & Beverages Market, 2018 - 2021, USD Million
- TABLE 128 Russia Reduced Sugar Food & Beverages Market, 2022 - 2028, USD Million
- TABLE 129 Russia Reduced Sugar Food & Beverages Market by Distribution Channel, 2018 - 2021, USD Million
- TABLE 130 Russia Reduced Sugar Food & Beverages Market by Distribution Channel, 2022 - 2028, USD Million
- TABLE 131 Russia Reduced Sugar Food & Beverages Market by Product, 2018 - 2021, USD Million
- TABLE 132 Russia Reduced Sugar Food & Beverages Market by Product, 2022 - 2028, USD Million
- TABLE 133 Spain Reduced Sugar Food & Beverages Market, 2018 - 2021, USD Million
- TABLE 134 Spain Reduced Sugar Food & Beverages Market, 2022 - 2028, USD Million
- TABLE 135 Spain Reduced Sugar Food & Beverages Market by Distribution Channel, 2018 - 2021, USD Million
- TABLE 136 Spain Reduced Sugar Food & Beverages Market by Distribution Channel, 2022 - 2028, USD Million
- TABLE 137 Spain Reduced Sugar Food & Beverages Market by Product, 2018 - 2021, USD Million
- TABLE 138 Spain Reduced Sugar Food & Beverages Market by Product, 2022 - 2028, USD Million
- TABLE 139 Italy Reduced Sugar Food & Beverages Market, 2018 - 2021, USD Million
- TABLE 140 Italy Reduced Sugar Food & Beverages Market, 2022 - 2028, USD Million
- TABLE 141 Italy Reduced Sugar Food & Beverages Market by Distribution Channel, 2018 - 2021, USD Million
- TABLE 142 Italy Reduced Sugar Food & Beverages Market by Distribution Channel, 2022 - 2028, USD Million
- TABLE 143 Italy Reduced Sugar Food & Beverages Market by Product, 2018 - 2021, USD Million
- TABLE 144 Italy Reduced Sugar Food & Beverages Market by Product, 2022 - 2028, USD Million
- TABLE 145 Rest of Europe Reduced Sugar Food & Beverages Market, 2018 - 2021, USD Million
- TABLE 146 Rest of Europe Reduced Sugar Food & Beverages Market, 2022 - 2028, USD Million
- TABLE 147 Rest of Europe Reduced Sugar Food & Beverages Market by Distribution Channel, 2018 - 2021, USD Million
- TABLE 148 Rest of Europe Reduced Sugar Food & Beverages Market by Distribution Channel, 2022 - 2028, USD Million
- TABLE 149 Rest of Europe Reduced Sugar Food & Beverages Market by Product, 2018 - 2021, USD Million
- TABLE 150 Rest of Europe Reduced Sugar Food & Beverages Market by Product, 2022 - 2028, USD Million
- TABLE 151 Asia Pacific Reduced Sugar Food & Beverages Market, 2018 - 2021, USD Million
- TABLE 152 Asia Pacific Reduced Sugar Food & Beverages Market, 2022 - 2028, USD Million
- TABLE 153 Asia Pacific Reduced Sugar Food & Beverages Market by Distribution Channel, 2018 - 2021, USD Million
- TABLE 154 Asia Pacific Reduced Sugar Food & Beverages Market by Distribution Channel, 2022 - 2028, USD Million
- TABLE 155 Asia Pacific Supermarkets & Hypermarkets Market by Country, 2018 - 2021, USD Million
- TABLE 156 Asia Pacific Supermarkets & Hypermarkets Market by Country, 2022 - 2028, USD Million
- TABLE 157 Asia Pacific Convenience Stores Market by Country, 2018 - 2021, USD Million
- TABLE 158 Asia Pacific Convenience Stores Market by Country, 2022 - 2028, USD Million
- TABLE 159 Asia Pacific Online Market by Country, 2018 - 2021, USD Million
- TABLE 160 Asia Pacific Online Market by Country, 2022 - 2028, USD Million
- TABLE 161 Asia Pacific Others Market by Country, 2018 - 2021, USD Million
- TABLE 162 Asia Pacific Others Market by Country, 2022 - 2028, USD Million
- TABLE 163 Asia Pacific Reduced Sugar Food & Beverages Market by Product, 2018 - 2021, USD Million
- TABLE 164 Asia Pacific Reduced Sugar Food & Beverages Market by Product, 2022 - 2028, USD Million
- TABLE 165 Asia Pacific Beverages Market by Country, 2018 - 2021, USD Million
- TABLE 166 Asia Pacific Beverages Market by Country, 2022 - 2028, USD Million
- TABLE 167 Asia Pacific Bakery Market by Country, 2018 - 2021, USD Million
- TABLE 168 Asia Pacific Bakery Market by Country, 2022 - 2028, USD Million
- TABLE 169 Asia Pacific Confectionery Market by Country, 2018 - 2021, USD Million
- TABLE 170 Asia Pacific Confectionery Market by Country, 2022 - 2028, USD Million
- TABLE 171 Asia Pacific Dairy Market by Country, 2018 - 2021, USD Million
- TABLE 172 Asia Pacific Dairy Market by Country, 2022 - 2028, USD Million
- TABLE 173 Asia Pacific Snacks Market by Country, 2018 - 2021, USD Million
- TABLE 174 Asia Pacific Snacks Market by Country, 2022 - 2028, USD Million
- TABLE 175 Asia Pacific Others Market by Country, 2018 - 2021, USD Million
- TABLE 176 Asia Pacific Others Market by Country, 2022 - 2028, USD Million
- TABLE 177 Asia Pacific Reduced Sugar Food & Beverages Market by Country, 2018 - 2021, USD Million
- TABLE 178 Asia Pacific Reduced Sugar Food & Beverages Market by Country, 2022 - 2028, USD Million
- TABLE 179 China Reduced Sugar Food & Beverages Market, 2018 - 2021, USD Million
- TABLE 180 China Reduced Sugar Food & Beverages Market, 2022 - 2028, USD Million
- TABLE 181 China Reduced Sugar Food & Beverages Market by Distribution Channel, 2018 - 2021, USD Million
- TABLE 182 China Reduced Sugar Food & Beverages Market by Distribution Channel, 2022 - 2028, USD Million
- TABLE 183 China Reduced Sugar Food & Beverages Market by Product, 2018 - 2021, USD Million
- TABLE 184 China Reduced Sugar Food & Beverages Market by Product, 2022 - 2028, USD Million
- TABLE 185 Japan Reduced Sugar Food & Beverages Market, 2018 - 2021, USD Million
- TABLE 186 Japan Reduced Sugar Food & Beverages Market, 2022 - 2028, USD Million
- TABLE 187 Japan Reduced Sugar Food & Beverages Market by Distribution Channel, 2018 - 2021, USD Million
- TABLE 188 Japan Reduced Sugar Food & Beverages Market by Distribution Channel, 2022 - 2028, USD Million
- TABLE 189 Japan Reduced Sugar Food & Beverages Market by Product, 2018 - 2021, USD Million
- TABLE 190 Japan Reduced Sugar Food & Beverages Market by Product, 2022 - 2028, USD Million
- TABLE 191 India Reduced Sugar Food & Beverages Market, 2018 - 2021, USD Million
- TABLE 192 India Reduced Sugar Food & Beverages Market, 2022 - 2028, USD Million
- TABLE 193 India Reduced Sugar Food & Beverages Market by Distribution Channel, 2018 - 2021, USD Million
- TABLE 194 India Reduced Sugar Food & Beverages Market by Distribution Channel, 2022 - 2028, USD Million
- TABLE 195 India Reduced Sugar Food & Beverages Market by Product, 2018 - 2021, USD Million
- TABLE 196 India Reduced Sugar Food & Beverages Market by Product, 2022 - 2028, USD Million
- TABLE 197 South Korea Reduced Sugar Food & Beverages Market, 2018 - 2021, USD Million
- TABLE 198 South Korea Reduced Sugar Food & Beverages Market, 2022 - 2028, USD Million
- TABLE 199 South Korea Reduced Sugar Food & Beverages Market by Distribution Channel, 2018 - 2021, USD Million
- TABLE 200 South Korea Reduced Sugar Food & Beverages Market by Distribution Channel, 2022 - 2028, USD Million
- TABLE 201 South Korea Reduced Sugar Food & Beverages Market by Product, 2018 - 2021, USD Million
- TABLE 202 South Korea Reduced Sugar Food & Beverages Market by Product, 2022 - 2028, USD Million
- TABLE 203 Singapore Reduced Sugar Food & Beverages Market, 2018 - 2021, USD Million
- TABLE 204 Singapore Reduced Sugar Food & Beverages Market, 2022 - 2028, USD Million
- TABLE 205 Singapore Reduced Sugar Food & Beverages Market by Distribution Channel, 2018 - 2021, USD Million
- TABLE 206 Singapore Reduced Sugar Food & Beverages Market by Distribution Channel, 2022 - 2028, USD Million
- TABLE 207 Singapore Reduced Sugar Food & Beverages Market by Product, 2018 - 2021, USD Million
- TABLE 208 Singapore Reduced Sugar Food & Beverages Market by Product, 2022 - 2028, USD Million
- TABLE 209 Malaysia Reduced Sugar Food & Beverages Market, 2018 - 2021, USD Million
- TABLE 210 Malaysia Reduced Sugar Food & Beverages Market, 2022 - 2028, USD Million
- TABLE 211 Malaysia Reduced Sugar Food & Beverages Market by Distribution Channel, 2018 - 2021, USD Million
- TABLE 212 Malaysia Reduced Sugar Food & Beverages Market by Distribution Channel, 2022 - 2028, USD Million
- TABLE 213 Malaysia Reduced Sugar Food & Beverages Market by Product, 2018 - 2021, USD Million
- TABLE 214 Malaysia Reduced Sugar Food & Beverages Market by Product, 2022 - 2028, USD Million
- TABLE 215 Rest of Asia Pacific Reduced Sugar Food & Beverages Market, 2018 - 2021, USD Million
- TABLE 216 Rest of Asia Pacific Reduced Sugar Food & Beverages Market, 2022 - 2028, USD Million
- TABLE 217 Rest of Asia Pacific Reduced Sugar Food & Beverages Market by Distribution Channel, 2018 - 2021, USD Million
- TABLE 218 Rest of Asia Pacific Reduced Sugar Food & Beverages Market by Distribution Channel, 2022 - 2028, USD Million
- TABLE 219 Rest of Asia Pacific Reduced Sugar Food & Beverages Market by Product, 2018 - 2021, USD Million
- TABLE 220 Rest of Asia Pacific Reduced Sugar Food & Beverages Market by Product, 2022 - 2028, USD Million
- TABLE 221 LAMEA Reduced Sugar Food & Beverages Market, 2018 - 2021, USD Million
- TABLE 222 LAMEA Reduced Sugar Food & Beverages Market, 2022 - 2028, USD Million
- TABLE 223 LAMEA Reduced Sugar Food & Beverages Market by Distribution Channel, 2018 - 2021, USD Million
- TABLE 224 LAMEA Reduced Sugar Food & Beverages Market by Distribution Channel, 2022 - 2028, USD Million
- TABLE 225 LAMEA Supermarkets & Hypermarkets Market by Country, 2018 - 2021, USD Million
- TABLE 226 LAMEA Supermarkets & Hypermarkets Market by Country, 2022 - 2028, USD Million
- TABLE 227 LAMEA Convenience Stores Market by Country, 2018 - 2021, USD Million
- TABLE 228 LAMEA Convenience Stores Market by Country, 2022 - 2028, USD Million
- TABLE 229 LAMEA Online Market by Country, 2018 - 2021, USD Million
- TABLE 230 LAMEA Online Market by Country, 2022 - 2028, USD Million
- TABLE 231 LAMEA Others Market by Country, 2018 - 2021, USD Million
- TABLE 232 LAMEA Others Market by Country, 2022 - 2028, USD Million
- TABLE 233 LAMEA Reduced Sugar Food & Beverages Market by Product, 2018 - 2021, USD Million
- TABLE 234 LAMEA Reduced Sugar Food & Beverages Market by Product, 2022 - 2028, USD Million
- TABLE 235 LAMEA Beverages Market by Country, 2018 - 2021, USD Million
- TABLE 236 LAMEA Beverages Market by Country, 2022 - 2028, USD Million
- TABLE 237 LAMEA Bakery Market by Country, 2018 - 2021, USD Million
- TABLE 238 LAMEA Bakery Market by Country, 2022 - 2028, USD Million
- TABLE 239 LAMEA Confectionery Market by Country, 2018 - 2021, USD Million
- TABLE 240 LAMEA Confectionery Market by Country, 2022 - 2028, USD Million
- TABLE 241 LAMEA Dairy Market by Country, 2018 - 2021, USD Million
- TABLE 242 LAMEA Dairy Market by Country, 2022 - 2028, USD Million
- TABLE 243 LAMEA Snacks Market by Country, 2018 - 2021, USD Million
- TABLE 244 LAMEA Snacks Market by Country, 2022 - 2028, USD Million
- TABLE 245 LAMEA Others Market by Country, 2018 - 2021, USD Million
- TABLE 246 LAMEA Others Market by Country, 2022 - 2028, USD Million
- TABLE 247 LAMEA Reduced Sugar Food & Beverages Market by Country, 2018 - 2021, USD Million
- TABLE 248 LAMEA Reduced Sugar Food & Beverages Market by Country, 2022 - 2028, USD Million
- TABLE 249 Brazil Reduced Sugar Food & Beverages Market, 2018 - 2021, USD Million
- TABLE 250 Brazil Reduced Sugar Food & Beverages Market, 2022 - 2028, USD Million
- TABLE 251 Brazil Reduced Sugar Food & Beverages Market by Distribution Channel, 2018 - 2021, USD Million
- TABLE 252 Brazil Reduced Sugar Food & Beverages Market by Distribution Channel, 2022 - 2028, USD Million
- TABLE 253 Brazil Reduced Sugar Food & Beverages Market by Product, 2018 - 2021, USD Million
- TABLE 254 Brazil Reduced Sugar Food & Beverages Market by Product, 2022 - 2028, USD Million
- TABLE 255 Argentina Reduced Sugar Food & Beverages Market, 2018 - 2021, USD Million
- TABLE 256 Argentina Reduced Sugar Food & Beverages Market, 2022 - 2028, USD Million
- TABLE 257 Argentina Reduced Sugar Food & Beverages Market by Distribution Channel, 2018 - 2021, USD Million
- TABLE 258 Argentina Reduced Sugar Food & Beverages Market by Distribution Channel, 2022 - 2028, USD Million
- TABLE 259 Argentina Reduced Sugar Food & Beverages Market by Product, 2018 - 2021, USD Million
- TABLE 260 Argentina Reduced Sugar Food & Beverages Market by Product, 2022 - 2028, USD Million
- TABLE 261 UAE Reduced Sugar Food & Beverages Market, 2018 - 2021, USD Million
- TABLE 262 UAE Reduced Sugar Food & Beverages Market, 2022 - 2028, USD Million
- TABLE 263 UAE Reduced Sugar Food & Beverages Market by Distribution Channel, 2018 - 2021, USD Million
- TABLE 264 UAE Reduced Sugar Food & Beverages Market by Distribution Channel, 2022 - 2028, USD Million
- TABLE 265 UAE Reduced Sugar Food & Beverages Market by Product, 2018 - 2021, USD Million
- TABLE 266 UAE Reduced Sugar Food & Beverages Market by Product, 2022 - 2028, USD Million
- TABLE 267 Saudi Arabia Reduced Sugar Food & Beverages Market, 2018 - 2021, USD Million
- TABLE 268 Saudi Arabia Reduced Sugar Food & Beverages Market, 2022 - 2028, USD Million
- TABLE 269 Saudi Arabia Reduced Sugar Food & Beverages Market by Distribution Channel, 2018 - 2021, USD Million
- TABLE 270 Saudi Arabia Reduced Sugar Food & Beverages Market by Distribution Channel, 2022 - 2028, USD Million
- TABLE 271 Saudi Arabia Reduced Sugar Food & Beverages Market by Product, 2018 - 2021, USD Million
- TABLE 272 Saudi Arabia Reduced Sugar Food & Beverages Market by Product, 2022 - 2028, USD Million
- TABLE 273 South Africa Reduced Sugar Food & Beverages Market, 2018 - 2021, USD Million
- TABLE 274 South Africa Reduced Sugar Food & Beverages Market, 2022 - 2028, USD Million
- TABLE 275 South Africa Reduced Sugar Food & Beverages Market by Distribution Channel, 2018 - 2021, USD Million
- TABLE 276 South Africa Reduced Sugar Food & Beverages Market by Distribution Channel, 2022 - 2028, USD Million
- TABLE 277 South Africa Reduced Sugar Food & Beverages Market by Product, 2018 - 2021, USD Million
- TABLE 278 South Africa Reduced Sugar Food & Beverages Market by Product, 2022 - 2028, USD Million
- TABLE 279 Nigeria Reduced Sugar Food & Beverages Market, 2018 - 2021, USD Million
- TABLE 280 Nigeria Reduced Sugar Food & Beverages Market, 2022 - 2028, USD Million
- TABLE 281 Nigeria Reduced Sugar Food & Beverages Market by Distribution Channel, 2018 - 2021, USD Million
- TABLE 282 Nigeria Reduced Sugar Food & Beverages Market by Distribution Channel, 2022 - 2028, USD Million
- TABLE 283 Nigeria Reduced Sugar Food & Beverages Market by Product, 2018 - 2021, USD Million
- TABLE 284 Nigeria Reduced Sugar Food & Beverages Market by Product, 2022 - 2028, USD Million
- TABLE 285 Rest of LAMEA Reduced Sugar Food & Beverages Market, 2018 - 2021, USD Million
- TABLE 286 Rest of LAMEA Reduced Sugar Food & Beverages Market, 2022 - 2028, USD Million
- TABLE 287 Rest of LAMEA Reduced Sugar Food & Beverages Market by Distribution Channel, 2018 - 2021, USD Million
- TABLE 288 Rest of LAMEA Reduced Sugar Food & Beverages Market by Distribution Channel, 2022 - 2028, USD Million
- TABLE 289 Rest of LAMEA Reduced Sugar Food & Beverages Market by Product, 2018 - 2021, USD Million
- TABLE 290 Rest of LAMEA Reduced Sugar Food & Beverages Market by Product, 2022 - 2028, USD Million
- TABLE 291 Key Information - Nestle S.A.
- TABLE 292 key Information - Givaudan S.A.
- TABLE 293 Key Information - NOW Foods, Inc.
- TABLE 294 Key Information - Cargill Corporation
- TABLE 295 key information - PepsiCo, Inc.
- TABLE 296 key information - The Coca-Cola Company
- TABLE 297 Key information - Danone S.A.
- TABLE 298 Key Information - The Hain Celestial Group, Inc.
- TABLE 299 Key Information - Mondelez International, Inc.
- TABLE 300 Key Information - Unilever PLC
List of Figures
- FIG 1 Methodology for the research
- FIG 2 Global Reduced Sugar Food & Beverages Market Share by Distribution Channel, 2021
- FIG 3 Global Reduced Sugar Food & Beverages Market Share by Distribution Channel, 2028
- FIG 4 Global Reduced Sugar Food & Beverages Market by Distribution Channel, 2018 - 2028, USD Million
- FIG 5 Global Reduced Sugar Food & Beverages Market Share by Product, 2021
- FIG 6 Global Reduced Sugar Food & Beverages Market Share by Product, 2028
- FIG 7 Global Reduced Sugar Food & Beverages Market by Product, 2018 - 2028, USD Million
- FIG 8 Global Reduced Sugar Food & Beverages Market Share by Region, 2021
- FIG 9 Global Reduced Sugar Food & Beverages Market Share by Region, 2028
- FIG 10 Global Reduced Sugar Food & Beverages Market by Region, 2018 - 2028, USD Million
The Global Reduced Sugar Food & Beverages Market size is expected to reach $79.5 billion by 2028, rising at a market growth of 8.6% CAGR during the forecast period.
Low- or no-added-sugar fruit snacks are confections that use minimal or no artificial sweeteners. There are several reduced-sugar fruit snacks available on the market, including fruit strips and fruit bars. Increasing purchasing power and shifting customer preferences toward ready-to-eat and healthful convenience foods would increase the market demand for fruit snacks with decreased sugar.
To serve a large client base, several enterprises are offering fruit snacks with improved quality and choice for effective distribution networks. In addition, increased consumer expenditure on healthy items would bolster demand and growth of the reduced sugar fruit snack market throughout the projection period. The food and beverage business is seeing several trends and innovations in its product range, which will provide new growth prospects for market participants.
As customers are highly dependent on snacks, they must consume nutritious snacks. Because consuming unhealthy snacks may lead to a variety of health problems, such as weight gain or obesity. Snacks are an important aspect of a person's diet since bad snacking can lead to a variety of health problems, whilst good snacking can aid in the maintenance of physical health.
Due to this, the demand for healthy snacking options, such as fruit snacks with less sugar, will rise in the future years. The increased incidence of disorders requiring a certain amount of food between regular meals, such as diabetes and low blood pressure. In addition, the increased adoption of a variety of snacking goods, such as fruit snacks with reduced sugar, by the majority of the population contributes to the market's expansion.
COVID - 19 Impact Analysis
The tremendous increase in sales of ready-to-eat foods in retail distribution channels was caused in part by consumers' panicked purchases of food supplies during the early phase of the lockdown. In recent years, however, the rising health concerns related to the sanitation and safety of processed foods have impacted the market for these items, as consumers have opted for raw ingredients to prepare their meals at home. This would offer up new growth opportunities for the leading industry players in the coming years. High customer demand for gluten-free, vegetarian, and meat-free low-sugar snack choices will drive the market for low-sugar fruit snacks throughout the projection period.
Market Growth Factors
Rising prevalence of obesity
Obesity is one of the most significant threats to public health that the 21st century has seen, and it is a problem that is present in every country on the planet. Adult obesity is a major risk factor contributing to poor health and premature mortality from various conditions. These conditions include cardiovascular disease, osteoarthritis, diabetes, and numerous prevalent malignancies. The prevalence of overweight and obesity is increasing at an alarming rate among both children and adults. This beverage contains artificial sweeteners, which are only used in trace amounts because they are 600 times sweeter than regular sugar.
The Increasing Prevalence of Diseases Caused by Lifestyle
As more and more individuals become aware of the benefits of adopting a healthy lifestyle, sugar-free energy drinks are seeing a meteoric rise in popularity. Carbonated soft drinks were a big contributor to the rising obesity crisis, and sugar-free energy drinks have emerged as a superior alternative to fill the void left by their consumption. Some of the most well-known brands of sugar-free energy drinks, such as Red Bull, Monster, and Rockstar, are included on the list of the most commonly consumed sugar-free energy drinks.
Market Restraining Factors
Concerns regarding the use of artificial sweeteners in medical research
One of the problems that are hindering the expansion of the sugar-free food and beverage business is lower adoption owing to ambiguity regarding the safety profile of artificial sweeteners. There is evidence that using artificial sweeteners can lead to adverse health effects. A comparison was made between the risk of metabolic syndromes in two different groups of people: one group consisted of people who consumed beverages sweetened with sugar, and the other group consisted of people who consumed beverages sweetened with artificial sweeteners.
Distribution Channel Outlook
On the basis of Distribution Channels, the Reduced Sugar Food & Beverages Market is divided into Supermarkets & Hypermarkets, Convenience Stores, Online, and Others. The online segment registered a substantial revenue share in the reduced sugar food & beverages market in 2021. Because more people now have access to smartphones and other such devices, which has led to an increase in the number of people using the internet. In addition, the rising desire among consumers across the world for the use of an online platform for grocery shopping is another factor that will help the expansion of the market throughout the projected period.
Product Outlook
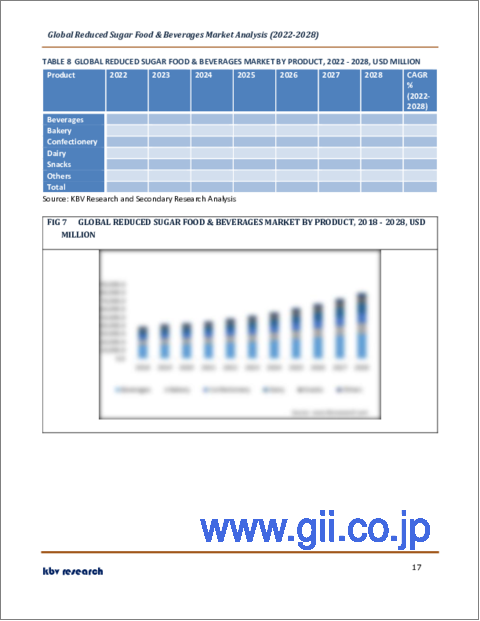
Based on the Product, the Reduced Sugar Food & Beverages Market is segmented into Bakery, Beverages, Confectionery, Dairy, Snacks, and Others. The beverages segment acquired the highest revenue share in the reduced sugar food & beverages market in 2021. Because there is a large demand around the world for sports and energy beverages that are better for consumers and have fewer added sugars. In addition, the growing demand for flavored waters and carbonated soft drinks that have lower levels of sugar and higher levels of minerals is another factor that is contributing to the expansion of the market.
Regional Outlook
Region-wise, the Reduced Sugar Food & Beverages Market is analyzed across North America, Europe, Asia Pacific, and LAMEA. The North America segment garnered the highest revenue share in the reduced sugar food & beverages market in 2021. The primary factor that is driving this market is the rise in the number of diabetics living in this region, which has led to an increase in the demand for food items that contain less sugar in this region. According to the National Diabetes Statistics Report, there are approximately 37.3 million persons in the United States who are living with diabetes.
The market research report covers the analysis of key stake holders of the market. Key companies profiled in the report include Nestle S.A., Hain Celestial Group, Inc., Unilever plc, NOW Foods, Inc., Givaudan S.A., Cargill Corporation, The Coca-Cola Company, PepsiCo, Inc., Danone S.A. and Mondelez International.
Strategies deployed in Reduced Sugar Food & Beverages Market
2022-Aug: Mondelez took over Clif Bar & Company, a leading U.S. maker of healthy energy bars with natural ingredients. This acquisition focused on expanding Mondelez International's global snack bar business, with leading brands such as CLIF, CLIF Kid, and LUNA joining the company's refrigerated snacking business Perfect Snacks in the U.S. and showing performance nutrition company Grenade in the U.K. Moreover, the acquisition also offers the company's strategy to reshape its offering to provide higher and more tolerable growth.
2021-Dec: Hain Celestial completed the acquisition of Parmcrisps and Thinsters, high-protein, low-carb cheese crisps, and snack mixes. This acquisition would coincide with Hain Celestial's Hain 3.0 enterprise strategy.
2020-Sep: PepsiCo launched Tropicana Lean range, which contains 40% less sugar and calories. The Tropicana range is produced from 100% recyclable material and includes no artificial sweeteners. Moreover, the company focused on managing sugar content, which is the main obstacle for shoppers buying food and beverage products, especially families.
2020-Jul: Cargill introduced C TruSweet 01795, a 95% pure fructose syrup. The C TruSweet's rapid onset of sweetness is perfect for highlighting fruity tastes in drinks and food, such as fruit preparation and fillings, dairy, ice creams, and sports nutrition products.
2019-Nov: Coca-Cola unveiled the Rani Float, a real fruit piece along with higher content juice. This launch aimed to deliver more options to customers and appeal to their various preferences and tastes across beverage varieties.
2019-Jun: Mondelez unveiled the Dairy Milk chocolate with 30% less sugar. The dairy milk chocolate would be presented instantly in the UK and India, creating it the chocolate maker's first such action to decrease sugar in its products in India.
2018-Apr: Coca-Cola introduced a no-sugar version of Thums Up. This launch aimed to enable coca-cola to broaden the brand's impression and propel its growth. Moreover, the launch focused on increasing consumer choices for healthier drinks.
Scope of the Study
Market Segments covered in the Report:
By Distribution Channel
- Supermarkets & Hypermarkets
- Convenience Stores
- Online
- Others
By Product
- Beverages
- Bakery
- Confectionery
- Dairy
- Snacks
- Others
By Geography
- North America
- US
- Canada
- Mexico
- Rest of North America
- Europe
- Germany
- UK
- France
- Russia
- Spain
- Italy
- Rest of Europe
- Asia Pacific
- China
- Japan
- India
- South Korea
- Singapore
- Malaysia
- Rest of Asia Pacific
- LAMEA
- Brazil
- Argentina
- UAE
- Saudi Arabia
- South Africa
- Nigeria
- Rest of LAMEA
Companies Profiled
- Nestle S.A.
- Hain Celestial Group, Inc.
- Unilever plc
- NOW Foods, Inc.
- Givaudan S.A.
- Cargill Corporation
- The Coca-Cola Company
- PepsiCo, Inc.
- Danone S.A.
- Mondelez International
Unique Offerings from KBV Research
- Exhaustive coverage
- Highest number of market tables and figures
- Subscription based model available
- Guaranteed best price
- Assured post sales research support with 10% customization free
Table of Contents
Chapter 1. Market Scope & Methodology
- 1.1 Market Definition
- 1.2 Objectives
- 1.3 Market Scope
- 1.4 Segmentation
- 1.4.1 Global Reduced Sugar Food & Beverages Market, by Distribution Channel
- 1.4.2 Global Reduced Sugar Food & Beverages Market, by Product
- 1.4.3 Global Reduced Sugar Food & Beverages Market, by Geography
- 1.5 Methodology for the research
Chapter 2. Market Overview
- 2.1 Introduction
- 2.1.1 Overview
- 2.1.1.1 Market Composition & Scenarios
- 2.1.1 Overview
- 2.2 Key Factors Impacting the Market
- 2.2.1 Market Drivers
- 2.2.2 Market Restraints
Chapter 3. Strategies deployed in Reduced Sugar Food & Beverages Market
Chapter 4. Global Reduced Sugar Food & Beverages Market by Distribution Channel
- 4.1 Global Supermarkets & Hypermarkets Market by Region
- 4.2 Global Convenience Stores Market by Region
- 4.3 Global Online Market by Region
- 4.4 Global Others Market by Region
Chapter 5. Global Reduced Sugar Food & Beverages Market by Product
- 5.1 Global Beverages Market by Region
- 5.2 Global Bakery Market by Region
- 5.3 Global Confectionery Market by Region
- 5.4 Global Dairy Market by Region
- 5.5 Global Snacks Market by Region
- 5.6 Global Others Market by Region
Chapter 6. Global Reduced Sugar Food & Beverages Market by Region
- 6.1 North America Reduced Sugar Food & Beverages Market
- 6.1.1 North America Reduced Sugar Food & Beverages Market by Distribution Channel
- 6.1.1.1 North America Supermarkets & Hypermarkets Market by Country
- 6.1.1.2 North America Convenience Stores Market by Country
- 6.1.1.3 North America Online Market by Country
- 6.1.1.4 North America Others Market by Country
- 6.1.2 North America Reduced Sugar Food & Beverages Market by Product
- 6.1.2.1 North America Beverages Market by Country
- 6.1.2.2 North America Bakery Market by Country
- 6.1.2.3 North America Confectionery Market by Country
- 6.1.2.4 North America Dairy Market by Country
- 6.1.2.5 North America Snacks Market by Country
- 6.1.2.6 North America Others Market by Country
- 6.1.3 North America Reduced Sugar Food & Beverages Market by Country
- 6.1.3.1 US Reduced Sugar Food & Beverages Market
- 6.1.3.1.1 US Reduced Sugar Food & Beverages Market by Distribution Channel
- 6.1.3.1.2 US Reduced Sugar Food & Beverages Market by Product
- 6.1.3.2 Canada Reduced Sugar Food & Beverages Market
- 6.1.3.2.1 Canada Reduced Sugar Food & Beverages Market by Distribution Channel
- 6.1.3.2.2 Canada Reduced Sugar Food & Beverages Market by Product
- 6.1.3.3 Mexico Reduced Sugar Food & Beverages Market
- 6.1.3.3.1 Mexico Reduced Sugar Food & Beverages Market by Distribution Channel
- 6.1.3.3.2 Mexico Reduced Sugar Food & Beverages Market by Product
- 6.1.3.4 Rest of North America Reduced Sugar Food & Beverages Market
- 6.1.3.4.1 Rest of North America Reduced Sugar Food & Beverages Market by Distribution Channel
- 6.1.3.4.2 Rest of North America Reduced Sugar Food & Beverages Market by Product
- 6.1.3.1 US Reduced Sugar Food & Beverages Market
- 6.1.1 North America Reduced Sugar Food & Beverages Market by Distribution Channel
- 6.2 Europe Reduced Sugar Food & Beverages Market
- 6.2.1 Europe Reduced Sugar Food & Beverages Market by Distribution Channel
- 6.2.1.1 Europe Supermarkets & Hypermarkets Market by Country
- 6.2.1.2 Europe Convenience Stores Market by Country
- 6.2.1.3 Europe Online Market by Country
- 6.2.1.4 Europe Others Market by Country
- 6.2.2 Europe Reduced Sugar Food & Beverages Market by Product
- 6.2.2.1 Europe Beverages Market by Country
- 6.2.2.2 Europe Bakery Market by Country
- 6.2.2.3 Europe Confectionery Market by Country
- 6.2.2.4 Europe Dairy Market by Country
- 6.2.2.5 Europe Snacks Market by Country
- 6.2.2.6 Europe Others Market by Country
- 6.2.3 Europe Reduced Sugar Food & Beverages Market by Country
- 6.2.3.1 Germany Reduced Sugar Food & Beverages Market
- 6.2.3.1.1 Germany Reduced Sugar Food & Beverages Market by Distribution Channel
- 6.2.3.1.2 Germany Reduced Sugar Food & Beverages Market by Product
- 6.2.3.2 UK Reduced Sugar Food & Beverages Market
- 6.2.3.2.1 UK Reduced Sugar Food & Beverages Market by Distribution Channel
- 6.2.3.2.2 UK Reduced Sugar Food & Beverages Market by Product
- 6.2.3.3 France Reduced Sugar Food & Beverages Market
- 6.2.3.3.1 France Reduced Sugar Food & Beverages Market by Distribution Channel
- 6.2.3.3.2 France Reduced Sugar Food & Beverages Market by Product
- 6.2.3.4 Russia Reduced Sugar Food & Beverages Market
- 6.2.3.4.1 Russia Reduced Sugar Food & Beverages Market by Distribution Channel
- 6.2.3.4.2 Russia Reduced Sugar Food & Beverages Market by Product
- 6.2.3.5 Spain Reduced Sugar Food & Beverages Market
- 6.2.3.5.1 Spain Reduced Sugar Food & Beverages Market by Distribution Channel
- 6.2.3.5.2 Spain Reduced Sugar Food & Beverages Market by Product
- 6.2.3.6 Italy Reduced Sugar Food & Beverages Market
- 6.2.3.6.1 Italy Reduced Sugar Food & Beverages Market by Distribution Channel
- 6.2.3.6.2 Italy Reduced Sugar Food & Beverages Market by Product
- 6.2.3.7 Rest of Europe Reduced Sugar Food & Beverages Market
- 6.2.3.7.1 Rest of Europe Reduced Sugar Food & Beverages Market by Distribution Channel
- 6.2.3.7.2 Rest of Europe Reduced Sugar Food & Beverages Market by Product
- 6.2.3.1 Germany Reduced Sugar Food & Beverages Market
- 6.2.1 Europe Reduced Sugar Food & Beverages Market by Distribution Channel
- 6.3 Asia Pacific Reduced Sugar Food & Beverages Market
- 6.3.1 Asia Pacific Reduced Sugar Food & Beverages Market by Distribution Channel
- 6.3.1.1 Asia Pacific Supermarkets & Hypermarkets Market by Country
- 6.3.1.2 Asia Pacific Convenience Stores Market by Country
- 6.3.1.3 Asia Pacific Online Market by Country
- 6.3.1.4 Asia Pacific Others Market by Country
- 6.3.2 Asia Pacific Reduced Sugar Food & Beverages Market by Product
- 6.3.2.1 Asia Pacific Beverages Market by Country
- 6.3.2.2 Asia Pacific Bakery Market by Country
- 6.3.2.3 Asia Pacific Confectionery Market by Country
- 6.3.2.4 Asia Pacific Dairy Market by Country
- 6.3.2.5 Asia Pacific Snacks Market by Country
- 6.3.2.6 Asia Pacific Others Market by Country
- 6.3.3 Asia Pacific Reduced Sugar Food & Beverages Market by Country
- 6.3.3.1 China Reduced Sugar Food & Beverages Market
- 6.3.3.1.1 China Reduced Sugar Food & Beverages Market by Distribution Channel
- 6.3.3.1.2 China Reduced Sugar Food & Beverages Market by Product
- 6.3.3.2 Japan Reduced Sugar Food & Beverages Market
- 6.3.3.2.1 Japan Reduced Sugar Food & Beverages Market by Distribution Channel
- 6.3.3.2.2 Japan Reduced Sugar Food & Beverages Market by Product
- 6.3.3.3 India Reduced Sugar Food & Beverages Market
- 6.3.3.3.1 India Reduced Sugar Food & Beverages Market by Distribution Channel
- 6.3.3.3.2 India Reduced Sugar Food & Beverages Market by Product
- 6.3.3.4 South Korea Reduced Sugar Food & Beverages Market
- 6.3.3.4.1 South Korea Reduced Sugar Food & Beverages Market by Distribution Channel
- 6.3.3.4.2 South Korea Reduced Sugar Food & Beverages Market by Product
- 6.3.3.5 Singapore Reduced Sugar Food & Beverages Market
- 6.3.3.5.1 Singapore Reduced Sugar Food & Beverages Market by Distribution Channel
- 6.3.3.5.2 Singapore Reduced Sugar Food & Beverages Market by Product
- 6.3.3.6 Malaysia Reduced Sugar Food & Beverages Market
- 6.3.3.6.1 Malaysia Reduced Sugar Food & Beverages Market by Distribution Channel
- 6.3.3.6.2 Malaysia Reduced Sugar Food & Beverages Market by Product
- 6.3.3.7 Rest of Asia Pacific Reduced Sugar Food & Beverages Market
- 6.3.3.7.1 Rest of Asia Pacific Reduced Sugar Food & Beverages Market by Distribution Channel
- 6.3.3.7.2 Rest of Asia Pacific Reduced Sugar Food & Beverages Market by Product
- 6.3.3.1 China Reduced Sugar Food & Beverages Market
- 6.3.1 Asia Pacific Reduced Sugar Food & Beverages Market by Distribution Channel
- 6.4 LAMEA Reduced Sugar Food & Beverages Market
- 6.4.1 LAMEA Reduced Sugar Food & Beverages Market by Distribution Channel
- 6.4.1.1 LAMEA Supermarkets & Hypermarkets Market by Country
- 6.4.1.2 LAMEA Convenience Stores Market by Country
- 6.4.1.3 LAMEA Online Market by Country
- 6.4.1.4 LAMEA Others Market by Country
- 6.4.2 LAMEA Reduced Sugar Food & Beverages Market by Product
- 6.4.2.1 LAMEA Beverages Market by Country
- 6.4.2.2 LAMEA Bakery Market by Country
- 6.4.2.3 LAMEA Confectionery Market by Country
- 6.4.2.4 LAMEA Dairy Market by Country
- 6.4.2.5 LAMEA Snacks Market by Country
- 6.4.2.6 LAMEA Others Market by Country
- 6.4.3 LAMEA Reduced Sugar Food & Beverages Market by Country
- 6.4.3.1 Brazil Reduced Sugar Food & Beverages Market
- 6.4.3.1.1 Brazil Reduced Sugar Food & Beverages Market by Distribution Channel
- 6.4.3.1.2 Brazil Reduced Sugar Food & Beverages Market by Product
- 6.4.3.2 Argentina Reduced Sugar Food & Beverages Market
- 6.4.3.2.1 Argentina Reduced Sugar Food & Beverages Market by Distribution Channel
- 6.4.3.2.2 Argentina Reduced Sugar Food & Beverages Market by Product
- 6.4.3.3 UAE Reduced Sugar Food & Beverages Market
- 6.4.3.3.1 UAE Reduced Sugar Food & Beverages Market by Distribution Channel
- 6.4.3.3.2 UAE Reduced Sugar Food & Beverages Market by Product
- 6.4.3.4 Saudi Arabia Reduced Sugar Food & Beverages Market
- 6.4.3.4.1 Saudi Arabia Reduced Sugar Food & Beverages Market by Distribution Channel
- 6.4.3.4.2 Saudi Arabia Reduced Sugar Food & Beverages Market by Product
- 6.4.3.5 South Africa Reduced Sugar Food & Beverages Market
- 6.4.3.5.1 South Africa Reduced Sugar Food & Beverages Market by Distribution Channel
- 6.4.3.5.2 South Africa Reduced Sugar Food & Beverages Market by Product
- 6.4.3.6 Nigeria Reduced Sugar Food & Beverages Market
- 6.4.3.6.1 Nigeria Reduced Sugar Food & Beverages Market by Distribution Channel
- 6.4.3.6.2 Nigeria Reduced Sugar Food & Beverages Market by Product
- 6.4.3.7 Rest of LAMEA Reduced Sugar Food & Beverages Market
- 6.4.3.7.1 Rest of LAMEA Reduced Sugar Food & Beverages Market by Distribution Channel
- 6.4.3.7.2 Rest of LAMEA Reduced Sugar Food & Beverages Market by Product
- 6.4.3.1 Brazil Reduced Sugar Food & Beverages Market
- 6.4.1 LAMEA Reduced Sugar Food & Beverages Market by Distribution Channel
Chapter 7. Company Profiles
- 7.1 Nestle S.A.
- 7.1.1 Company Overview
- 7.1.2 Financial Analysis
- 7.1.3 Segmental and Regional Analysis
- 7.1.4 Research & Development Expense
- 7.2 Givaudan S.A.
- 7.2.1 Company Overview
- 7.2.2 Financial Analysis
- 7.2.3 Segmental and Regional Analysis
- 7.2.4 Research & Development Expense
- 7.3 NOW Foods, Inc.
- 7.3.1 Company Overview
- 7.4 Cargill Corporation
- 7.4.1 Company Overview
- 7.4.2 Recent strategies and developments:
- 7.4.2.1 Product Launches and Product Expansions:
- 7.5 PepsiCo, Inc.
- 7.5.1 Company Overview
- 7.5.2 Financial Analysis
- 7.5.3 Segmental and Regional Analysis
- 7.5.4 Research & Development Expense
- 7.5.5 Recent strategies and developments:
- 7.5.5.1 Product Launches and Product Expansions:
- 7.6 The Coca-Cola Company
- 7.6.1 Company Overview
- 7.6.2 Financial Analysis
- 7.6.3 Segmental and Regional Analysis
- 7.6.4 Recent strategies and developments:
- 7.6.4.1 Product Launches and Product Expansions:
- 7.7 Danone S.A. (Sofina Group)
- 7.7.1 Company Overview
- 7.7.2 Financial Analysis
- 7.8 The Hain Celestial Group, Inc.
- 7.8.1 Company overview
- 7.8.2 Financial Analysis
- 7.8.3 Regional Analysis
- 7.8.4 Research & Development Expense
- 7.8.5 Recent strategies and developments:
- 7.8.5.1 Acquisition and Mergers:
- 7.9 Mondelez International, Inc.
- 7.9.1 Company Overview
- 7.9.2 Financial Analysis
- 7.9.3 Regional Analysis
- 7.9.4 Recent strategies and developments:
- 7.9.4.1 Product Launches and Product Expansions:
- 7.9.4.2 Acquisition and Mergers:
- 7.10. Unilever PLC (Tazo Tea)
- 7.10.1 Company Overview
- 7.10.2 Financial Analysis
- 7.10.3 Segmental and Regional Analysis
- 7.10.4 Research & Development Expense