
シェアードモビリティ市場:2025-2030年
Shared Mobility Market: 2025-2030- 発行日
- ページ情報
- 英文
- 納期
- 即日から翌営業日
- 商品コード
- 1754849
- 翻訳ツール提供対象 PDF対応AI翻訳ツールの無料貸し出しサービスのご利用が可能です
- 通信/IT関連専門 通信/IT関連専門を専門とする市場調査会社です。
概要
シェアードモビリティサービス、2028年までに世界人口の4分の1が導入へ
| 主要統計 | |
|---|---|
| 2025年の世界のシェアードモビリティの市場規模 | 1,040億米ドル |
| 2030年の世界のシェアードモビリティの市場規模 | 2,050億米ドル |
| 2025年~2030年のシェアードモビリティ市場全体の成長率 | 98% |
| 予測期間 | 2025-2030年 |
当調査パッケージは、急速に変化するシェアードモビリティ市場の詳細な分析を提供します。シェアードモビリティサービスプロバイダーは、主要なモビリティ動向と課題、潜在的な成長機会、競合環境を理解することができます。
当調査スイートには、シェアードモビリティ市場の今後の成長をマッピングするデータへのアクセスが含まれています。詳細な調査では、市場内の最新の機会と動向を明らかにし、シェアードモビリティサービスプロバイダー15社に関する広範な分析を含む洞察に満ちた資料を提供しています。一般市民の認識、マルチモーダル計画能力、アクセシビリティへの課題などの側面が、レポート全体を通して探求されています。
主な特徴
- 市場力学:シェアードモビリティ市場における主要なモビリティ動向と市場拡大の課題に関する洞察を提供します。公共部門と民間部門の分断、規制の複雑さ、運用コストの維持、アクセシビリティの問題がもたらす課題を取り上げ、シェアードモビリティが採用される複数の使用事例も分析しています。さらに調査では、シェアードモビリティの今後の展望も示しています。
- 主な要点と戦略的提言:市場開拓の主な機会と調査結果を詳細に分析し、新興動向と今後の市場の展開に関するシェアードモビリティサービスプロバイダーへの戦略的提言を提供します。
- ベンチマーク業界予測:予測には、ライドヘイリング、カーシェアリング、eスクーター、バイクシェアリングに分かれたシェアードモビリティに関するデータが含まれます。これには、各セグメントの移動回数や移動距離などの指標が含まれます。この予測には、MaaS (Mobility-as-a-Service) と公共交通機関に関するデータも含まれ、消費者ユーザーと企業ユーザー、収益、節約額に分かれています。
- Juniper Researchの競合リーダーボード:シェアードモビリティベンダー15社の能力を評価し、シェアードモビリティ業界の主要企業を中心に分析しています。
サンプルビュー
市場データ・予測レポート
サンプル
市場動向・戦略レポート
市場データ&予測レポート
当調査スイートには、132の表と60,000以上のデータポイントからなる予測データ一式へのアクセスが含まれています。調査スイートには以下の指標が含まれます:
- シェアードモビリティとMaaSの総ユーザー数
- シェアードモビリティとMaaSサービスの総支出額
- シェアードモビリティとMaaSの走行距離
調査スイートのシェアードモビリティ部分には、以下の指標が含まれます:
- シェアードモビリティのユーザー数
- シェアードモビリティサービスの総支出額
- シェアードモビリティの走行数
- シェアードモビリティの走行距離
これらの指標は、以下の主要市場について提供されています:
- ライドヘイリング
- カーシェアリング
- Eスクーター
- バイクシェアリング
調査のMaaS部分には以下の指標が含まれます:
- MaaSおよびMaaS対応公共交通機関のユーザー数
- MaaSおよびMaaS対応公共交通利用者からの収益
- MaaSおよびMaaS対応公共交通機関の走行数
これらの指標は、以下の市場別で提供されている:
- 消費者向けMaaSのユーザー数と収益
- 法人向けMaaSのユーザー数と収益
- 消費者向けMaaSによる節約額
- 企業向けMaaSによる節約額
- バス・鉄道サービス
Juniper Researchのインタラクティブ予測 (Excel) には以下の機能があります:
- 統計分析:データ期間中のすべての地域と国について表示される特定の指標を検索できます。グラフは簡単に変更でき、クリップボードへのエクスポートも可能です。
- 国別データツール:このツールでは、予測期間中のすべての地域と国の指標を確認することができます。ユーザーは検索バーで表示される指標を絞り込むことができます。
- 国別比較ツール:各国を選択して比較することができます。このツールには、グラフをエクスポートする機能が含まれています。
- What-if分析:ここでユーザーは、予測指標を独自の前提条件と比較することができます。
競合リーダーボードレポート
競合リーダーボードレポートでは、シェアードモビリティソリューション分野の主要ベンダー15社について、詳細な評価と市場でのポジショニングを提供しています。これらのベンダーは、キャパシティとケイパビリティの評価、どのようなシェアードモビリティのモードを提供しているか、競合他社と差別化できる技術があるかなどに基づいて、確立されたリーダー、主要なチャレンジャー、または破壊者とチャレンジャーとして位置づけられています。
目次
市場動向と戦略
第1章 重要ポイントと戦略的提言
- 重要ポイント
- 戦略的提言
第2章 市場情勢
- シェアードモビリティの歴史
- シェアードモビリティはなぜ必要なのか?
- シェアードモビリティの種類
- 配車サービス
- マイクロモビリティ
- 電動スクーター
- 自転車シェアリング
- ライドシェア
- マイクロトランジットとシャトルサービス
- マイクロトランジット
- シャトルサービス
- アーバンエアモビリティ (UAM)
- 公共交通機関
- バス
- バス高速輸送システム(BRT)
- 電車
- トラム
- メトロシステムズ
- フェリー
- Mobility-as-a-Service
第3章 セグメント分析
- 配車サービス
- 現在の状況
- 最近の動向
- 課題
- 将来の見通し
- シェアードマイクロモビリティ
- 現在の状況
- 最近の動向
- 課題
- 将来の見通し
- ライドシェアリング
- 現在の状況
- 最近の動向
- 課題
- 将来の見通し
- アーバンエアモビリティ (UAM)
- 現在の状況
- 最近の動向
- 課題
- 将来の見通し
- 公共交通機関
- 現在の状況
- 最近の動向
- 課題
- 将来の見通し
- Mobility-as-a-Service
- 現在の状況
- 最近の動向
- 課題
- 将来の見通し
第4章 国別準備指数
- 国別準備指数:イントロダクション
- 焦点市場
- 成長市場
- 飽和市場
- 新興国市場
競合リーダーボード
第1章 Juniper Researchの競合リーダーボード
第2章 企業プロファイル
- ベンダープロファイル
- Bird Global
- BlaBlaCar
- Bolt
- Cabify
- DiDi Chuxing
- Ford Smart Mobility
- Grab
- Hertz
- Lime
- Lyft
- Ola
- Siemens Mobility
- Uber Technologies
- Zipcar
- Zoomcar
- 関連調査
データと予測
第1章 イントロダクションと調査手法
第2章 市場サマリー
- シェアードモビリティ
- シェアードモビリティのユーザー数
- シェアードモビリティの利用回数
- シェアードモビリティのサービス支出額
第3章 セグメント分割
- 配車サービス
- ユーザー数
- サービス支出額
- カーシェアリング
- ユーザー数
- サービス支出額
- 電動スクーター
- ユーザー数
- サービス支出額
- 自転車シェアリング
- ユーザー数
- サービス支出額
- MaaSと公共交通機関
- ユーザー数
- サービス支出額
目次
'Shared Mobility Services to be Adopted by One Quarter of Global Population by 2028'
| KEY STATISTICS | |
|---|---|
| Shared mobility market value globally in 2025: | $104bn |
| Shared mobility market value globally in 2030: | $205bn |
| Total shared mobility market value growth between 2025 & 2030: | 98% |
| Forecast period: | 2025-2030 |
Overview
Our "Shared Mobility" Market research suite provides detailed analysis of this rapidly changing market; allowing shared mobility service providers to gain an understanding of key mobility trends and challenges, potential growth opportunities, and the competitive environment.
Providing multiple options which can be purchased separately, the research suite includes access to data mapping the future growth of the shared mobility market. The detailed study reveals the latest opportunities and trends within the market, and an insightful document containing an extensive analysis of 15 shared mobility service providers within the space. Aspects such as public attitudes, multimodal planning capabilities, and challenges to accessibility are explored throughout the report. The coverage can also be purchased as a Full Research Suite, which contains all these elements and includes a substantial discount.
Collectively, these elements provide an effective tool for understanding this rapidly evolving market; allowing shared mobility vendors to set out their future strategies to provide effective and efficient mobility services to their customers. Its unparalleled coverage makes this research suite an incredibly useful resource for gauging the future of this complex market.
Key Features
- Market Dynamics: Insights into key mobility trends and market expansion challenges within the shared mobility market. It addresses the challenges posed by fragmentation between public and private sectors, regulatory complexity, maintaining operational costs, and accessibility problems, and also analyses multiple use cases where shared mobility is employed. Furthermore, the research provides a future outlook on the landscape of shared mobility.
- Key Takeaways & Strategic Recommendations: In-depth analysis of key development opportunities and findings within the market, accompanied by key strategic recommendations for shared mobility service providers on emerging trends and how the market is expected to evolve.
- Benchmark Industry Forecasts: The forecasts include data on shared mobility, split by ride-hailing, car sharing, e-scooter, and bike sharing. This includes metrics such as the number of journeys and distance covered for each segment. The forecast also includes data on Mobility-as-a-Service (MaaS) and public transport, split into consumer and corporate users, revenue, and savings.
- Juniper Research Competitor Leaderboard: Key player capability and capacity assessment for 15 shared mobility vendors, via the Juniper Research Competitor Leaderboard; featuring analysis around major players in the shared mobility industry.
SAMPLE VIEW
Market Data & Forecasting Report
The numbers tell you what's happening, but our written report details why, alongside the methodologies.
SAMPLE VIEW
Market Trends & Strategies Report
A comprehensive analysis of the current market landscape, alongside strategic recommendations.
Market Data & Forecasting Report
The market-leading research suite for the "shared mobility" market includes access to the full set of forecast data, consisting of 132 tables and over 60,000 datapoints. Metrics in the research suite include:
- Total Volume of Shared Mobility & MaaS Users
- Total Spend on Shared Mobility & MaaS Services
- Total Number of Shared Mobility & MaaS Journeys
The shared mobility portion of the research suite includes the following metrics:
- Total Volume of Shared Mobility Users
- Total Spend on Shared Mobility Services
- Total Number of Shared Mobility Journeys
- Total Distance Covered by Shared Mobility Journeys
These metrics are provided for the following key market verticals:
- Ride-hailing
- Car sharing
- E-scooters
- Bike sharing
The MaaS portion of the research suite includes the following metrics:
- Total Number of MaaS & MaaS-enabled Public Transport Users
- Total Revenue From MaaS & MaaS-enabled Public Transport Users
- Total Number of MaaS & MaaS-enabled Public Transport Journeys
These metrics are provided for the following market verticals:
- Consumer MaaS Users & Revenue
- Corporate MaaS Users & Revenue
- Consumer MaaS Savings
- Corporate MaaS Savings
- Bus & Train Services
The Juniper Research Interactive Forecast Excel contains the following functionality:
- Statistics Analysis: Users benefit from the ability to search for specific metrics, displayed for all regions and countries across the data period. Graphs are easily modified and can be exported to the clipboard.
- Country Data Tool: This tool allows the user to review metrics for all regions and countries in the forecast period. Users can refine the metrics displayed via the search bar.
- Country Comparison Tool: Users can select and compare each of the countries. The ability to export graphs is included in this tool.
- What-if Analysis: Here, users can compare forecast metrics against their own assumptions. 5 interactive scenarios.
Market Trends & Strategies Report
This report examines the "shared mobility" market landscape in detail. It assesses different market trends and factors that are shaping the evolution of this diverse market, such as collaboration between public services and private shared mobility providers, the trialling of autonomy in specific markets, and methods of first- and last-mile journey coverage; addressing key vertical and developing challenges, and how vendors should navigate these. As well as looking into shared mobility use cases, it also includes evaluation of the different methods of shared mobility with the highest usage rates, and those which some vendors are experimenting with; in order to assess their viability in this market.
Competitor Leaderboard Report
The Competitor Leaderboard report provides a detailed evaluation and market positioning for 15 leading vendors in the shared mobility solution space. These vendors are positioned as an established leader, leading challenger, or disruptor and challenger based on capacity and capability assessments, which modes of shared mobility they offer, and any technologies which set them apart from their competitors. The 15 vendors consist of:
|
|
|
This document is centred around the Juniper Research Competitor Leaderboard; a vendor positioning tool that provides an at-a-glance view of the competitive landscape, backed by a robust methodology.
Table of Contents
Market Trends & Strategies
1. Key Takeaways & Strategic Recommendations
- 1.1. Key Takeaways
- 1.2. Strategic Recommendations
2. Market Landscape
- 2.1. Introduction
- 2.2. Shared Mobility History
- 2.3. Why Do We Need Shared Mobility?
- 2.4. Types of Shared Mobility
- 2.4.1. Ride-hailing
- 2.4.2. Micromobility
- i. E-scooters
- Figure 2.1: Example of Dockless E-scooter Parking Zone
- ii. Bike Sharing
- Figure 2.2: Example of Docked Bike Sharing Bikes
- i. E-scooters
- 2.4.3. Ride Sharing
- 2.4.4. Microtransit & Shuttle Services
- i. Microtransit
- ii. Shuttle Services
- 2.4.5. Urban Aerial Mobility
- Figure 2.3: An Electric Air Taxi Taking Off
- 2.5. Public Transport
- i. Buses
- ii. Bus Rapid Transit (BRT)
- iii. Trains
- iv. Trams
- v. Metro Systems
- vi. Ferries
- 2.6. Mobility-as-a-Service
3. Segment Analysis
- 3.1. Ride-hailing
- 3.1.1. Current Status
- 3.1.2. Recent Developments
- 3.1.3. Challenges
- 3.1.4. Future Outlook
- Figure 3.1: Total Number of Ride-hailing Service Users (m), Globally, Split by 8 Key Regions, 2025-2030
- 3.2. Shared Micromobility
- 3.2.1. Current Status
- 3.2.2. Recent Developments
- 3.2.3. Challenges
- 3.2.4. Future Outlook
- Figure 3.2: Total Number of Shared Micromobility Users (m), Globally, Split by Key Regions, 2025-2030
- 3.3. Ride Sharing
- 3.3.1. Current Status
- 3.3.2. Recent Developments
- 3.3.3. Challenges
- 3.3.4. Future Outlook
- 3.4. Urban Aerial Mobility
- 3.4.1. Current Status
- 3.4.2. Recent Developments
- 3.4.3. Challenges
- 3.4.4. Future Outlook
- 3.5. Public Transport
- 3.5.1. Current Status
- 3.5.2. Recent Developments
- 3.5.3. Challenges
- 3.5.4. Future Outlook
- 3.6. Mobility-as-a-Service
- 3.6.1. Current Status
- Figure 3.3: Total Number of MaaS Users (m), Globally, Split by 8 Key Regions, 2025-2030
- 3.6.2. Recent Developments
- 3.6.3. Challenges
- 3.6.4. Future Outlook
- Figure 3.4: Total Number of MaaS & MaaS-enabled Public Transport Users (m), Globally, Split by 8 Key Regions, 2025-2030
- 3.6.1. Current Status
4. Country Readiness Index
- 4.1. Introduction to Country Readiness Index
- Figure 4.1: Shared Mobility Country Readiness Index: Regional Definitions
- Table 4.2: Juniper Research's Country Readiness Index Scoring Criteria: Shared Mobility
- Figure 4.3: Juniper Research's Country Readiness Index: Shared Mobility
- Figure 4.4: Shared Mobility Country Readiness Index: Market Segments
- 4.1.1. Focus Markets
- i. Youth-driven Adoption
- Figure 4.5: Total Spend on Bike Sharing Services ($m), Split by 8 Key Regions, 2025-2030
- ii. Increasing Accessibility to Public Transportation
- i. Youth-driven Adoption
- 4.1.2. Growth Markets
- i. Potential to Introduce Emerging Forms of Shared Mobility
- Figure 4.6: Total Number of Shared Mobility Users (m), Split by Six Growth Markets, 2025-2030
- ii. Strong Investment Opportunities
- Figure 4.7: Total Spend on Shared Mobility ($m), Split by Six Growth Markets, 2025-2030
- i. Potential to Introduce Emerging Forms of Shared Mobility
- 4.1.3. Saturated Markets
- Figure 4.8: Total Volume of Ride-hailing Users (m), Split by Four Saturated Markets, 2025-2030
- 4.1.4. Developing Markets
- Figure 4.9: Total Spend on Shared Mobility Services ($m), Split by Top Eight Developing Markets, 2025-2030
Competitor Leaderboard
1. Juniper Research Competitor Leaderboard
- 1.1. Why Read This Report
- Figure 1.1: Juniper Research's Competitor Leaderboard: Shared Mobility Vendors Included & Product Portfolios
- Figure 1.2: Juniper Research's Competitor Leaderboard for the Shared Mobility Market
- Table 1.3: Shared Mobility Market: Vendors & Positioning
- Table 1.4: Juniper Research's Competitor Leaderboard Heatmap for Shared Mobility Vendors
2. Company Profiles
- 2.1. Vendor Profiles
- 2.1.1. Bird Global
- i. Corporate
- Table 2.1: Bird Global's Funding Rounds ($m), 2018-2022
- ii. Geographical Spread
- iii. Key Clients & Strategic Partnerships
- iv. High-level View of Offerings
- v. Juniper Research's View: Key Strengths & Strategic Development Opportunities
- i. Corporate
- 2.1.2. BlaBlaCar
- i. Corporate
- Table 2.2: BlaBlaCar's Funding Rounds ($m), 2010-2024
- ii. Geographical Spread
- iii. Key Clients & Strategic Partnerships
- iv. High-level View of Offerings
- Figure 2.3: BlaBlaCar App
- v. Juniper Research's View: Key Strengths & Strategic Development Opportunities
- i. Corporate
- 2.1.3. Bolt
- i. Corporate
- Figure 2.4: Bolt's Funding Rounds ($m), 2020-2024
- ii. Geographical Spread
- iii. Key Clients & Strategic Partnerships
- iv. High-level View of Offerings
- v. Juniper Research's View: Key Strengths & Strategic Development Opportunities
- i. Corporate
- 2.1.4. Cabify
- i. Corporate
- Table 2.5: Cabify's Funding Rounds ($m), 2015-2024
- ii. Geographical Spread
- iii. Key Clients & Strategic Partnerships
- iv. High-level View of Offerings
- v. Juniper Research's View: Key Strengths & Strategic Development Opportunities
- i. Corporate
- 2.1.5. DiDi Chuxing
- i. Corporate
- Table 2.6: DiDi Chuxing's Financial Snapshot ($m), 2023-2024
- ii. Geographical Spread
- iii. Key Clients & Strategic Partnerships
- iv. High-level View of Offerings
- v. Juniper Research's View: Key Strengths & Strategic Development Opportunities
- i. Corporate
- 2.1.6. Ford Smart Mobility
- i. Corporate
- Table 2.7: Ford Smart Mobility's Funding Rounds ($m), 2016-2018
- ii. Geographical Spread
- iii. Key Clients & Strategic Opportunities
- iv. High-level View of Offerings
- v. Juniper Research's View: Key Strengths & Strategic Development Opportunities
- i. Corporate
- 2.1.7. Grab
- i. Corporate
- Figure 2.8: Grab's Financial Snapshot ($m), 2023-2024
- ii. Geographical Spread
- iii. Key Clients & Strategic Partnerships
- iv. High-level View of Offerings
- v. Juniper Research's View: Key Strengths & Strategic Devlopment Opportunities
- i. Corporate
- 2.1.8. Hertz
- i. Corporate
- Figure 2.9: Hertz's Financial Snapshot ($m), 2023-2024
- ii. Geographical Spread
- iii. Key Clients & Strategic Partnerships
- iv. High-level View of Offerings
- v. Juniper Research's View: Key Strengths & Strategic Development Opportunities
- i. Corporate
- 2.1.9. Lime
- i. Corporate
- Figure 2.10: Lime's Funding Rounds ($m), 2018-2021
- ii. Geographical Spread
- iii. Key Clients & Strategic Partnerships
- iv. High-level View of Offerings
- Figure 2.11: Lime's Gen 4 E-scooter
- v. Juniper Research's View: Key Strengths & Strategic Development Opportunities
- i. Corporate
- 2.1.10. Lyft
- i. Corporate
- Figure 2.12: Lyft's Financial Snapshot ($m), 2023-2024
- ii. Geographical Spread
- iii. Key Clients & Strategic Partnerships
- iv. High-level View of Offerings
- v. Juniper Research's View: Key Strengths & Strategic Development Opportunities
- i. Corporate
- 2.1.11. Ola
- i. Corporate
- Table 2.13: Ola's Funding Rounds ($m), 2019-2022
- ii. Geographical Spread
- iii. Key Clients & Strategic Partnerships
- iv. High-level View of Offerings
- v. Juniper Research's View: Key Strengths & Strategic Opportunities
- i. Corporate
- 2.1.12. Siemens Mobility
- i. Corporate
- Figure 2.14: Siemens Mobility Financial Snapshot ($m), 2023-2024
- ii. Geographical Spread
- iii. Key Clients & Strategic Partnerships
- iv. High-level View of Offerings
- v. Juniper Research's View: Key Strengths & Strategic Opportunities
- i. Corporate
- 2.1.13. Uber Technologies
- i. Corporate
- Figure 2.15: Uber Technologies Financial Snapshot ($m), 2023-2024
- ii. Geographical Spread
- iii. Key Clients & Strategic Partnerships
- iv. High-level View of Offerings
- Figure 2.16: How UberX Share Looks in the Uber App
- v. Juniper Research's View: Key Strengths & Strategic Opportunities
- i. Corporate
- 2.1.14. Zipcar
- i. Corporate
- ii. Geographical Spread
- iii. Key Clients & Strategic Partnerships
- iv. High-level View of Offerings
- v. Juniper Research's View: Key Strengths & Strategic Opportunities
- 2.1.15. Zoomcar
- i. Corporate
- Figure 2.17: Zoomcar Financial Snapshot ($m), 2023-2024
- ii. Geographical Spread
- iii. Key Clients & Strategic Partnerships
- iv. High-level View of Offerings
- v. Juniper Research's View: Key Strengths & Strategic Opportunities
- i. Corporate
- 2.1.1. Bird Global
- 2.2. Related Research
Data & Forecasting
1. Introduction & Methodology
- 1.1. Introduction
- 1.2. Methodology & Assumptions
- Figure 1.1: Ride-hailing Forecast Methodology
- Figure 1.2: Car Sharing Forecast Methodology
- Figure 1.3: E-scooter Forecast Methodology
- Figure 1.4: Bike Sharing Forecast Methodology
- Figure 1.5: MaaS & MaaS-enabled Public Transport Forecast Methodology
2. Market Summary
- 2.1. Shared Mobility
- 2.1.1. Total Volume of Shared Mobility Users
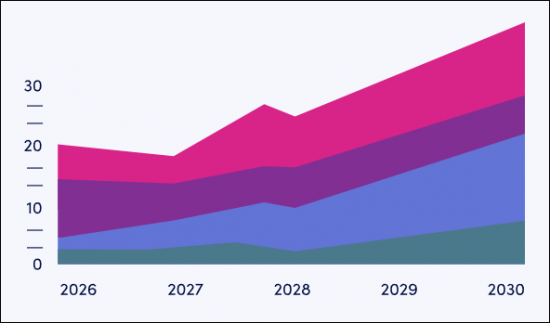
- Figure & Table 2.1: Total Volume of Shared Mobility Users (m), Globally, Split by 8 Key Regions, 2025-2030
- 2.1.2. Total Number of Shared Mobility Journeys
- Figure & Table 2.2: Total Number of Shared Mobility Journeys (m), Globally, Split by 8 Key Regions, 2025-2030
- 2.1.3. Total Spend on Shared Mobility Services
- Figure & Table 2.3: Total Spend on Shared Mobility Services ($m), Globally, Split by 8 Key Regions, 2025-2030
- 2.1.1. Total Volume of Shared Mobility Users
3. Segment Splits
- 3.1. Ride-hailing
- 3.1.1. Total Number of Ride-hailing Users
- Figure & Table 3.1: Total Number of Ride-hailing Users (m), Globally, Split by 8 Key Regions, 2025-2030
- 3.1.2. Total Spend on Ride-hailing Services
- Figure & Table 3.2: Total Spend on Ride-hailing Services ($m), Globally, Split by 8 Key Regions, 2025-2030
- 3.1.1. Total Number of Ride-hailing Users
- 3.2. Car Sharing
- 3.2.1. Total Number of Car Sharing Users
- Figure & Table 3.3: Total Number of Car Sharing Users (m), Globally, Split by 8 Key Regions, 2025-2030
- 3.2.2. Total Spend on Car Sharing Services
- Figure & Table 3.4: Total Spend on Car Sharing Services ($m), Split by 8 Key Regions, 2025-2030
- 3.2.1. Total Number of Car Sharing Users
- 3.3. E-scooters
- 3.3.1. Total Number of E-scooter Users
- Figure & Table 3.5: Total Number of E-scooter Users (m), Split by 8 Key Regions, 2025-2030
- 3.3.2. Total Spend on E-scooter Services
- Figure & Table 3.6: Total Spend on E-scooter Services ($m), Split by 8 Key Regions, 2025-2030
- 3.3.1. Total Number of E-scooter Users
- 3.4. Bike Sharing
- 3.4.1. Total Number of Bike Sharing Users
- Figure & Table 3.7: Total Number of Bike Sharing Users (m), Split by 8 Key Regions, 2025-2030
- 3.4.2. Total Spend on Bike Sharing Services
- Figure & Table 3.8: Total Spend on Bike Sharing Services ($m), Split by 8 Key Regions, 2025-2030
- 3.4.1. Total Number of Bike Sharing Users
- 3.5. MaaS & Public Transport
- 3.5.1. Total Number of MaaS & MaaS-enabled Public Transport Users
- Figure & Table 3.9: Total Number of MaaS & MaaS-enabled Public Transport Users (m), Globally, Split by 8 Key Regions, 2025-2030
- 3.5.2. Total Spend on MaaS & MaaS-enabled Public Transport Services
- Figure & Table 3.10: Total Spend on MaaS & MaaS-enabled Public Transport Services ($m), Globally, Split by 8 Key Regions, 2025-2030
- 3.5.1. Total Number of MaaS & MaaS-enabled Public Transport Users
- 発行日
- 発行
- Juniper Research Ltd
- ページ情報
- 英文
- 納期
- 即日から翌営業日


