|
|
市場調査レポート
商品コード
1745093
ロボコール対策およびブランデッドコーリング市場:2025年~2030年Robocall Mitigation & Branded Calling Market: 2025-2030 |
||||||
|
|||||||
| ロボコール対策およびブランデッドコーリング市場:2025年~2030年 |
|
出版日: 2025年06月16日
発行: Juniper Research Ltd
ページ情報: 英文
納期: 即日から翌営業日
|
全表示
- 概要
- 目次
ロボコール詐欺:世界の消費者損失は2025年には800億ドルを超える見込みだが、2026年には減少に転じる見通し
| 主要統計 | |
|---|---|
| 2025年のロボコール詐欺による被害総額: | 800億米ドル |
| 2030年のブランデッドコーリングによる総収益: | 23億米ドル |
| ブランデッドコーリング市場の成長率: | 1,720% |
| 予測期間: | 2025-2030年 |
当調査パッケージは、急速に発展するロボコール対策およびブランデッドコーリング市場の詳細な分析を提供します。モバイル事業者、規制当局、ロボコール対策およびブランデッドコーリングベンダーなどのステークホルダーは、今後の成長、主要動向、競合環境を理解することができます。また、規制環境の変化や新たな枠組みについても分析しています。
当調査スイートには、ロボコール対策とブランデッドコーリングの採用と今後の成長をマッピングしたデータへのアクセスや、最新の市場機会を明らかにする徹底的な調査など、個別に購入できるオプションがいくつか含まれています。さらに、ロボコール対策とブランデッドコーリング分野における市場リーダー19社に関する広範な分析を含む資料も含まれています。
これらを組み合わせることで、急速に進化する同市場を理解するための重要なツールとなり、ロボコール対策ベンダーやモバイル事業者は今後の戦略を立てることができます。その比類なき網羅性により、この調査スイートは、このような不確実で急成長する市場の将来を予測する上で非常に有用なリソースとなっています。
主な特徴
- 市場力学:ロボコール対策およびブランデッドコーリング市場の課題から生じる主要動向と市場への影響に関する洞察を提供します。本調査では、違法なロボコールにAIを利用する悪質業者がもたらす課題、特にAIが生成した音声を違法通話に利用すること、オーバーザトッププラットフォームやWangiri 2.0における違法なロボコールがもたらす混乱について取り上げます。本調査では、違法なロボコールに対する政府の介入や、北米の連邦通信委員会などの規制当局が課す規制と、ブランデッドコーリングなどの代替的なロボコール緩和策を評価します。主要61カ国における現在の展開と今後の成長に関する地域別の市場成長分析も含まれています。
- 主な要点と戦略的提言ロボコール対策とブランデッドコーリング市場における主な発展機会と調査結果を詳細に分析し、ステークホルダーへの戦略的提言を添えています。
- ベンチマーク業界予測:合法的な通話、違法なロボコールトラフィック、ブランド認証APIコールの市場成長について、5年間の予測データベースを提供しています。
- Juniper Researchの競合リーダーボード:Juniper Researchの競合リーダーボードでは、ロボコール対策およびブランド認証通話の主要ベンダー19社の能力を評価し、市場実績、収益、将来の事業見通しなどの基準で採点します。
サンプルビュー
市場データ・予測レポート

サンプル
市場動向・戦略レポート

市場データ&予測レポート
本調査スイートには以下の指標が含まれます:
- ロボコール総数
- 不正ロボコール総数
- 成功したロボコールの総数
- ロボコールによる詐欺被害総数
- ブランデッドコーリング認証APIコールの総数
- ブランデッドコーリング認証APIコールのプラットフォーム収益合計
Juniper Researchのインタラクティブ予測 (Excel) には以下の機能があります:
- 統計分析:ユーザーは、データ期間中のすべての地域と国について表示される特定の指標を検索できます。グラフは簡単に変更でき、クリップボードにエクスポートできます。
- 国別データツール:このツールでは、予測期間中のすべての地域と国の指標を見ることができます。検索バーで表示される指標を絞り込むことができます。
- 国別比較ツール:特定の国を選択して比較することができます。グラフのエクスポートも可能です。
- What-if分析:5つのインタラクティブなシナリオを通じて、予測の前提条件と比較することができます。
目次
市場動向・戦略
第1章 重要ポイント・戦略的提言
- 重要ポイント・戦略的提言
第2章 ロボコール対策:将来の市場展望
- ロボコール対策:イントロダクション
- AIとMLの進歩
- 不正行為におけるAI
- ロボコール対策におけるAI
- 政府と規制当局の介入
- VoIPネットワークへの移行
- 信号レベルでのロボコール対策
- オムニチャネル攻撃
- ロボコール対策の成功
- 強化されたネットワークセキュリティの要件
- ステークホルダー教育と意識向上
- 5Gネットワークへの移行
第3章 ブランデッドコーリング:将来の市場展望
- ブランデッドコーリング:イントロダクション
- ブランデッドコーリングの制限
- BCID
- 音声チャネルの価値
- モバイル加入者の認知と教育
- 音声チャネルの価値を高めるオペレータ戦略
第4章 国別準備指数
- 国別準備指数:イントロダクション
- 焦点市場
- 成長市場
- 飽和市場
- 新興国市場
競合リーダーボード
第1章 競合リーダーボード
第2章 ベンダープロファイル
- ロボコール対策とブランデッドコーリング市場:ベンダープロファイル
- BICS (Proximus Global)
- First Orion
- Hiya
- iconectiv
- LANCK Telecom
- Metaswitch
- Mobileum
- Neural Technologies
- Numeracle
- NUSO
- Ribbon Communications
- SecurityGen
- Sinch
- Subex
- TNS
- TransNexus
- TransUnion
- Twilio
- XConnect
- 調査手法
- 制限と解釈
- 関連調査
データ・予測
第1章 市場予測・重要ポイント
第2章 ロボコール対策およびブランデッドコーリングの予測
- ロボコール:予測手法
- 携帯加入者が受信したロボコールの総数
- 携帯加入者が受信した詐欺ロボコールの総数
- 成功したロボコールの総数
- ロボコールによる詐欺被害総額
第3章 ブランデッドコーリングの予測
- 予測手法・前提条件
- ブランデッドコーリング認証通話の総数
- ブランデッドコーリング認証通話のプラットフォーム総収益
'Robocalling Fraud: Global Consumer Losses to Exceed $80bn in 2025, But Will Start Declining in 2026'
| KEY STATISTICS | |
|---|---|
| Total losses to robocalling fraud in 2025: | $80bn |
| Total branded calling revenue in 2030: | $2.3bn |
| Branded calling market growth: | 1,720% |
| Forecast period: | 2025-2030 |
Overview
Our "Robocall Mitigation & Branded Calling" research suite provides a detailed analysis of this rapidly evolving market. It enables stakeholders, from mobile operators, regulators, robocall mitigation and branded calling vendors, to understand future growth, key trends, and the competitive environment. The suite also analyses changing regulatory environments and emerging frameworks.
The research suite includes several options that can be purchased separately, including access to data mapping the adoption and future growth of robocall mitigation and branded calling, and a thorough study uncovering the latest market opportunities. Additionally, it includes a document containing an extensive analysis of the 19 market leaders in the robocall mitigation and branded calling space. The coverage can also be purchased as a Full Research Suite, containing all these elements and a substantial discount.
Collectively, they provide a critical tool for understanding this rapidly evolving market; allowing robocall mitigation vendors and mobile operators to shape their future strategy. Its unparalleled coverage makes this research suite an incredibly useful resource for projecting the future of such an uncertain and fast-growing market.
All report content is delivered in the English language.
Key Features
- Market Dynamics: Insights into key trends and market impacts resulting from challenges within the robocall mitigation and branded calling market. This research addresses challenges posed by bad actors utilising AI within illegal robocalling; specifically using AI-generated voices for illegal calls, and disruption caused by unlawful robocalls on over-the-top platforms and Wangiri 2.0. The research then assesses government interventions in illegal robocalls and regulations imposed by regulators, such as the Federal Communications Commission in North America, alongside alternative robocall mitigation efforts, such as branded calling. This robocall mitigation and branded calling research also includes a regional market growth analysis on the current development and future growth of robocall mitigation and branded calling across 61 key countries.
- Key Takeaways & Strategic Recommendations: In-depth analysis of key development opportunities and findings within the robocall mitigation and branded calling market, accompanied by strategic recommendations for stakeholders.
- Benchmark Industry Forecasts: 5-year forecast databases are provided for the market growth in legitimate calls, illegal robocall traffic, and branded authentication API calls.
- Juniper Research Competitor Leaderboard: Key player capability and capacity assessment for 19 leading robocall mitigation and branded calling vendors via the Juniper Research Competitor Leaderboard; scoring these vendors on criteria such as market performance, revenue and future business prospects.
SAMPLE VIEW
Market Data & Forecasts Report

The numbers tell you what's happening, but our written report details why, alongside the methodologies.
SAMPLE VIEW
Market Trends & Strategies Report

A comprehensive analysis of the current market landscape, alongside strategic recommendations.
Market Data & Forecasts Report
The market-leading research suite for the "Robocall Mitigation & Branded Calling" market includes access to comprehensive 5-year forecast datasets of 14 tables and over 6,380 datapoints.
Metrics in the research suite include:
- Total Number of Robocalls
- Total Number of Fraudulent Robocalls
- Total Number of Successful Robocalls
- Total Fraudulent Losses to Robocalling
- Total Number of Branded Calling Authentication API Calls
- Total Platform Revenue from Branded Calling Authentication API Calls
Juniper Research Interactive Forecast Excel contains the following functionality:
- Statistics Analysis: Users can search for specific metrics displayed for all regions and countries across the data period. Graphs are easily modified and can be exported to the clipboard.
- Country Data Tool: This tool lets users look at metrics for all regions and countries in the forecast period. Users can refine the metrics displayed via a search bar.
- Country Comparison Tool: Users can select and compare specific countries. This tool also allows users to export graphs.
- What-if Analysis: Here, users can compare forecast metrics against their assumptions, via 5 interactive scenarios.
Market Trends & Strategies Report
This report examines the "Robocall Mitigation & Branded Calling" market landscape in detail; assessing market trends and factors shaping the evolution of this rapidly changing market. The report delivers a comprehensive analysis of the strategic opportunities for robocall mitigation and branded calling providers; addressing key verticals and developing challenges, and how stakeholders must navigate these. It also includes evaluation of key country-level opportunities for growth in the robocall mitigation and branded calling market.
Competitor Leaderboard Report
The Competitor Leaderboard report provides a detailed evaluation and market positioning for 19 leading Robocall Mitigation & Branded Calling vendors. The vendors are positioned as established leaders, leading challengers, or disruptors and challengers based on capacity and capability assessments:
|
|
This document is centred around the Juniper Research Competitor Leaderboard; a vendor positioning tool backed by a robust methodology that provides an at-a-glance view of a market's competitive landscape.
Table of Contents
Market Trends & Strategies
1. Key Takeaways & Strategic Recommendations
- 1.1. Key Takeaways and Strategic Recommendations
- 1.2. Key Takeaways
- 1.3. Strategic Recommendations
2. Robocall Mitigation: Future Market Outlook
- 2.1. Introduction to Robocall Mitigation
- Table 2.1: Current Robocall Mitigation Solutions
- Figure 2.2: Total Fraudulent Losses to Robocalling ($82.5 billion), Split by 8 Key Regions, 2025
- 2.2. Advancements in AI and ML
- 2.2.1. AI in Fraudulent Activity
- Figure 2.3: Average Loss to Fraudulent Robocalling per Mobile Subscriber ($), Split by 8 Key Regions, 2025-2030
- 2.2.2. AI in Robocall Mitigation
- 2.2.1. AI in Fraudulent Activity
- 2.3. Government and Regulatory Intervention
- 2.4. Shift to VoIP Networks
- 2.5. Robocall Mitigation at the Signalling Level
- 2.6. Omnichannel Attacks
- 2.7. Success in Robocall Mitigation
- Figure 2.4: Total Fraudulent Losses to Robocalling ($m), Split by 8 Key Regions, 2025-2030
- 2.8. Requirement for Enhanced Network Security
- 2.9. Stakeholder Education and Awareness
- 2.10. Shift to 5G Networks
3. Branded Calling: Future Market Outlook
- 3.1. Introduction to Branded Calling
- Figure 3.1: Total Number of Branded Calling Authentication Calls, Split by 8 Key Regions, 2025
- 3.2. Branded Calling Limitations
- 3.2.1. BCID
- 3.3. Value of the Voice Channel
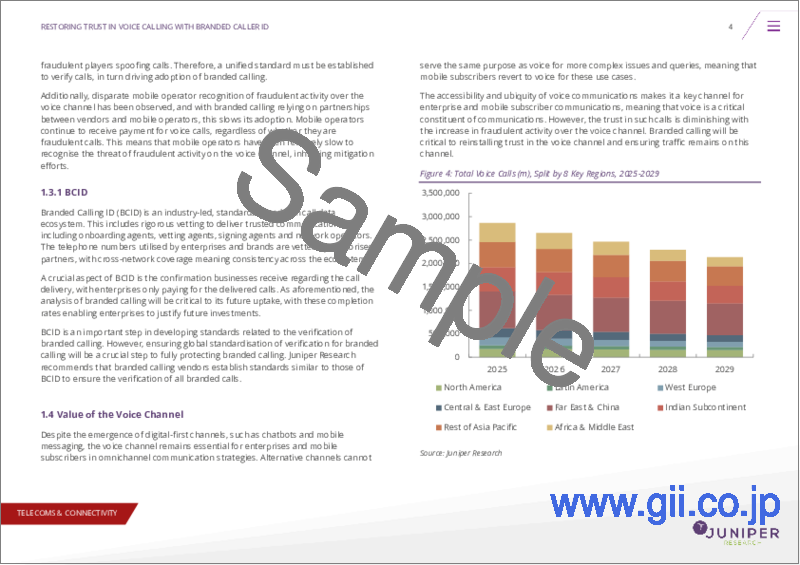
- Figure 3.2: Total Voice Calls (m), Split by 8 Key Regions, 2025-2029
- 3.4. Mobile Subscriber Awareness and Education
- 3.4.1. Operator Strategies to Increase the Value of the Voice Channel
4. Country Readiness Index
- 4.1. Introduction to Country Readiness Index
- Figure 4.1: Robocall Mitigation & Branded Calling Country Readiness Index: Regional Definitions
- Table 4.2: Juniper Research's Country Readiness Index Scoring Criteria: Robocall Mitigation & Branded Calling
- Figure 4.3: Juniper Research's Country Readiness Index: Robocall Mitigation & Branded Calling
- Table 4.4: Robocall Mitigation & Branded Calling Country Readiness Index: Market Segments
- 4.2. Focus Markets
- Figure 4.5: Average Number of Branded Calls per Subscriber in 2030, Split by Focus Markets
- 4.2.1. These Countries Rank as High-income Areas
- 4.2.2. There Is Strong Historic Investment in Technological Innovation
- 4.3. Growth Markets
- 4.3.1. Inadequate Existing Robocall Mitigation
- 4.3.2. Widening Scope of Robocall Fraud
- 4.4. Saturated Markets
- Figure 4.6: Total Number of Fraudulent Robocalls Received (m), Split by 8 Key Saturated Markets, 2025-2030
- 4.5. Developing Markets
- 4.5.1. Digital Revolutions
- 4.5.2. Expanding Scope of Robocall Fraud
- Table 4.7: Juniper Research's Country Readiness Index Heatmap: North America
- Table 4.8: Juniper Research's Country Readiness Index Heatmap: Latin America
- Table 4.9: Juniper Research's Country Readiness Index Heatmap: West Europe
- Table 4.10: Juniper Research's Country Readiness Index Heatmap: Central & East Europe
- Table 4.11: Juniper Research's Country Readiness Index Heatmap: Far East & China
- Table 4.12: Juniper Research's Country Readiness Index Heatmap: Indian Subcontinent
- Table 4.13: Juniper Research's Country Readiness Index Heatmap: Rest of Asia Pacific
- Table 4.14: Juniper Research's Country Readiness Index Heatmap: Africa & Middle East
Competitor Leaderboard
1. Competitor Leaderboard
- 1.1. Why Read This Report
- Table 1.1: Juniper Research Competitor Leaderboard: Robocall Mitigation & Branded Calling Vendors & Product Portfolio
- Figure 1.2: Juniper Research Competitor Leaderboard: Robocall Mitigation & Branded Calling Vendors
- Table 1.3: Juniper Research Competitor Leaderboard: Vendors
- Table 1.4: Juniper Research Competitor Leaderboard Heatmap: Robocall Mitigation & Branded Calling Vendors (1 of 2)
- Table 1.5: Juniper Research Competitor Leaderboard Heatmap: Robocall Mitigation & Branded Calling Vendors (2 of 2)
2. Vendor Profiles
- 2.1. Robocall Mitigation & Branded Calling Market: Vendor Profiles
- 2.1.1. BICS (Proximus Global)
- i. Corporate Information
- Table 2.1: BICS' Select Financial Information (Euro-m), 2022 & 2023
- ii. Geographical Spread
- iii. Key Clients & Strategic Partnerships
- iv. High-level View of Offerings
- v. Juniper Research's View: Key Strengths & Strategic Development Opportunities
- i. Corporate Information
- 2.1.2. First Orion
- i. Corporate Information
- ii. Geographical Spread
- iii. Key Clients & Strategic Partnerships
- iv. High-level View of Offerings
- Figure 2.2: First Orion's SENTRY Solution Process
- v. Juniper Research's View: Key Strengths & Strategic Development Opportunities
- 2.1.3. Hiya
- i. Corporate Information
- ii. Geographical Spread
- iii. Key Clients & Strategic Partnerships
- iv. High-level View of Offerings
- v. Juniper Research's View: Key Strengths & Strategic Development Opportunities
- 2.1.4. iconectiv
- i. Corporate Information
- ii. Geographical Spread
- iii. Key Clients & Strategic Partnerships
- iv. High-level View of Offerings
- v. Juniper Research's View: Key Strengths & Strategic Development Opportunities
- 2.1.5. LANCK Telecom
- i. Corporate Information
- ii. Geographical Spread
- iii. Key Clients & Strategic Partnerships
- iv. High-level View of Offerings
- Figure 2.3: LANCK Telecom's FMS Control Centre Dashboard
- v. Juniper Research's View: Key Strengths & Strategic Development Opportunities
- 2.1.6. Metaswitch
- i. Corporate Information
- ii. Geographical Spread
- iii. Key Clients & Strategic Partnerships
- iv. High-level View of Offerings
- v. Juniper Research's View: Key Strengths & Strategic Development Opportunities
- 2.1.7. Mobileum
- i. Corporate Information
- ii. Geographical Spread
- iii. Key Clients & Strategic Partnerships
- iv. High-level View of Offerings
- Figure 2.4: Mobileum's RAID Solution
- Figure 2.5: Mobileum's CLI Spoofing Prevention in Action
- v. Juniper Research's View: Key Strengths & Strategic Development Opportunities
- 2.1.8. Neural Technologies
- i. Corporate Information
- ii. Geographical Spread
- iii. Key Clients & Strategic Partnerships
- iv. High-level View of Offerings
- v. Juniper Research's View: Key Strengths & Strategic Development Opportunities
- 2.1.9. Numeracle
- i. Corporate Information
- ii. Geographical Spread
- iii. Key Clients & Strategic Partnerships
- iv. High-level View of Offerings
- Figure 2.6: Numeracle's Smart Branding
- v. Juniper Research's View: Key Strengths & Strategic Development Opportunities
- 2.1.10. NUSO
- i. Corporate Information
- ii. Geographical Spread
- iii. Key Clients & Strategic Partnerships
- iv. High-level View of Offerings
- v. Juniper Research's View: Key Strengths & Strategic Development Opportunities
- 2.1.11. Ribbon Communications
- i. Corporate Information
- ii. Geographical Spread
- iii. Key Clients & Strategic Partnerships
- iv. High-level View of Offerings
- v. Juniper Research's View: Key Strengths & Strategic Development Opportunities
- 2.1.12. SecurityGen
- i. Corporate Information
- ii. Geographical Spread
- iii. Key Clients & Strategic Partnerships
- iv. High-level View of Offerings
- v. Juniper Research's View: Key Strengths & Strategic Development Opportunities
- 2.1.13. Sinch
- i. Corporate Information
- Table 2.7: Sinch's Acquisitions, 2020-2021
- Table 2.8: Sinch's Select Financial Information ($m), 2021-2023
- ii. Geographical Spread
- iii. Key Clients & Strategic Partnerships
- iv. High-level View of Offerings
- v. Juniper Research's View: Key Strengths & Strategic Development Opportunities
- i. Corporate Information
- 2.1.14. Subex
- i. Corporate Information
- Table 2.9: Subex's Financial Information ($m), 2022 and 2023
- ii. Geographical Spread
- iii. Key Clients & Strategic Partnerships
- iv. High-level View of Offerings
- v. Juniper Research's View: Key Strengths & Strategic Development Opportunities
- i. Corporate Information
- 2.1.15. TNS
- i. Corporate Information
- ii. Geographical Spread
- iii. Key Clients & Strategic Partnerships
- iv. High-level View of Offerings
- Figure 2.10: TNS Call Guardian Authentication
- v. Juniper Research's View: Key Strengths & Strategic Development Opportunities
- 2.1.16. TransNexus
- i. Corporate Information
- ii. Geographical Spread
- iii. Key Clients & Strategic Partnerships
- iv. High-level View of Offerings
- Figure 2.11: TransNexus STIR/SHAKEN Solution
- v. Juniper Research's View: Key Strengths & Strategic Development Opportunities
- 2.1.17. TransUnion
- i. Corporate Information
- ii. Geographical Spread
- iii. Key Clients & Strategic Partnerships
- iv. High-level View of Offerings
- v. Juniper Research's View: Key Strengths & Strategic Development Opportunities
- 2.1.18. Twilio
- i. Corporate Information
- Table 2.12: Twilio's Acquisitions, November 2019-present
- Table 2.13: Twilio's Revenue ($m), 2021-2023
- ii. Geographical Spread
- iii. Key Clients & Strategic Partnerships
- iv. High-level View of Offerings
- v. Juniper Research's View: Key Strengths & Strategic Development Opportunities
- i. Corporate Information
- 2.1.19. XConnect
- i. Corporate Information
- ii. Geographical Spread
- iii. Key Clients & Strategic Partnerships
- iv. High-level View of Offerings
- v. Juniper Research's View: Key Strengths & Strategic Development Opportunities
- 2.1.1. BICS (Proximus Global)
- 2.2. Juniper Research Leaderboard Methodology
- 2.3. Limitations & Interpretations
- Table 2.14: Juniper Research Competitor Leaderboard Scoring Criteria: Robocall Mitigation and Branded Calling Vendors
- 2.4. Related Research
Data & Forecasting
1. Market Forecasts & Key Takeaways
- 1.1. Introduction to Robocall Mitigation & Branded Calling Market Forecasts
- Figure 1.1: Total Number of Fraudulent Robocalls Received by Mobile Subscribers (m), Split by 8 Key Regions, 2025 and 2030
- Figure 1.2: Total Number of Branded Calling Authentication Calls (m), Split by 8 Key Regions, 2025 and 2030
2. Robocalling and Fraudulent Robocalling Forecast
- 2.1. Introduction to Robocall Forecasts
- Figure 2.1: Total Number of Successful Robocalls (66 million), Split by 8 Key Regions, 2025
- 2.1.1. Robocall Forecast Methodology
- Figure 2.2: Robocall Mitigation & Branded Calling Market: Forecast Methodology
- 2.1.2. Total Number of Robocalls Received by Mobile Subscribers
- Figure & Table 2.3: Total Number of Robocalls Received by Mobile Subscribers (m), Split by 8 Key Regions, 2025-2030
- 2.1.3. Total Number of Fraudulent Robocalls Received by Mobile Subscribers
- Figure & Table 2.4: Total Number of Fraudulent Robocalls Received by Mobile Subscribers (m), Split by 8 Key Regions, 2025-2030
- 2.1.4. Total Number of Successful Robocalls
- Figure & Table 2.5: Total Number of Successful Robocalls (m), Split by 8 Key Regions, 2025-2030
- 2.1.5. Total Fraudulent Losses to Robocalling
- Figure & Table 2.6: Total Fraudulent Losses to Robocalling ($m), Split by 8 Key Regions, 2025-2030
- Table 2.7: Average Loss to Fraudulent Robocalling ($), Split by 8 Key Regions, 2025-2030
3. Branded Calling Forecast
- 3.1. Branded Calling Forecast Methodology
- Figure 3.1: Total Number of Branded Calling Authentication Calls (9.6 billion), Split by 8 Key Regions, 2025
- 3.1.1. Forecast Methodology & Assumptions
- Figure 3.2: Branded Calling Forecast Methodology
- 3.1.2. Total Number of Branded Calling Authentication Calls
- Figure & Table 3.3: Total Number of Branded Calling Authentication Calls (m), Split by 8 Key Regions, 2025-2030
- 3.1.3. Total Platform Revenue From Branded Calling Authentication Calls
- Figure & Table 3.4: Total Platform Revenue From Branded Calling Authentication Calls ($m), Split by 8 Key Regions, 2025-2030


